Showing posts with label chart of the week. Show all posts

Saturday, July 7, 2012

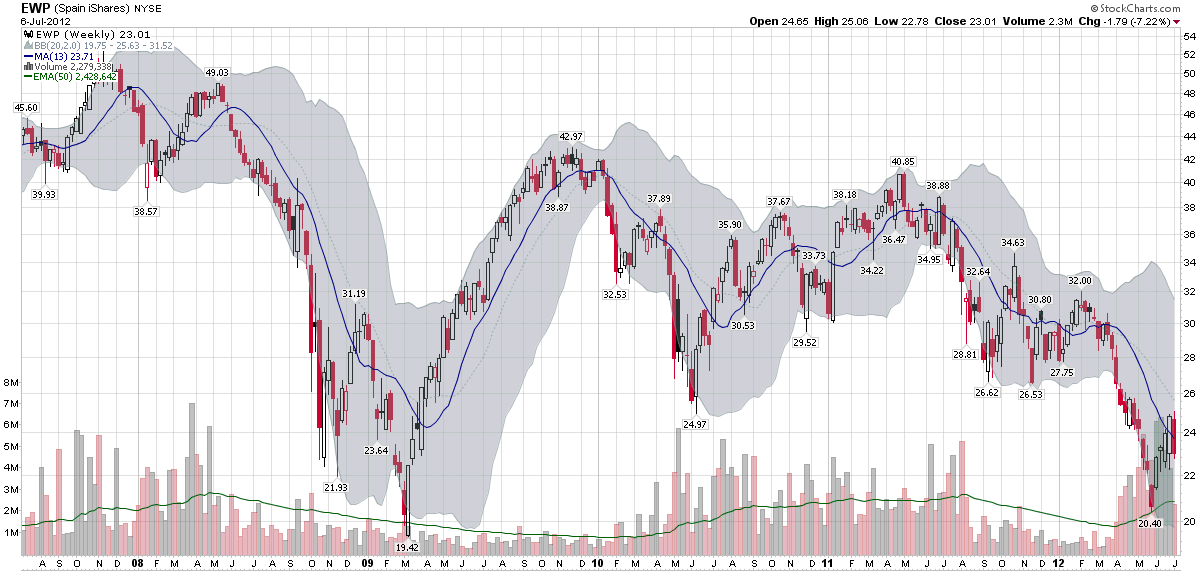
Chart of the Week: As Goes Spain…

Two years ago today, in Spain rallies, I posted a chart of the Spanish ETF, EWP, that showed EWP had rallied off of a bottom and looked like it was poised for a bullish breakout.

In July 2010, I saw Spain as the keystone in the euro zone puzzle:

“Spain is the tipping point in the European sovereign debt crisis as I see it. In a nutshell, as goes Spain, so goes Europe.”

Two years later, I still believe that Spain is the most important line in the sand that euro zone leaders have to grapple with and the country whose fate is probably most intertwined with the future of the euro.

The chart of the week below shows weekly bars of EWP going back five years. The dominant feature in this chart is the financial crisis of 2008-2009. Various iterations of the euro zone crisis can be identified in the bottoms in June 2010, September 2011, November 2011, etc. EWP was in a gradual downtrend from April 2011 to March 2012, but fell sharply until the beginning of June. The most recent bounce in the Spanish ETF still looks somewhat tentative on the charts and is likely to be tested in the weeks and months ahead.

As concerning as the equity situation looks in Spain, the country’s credit default swaps (just 8% off of their all-time highs at 578) and yields on sovereign debt (yields on the 10-year bond are 5% below their all-time highs at 6.95%) indicate an even greater degree of financial stress.

At one time or another, I would expect Italy, France to find their way back into the crosshairs of traders who are looking to capitalize on euro zone angst, but as far as I am concerned, Spain will continue to the most critical line in the sand.

Related posts:

[source(s): StockCharts.com]

Disclosure(s): none

Monday, July 2, 2012

Chart of the Week: VIX Reversal Signal Coming Soon?

Sometimes the simplest ways to analyze the VIX are the best.

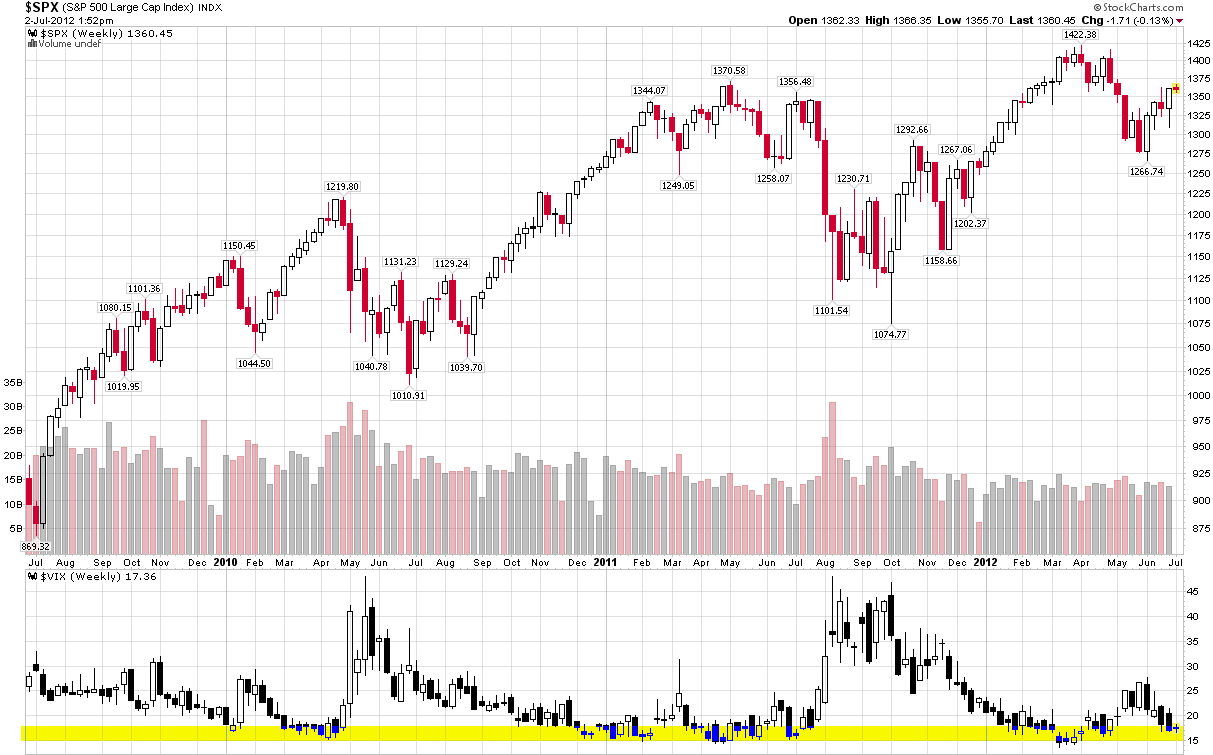
The chart of the week below shows weekly bars of the S&P 500 index and the VIX going back three years. In the VIX study at the bottom, I have also highlighted in yellow the zone from 15-18, which has proven to be a fairly robust zone of support for the VIX during this period. Note that while the VIX has slipped below 15 on occasion, it has eventually bounced off of this support level in each instance and, perhaps more notably, a VIX bottom in the 15-18 range has also coincided with a top in the SPX each time around.

With the VIX in the low 17s as I type this, bulls and bears alike should be on the lookout for signs of a bottom forming in the VIX – and be prepared to position their portfolios accordingly.

Related posts:

[source(s): StockCharts.com]

Disclosure(s): none

Sunday, June 10, 2012

Chart of the Week: The St. Louis Fed’s Financial Stress Index and Market Risk

Determining the risk in the financial markets should get easier with more data, more measures and more experience navigating crisis environments, right? Not so fast.

Right now, for instance, the CBOE Volatility Index (yes, the VIX does have a formal name) is just a shade above its lifetime average, yet the yield on the 10-Year U.S. Treasury Note is just a week away from its all-time low. Granted the Fed has been distorting interest rates with Operation Twist and other policy initiatives, but it has only been in the last month or so that yields have dipped below 1.7%.

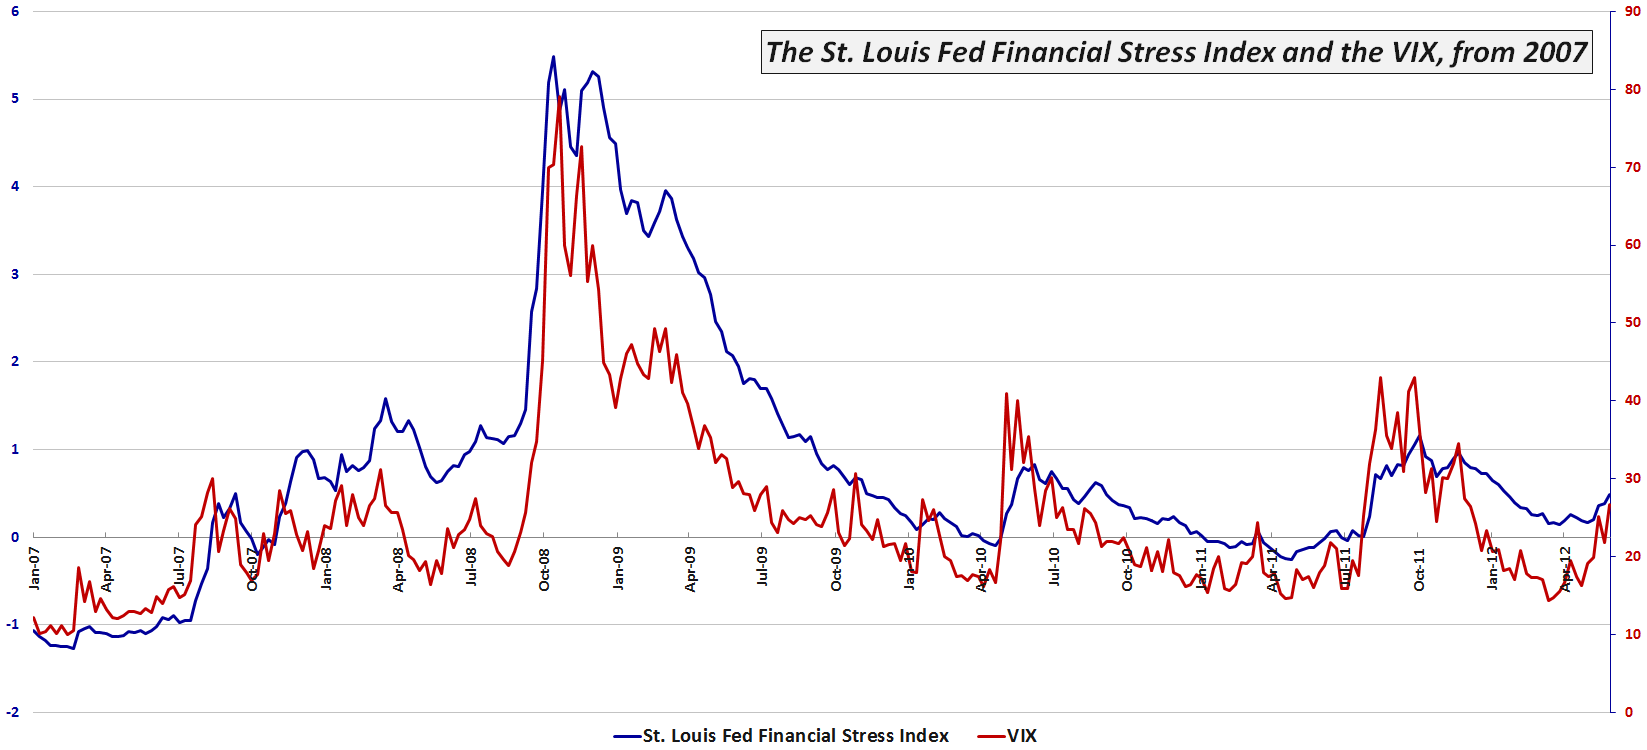
One broad-based tool for measuring risk in the financial markets and related institutions is the St. Louis Fed’s Financial Stress Index (which I refer to as the STLFSI), which has 18 component measures that include a variety of interest rate and yield spread data, as well as the VIX, measures of bond volatility and other data that are correlated with market stress.

This week’s chart of the week below shows the movements in the STLFSI and the VIX since the beginning of 2007. Note that for most of 2012 the VIX has been indicating much less risk and uncertainty than the STLFSI. Only since the middle of May have I observed the VIX rise to a relative level that is consistent with the STLFSI. As of last week, for instance the STLFSI was at the 79th percentile of its lifetime range, while the VIX was in its 82nd percentile. For the record, the divergence was widest in the middle of March, when the STLFSI had a 68th percentile reading, yet the VIX was mired in the 23rd percentile. Financial historians might also be interested to know that the mid-March divergence was the largest since August 2008…

For more information on the components of the STLFSI and the index’s long-term performance, check out an earlier post, St. Louis Fed’s Financial Stress Index, as well as some of the other posts linked below.

Related posts:

[source(s): Federal Reserve Bank of St. Louis]

Disclosure(s): none

Sunday, May 6, 2012

The Hollande Discount

With a little more than an hour to go before the equity markets open in Europe, investors are still attempting to digest the significance of an electoral victory for Francois Hollande in France as well as a much more fragmented political scene in Greece, where the radical leftist Syriza party showed surprising strength.

While the outcome of the election in Greece was very difficult to handicap, the probability of a Hollande victory increased dramatically over the course of the last month or so.

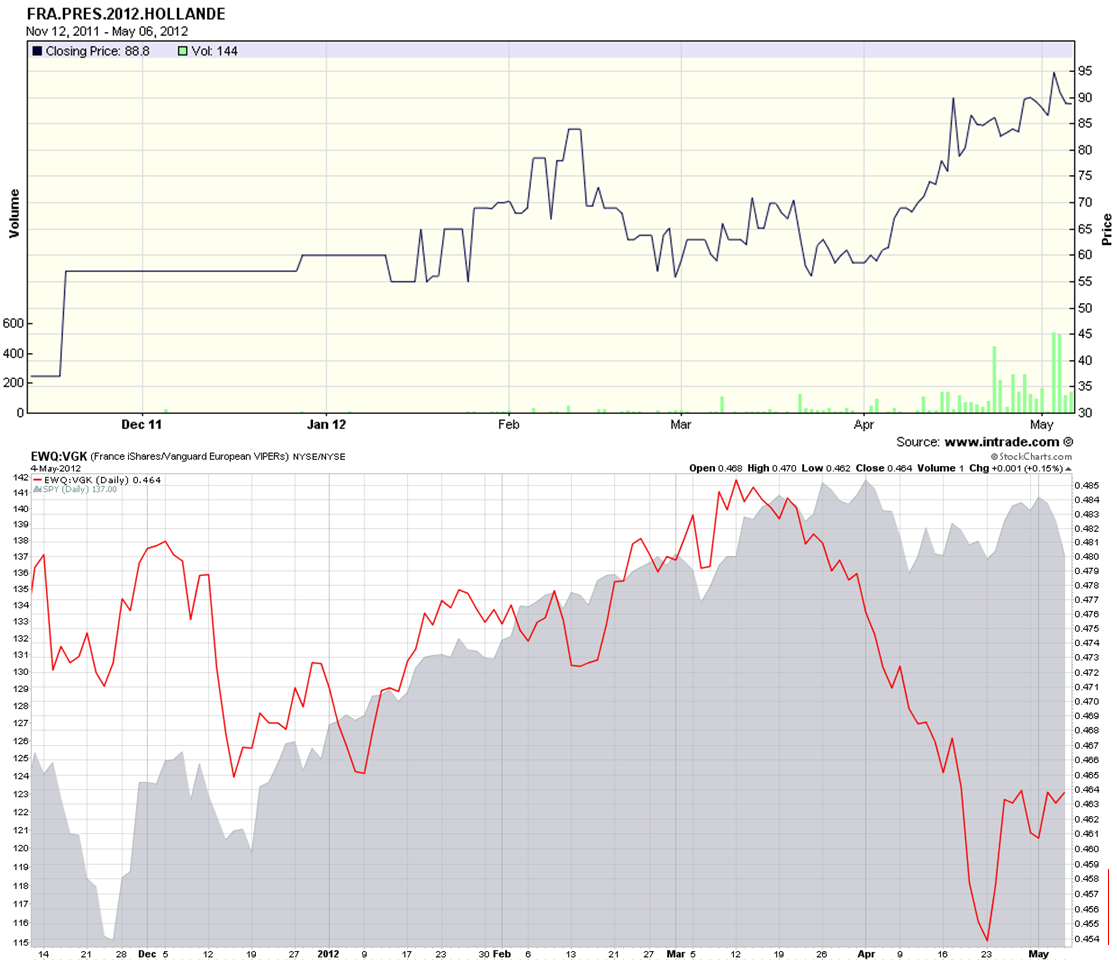
The chart of the week below shows the likelihood of a Hollande victory as indicated by the Intrade election contract (solid black line in upper half of top chart) since the second week of November. At the same time support for Holland was growing, one can see that the expectations for a Hollande victory put pressure on France ETF, (EWQ). The bottom half of the top chart shows a ratio of the EWQ to the broader Europe ETF, VGK as a solid red line. This ratio has declined sharply in conjunction with Hollande’s increasing strength in the polls and has moved in the opposite direction of U.S. stocks (gray area chart) since the middle of March.

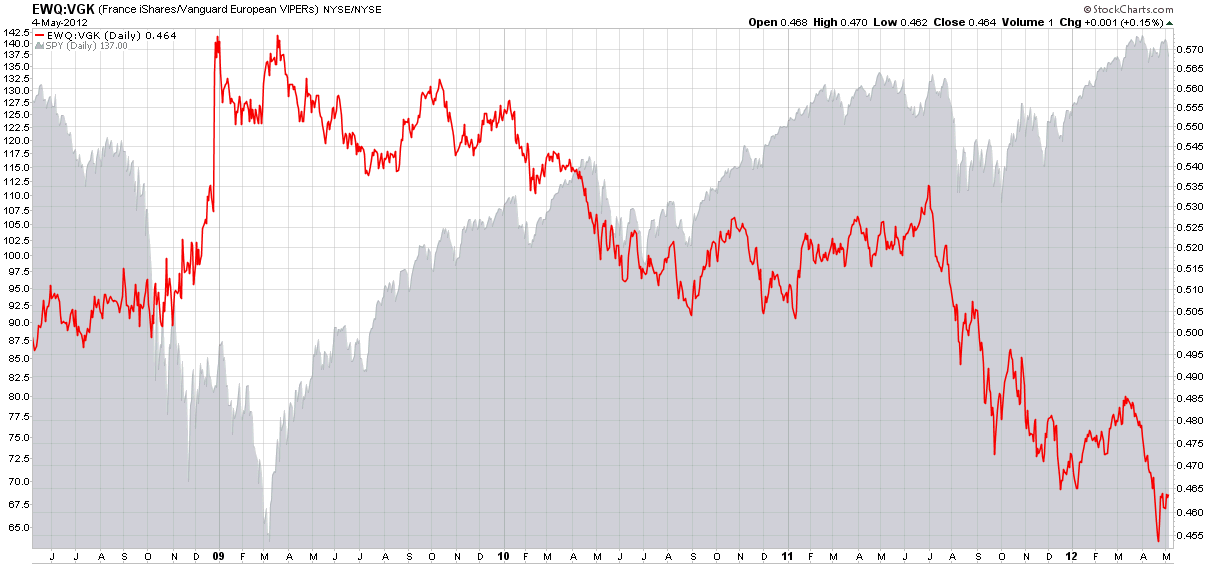
For some additional context, I have also included a bottom chart that captures the EWQ:VGK ratio and the SPY going back four years. Note that France was generally a source of relative strength in the euro zone through June 2011 and has struggled relative to its peer group for most of the past year.

Looking at the full set of charts, it is apparent that the markets have been pricing in the likely impact of a Hollande victory for the better part of a month. With U.S. equity futures down approximately 1% as I type this, my sense is that the Hollande discount has almost completely priced in, but the increased uncertainty in Greece is likely to roil the markets and put a jolt into volatility expectations for at least the next few weeks going forward.

Related posts:

[source(s): StockCharts.com, Intrade.com]

Disclosure(s): none

Sunday, April 29, 2012

Chart of the Week: Sector Winners and Losers

While there was a lot going on in the sector space during the rally from October to April and the pullback earlier in the month, I have yet to see any sort of detailed explanation of what happened during these two periods.

This week’s chart of the week below attempts to bridge this gap, with a four-chart comparison of the bull move from October 4, 2011 to April 2, 2012 as well as the bear pullback from April 2 to April 10, 2012. The top two charts cover the bull move, with the left chart capturing absolute sector performance and the right chart capturing sector performance relative to the changes in the S&P 500 index as a whole. The bottom two charts also have absolute sector performance on the left and relative sector performance on the right, but this time during the April 2-10 pullback.

The absolute data show that all sectors moved up during the bull move and fell during the bear move. The relative data allow for a more nuanced analysis that shows financials (XLF) were the main engine behind the bull move and also the largest contributor to the pullback. While financials shared some of the credit with consumer discretionary stocks (XLY), industrials (XLI) and technology (XLK) on the way up, it was materials (XLB), energy (XLE) and industrials that helped to pull the broader index down. Only two sectors have outperformed the S&P 500 index on the way up and on the way down: technology and consumer discretionary stocks. Conversely, energy has been the only laggard in both directions.

While not reflected in these charts, in the three weeks since the April 10th bottom, consumer discretionary, materials and industrials have been the biggest contributors to bullish moves. Interestingly, technology has now flipped to being the biggest drag on performance.

One could make a fairly good case that the ability of the S&P 500 index to make a run at 1500 (take a bow, James Altucher) will in large part be a function of the degree to which technology returns to a leadership role.

Related posts:

[source(s): StockCharts.com]

Disclosure(s): long XLY at time of writing

Sunday, April 15, 2012

Chart of the Week: Don’t Blame China

Last week’s financial headlines were dominated by Spain and China. In the case of Spain, this was largely due to increased borrowing by Spanish banks from the European Central Bank. For China the culprit was Q1 GDP growth of only 8.1%, which was down from 8.9% in Q4 2011 and well short of the 9.0% whisper number that made the rounds in the day leading up to Friday’s announcement. In fact, once could certainly argue that it was China’s GDP whisper number that was the main catalyst for Thursday’s big rally that was essentially reversed on Friday.

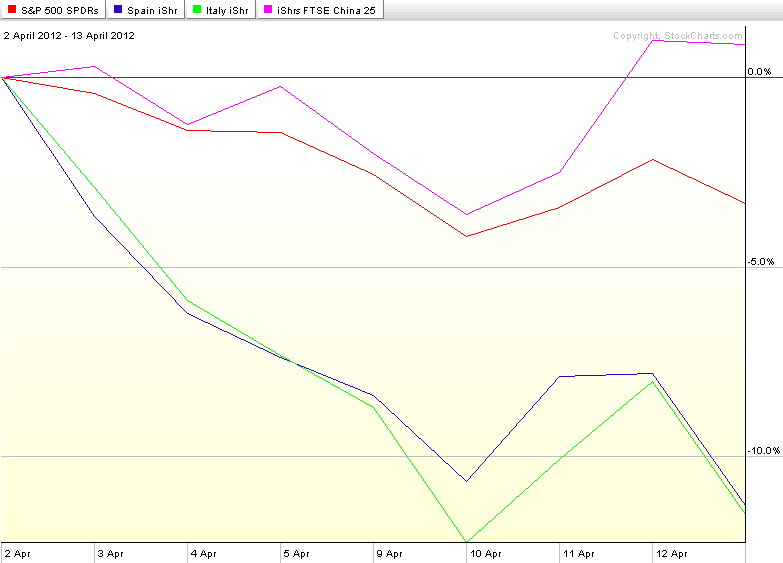
The chart of the week below shows the performance of SPY as well as country ETFs for Spain (EWP), Italy (EWI) and China (FXI) since stocks put in a top two weeks ago tomorrow. The chart shows that while SPY has been declining, country ETFs for Spain and Italy have been falling approximately three times as quickly as their American counterparts. And China? Well, don’t blame China for the woes in the U.S. stock market. While U.S. stocks have been selling off, the performance of the popular iShares FTSE/Xinhua China 25 Index, FXI, has managed to post a 0.9% gain.

[As a side note, about a year ago I discontinued the Chart of the Week, an extremely popular feature in this space since its launch in 2008, as my posting had become sporadic. Going forward I hope to be able to continue my recent regular posting and make this a weekly feature that not only shines a light on key developments of the past week, but also has some archival value as well.]

Related posts:

[source(s): StockCharts.com]

Disclosure(s): none

Monday, January 16, 2012

Navigating VIX and More by the Labels

Saturday’s Five Years of VIX and More received enough broad-based interest that apparently attracted quite a few new readers. Several of these new arrivals have asked me for some assistance in finding their way around the blog; and rather than continuing to respond individually, I thought making some of my thoughts public might provide assistance to a wider audience, both new and old.

First things first, if you arrived on the blog looking for information on a specific topic, the best place to start is with the Google custom search feature, which is in the right hand column of the blog, a box under which carries the label “Search the VIX and More blog” and lies just above the orange RSS feed icon.

According to Blogger, this is post #1483. If Google turns out to be too cumbersome of a way to find what you are looking for, labels may be a better and more targeted way to go. It turns out that I have applied 1065 different labels to these posts. The list of labels which I have associated with each post can be found at the very bottom of each post and serve as hyperlink filters that automatically pull up all posts which have been tagged with the same label. The labels include almost every ticker that has ever appeared on the blog, keywords, phrases and some general reference labels, such as hall of fame , archival, educational, lighter side, etc. I do my best to capture some of the recurring themes that run through the blog, but the labels are somewhat arbitrarily assigned by me and I must confess that there are times when I probably forget to use important labels or retroactively tag posts that are ideally suited for new labels.

Today I took the opportunity to examine the frequency of all the labels I have ever used on the blog. Topping the list was Chart of the Week, which refers to a feature I rolled out in November 2008 to help make sense of all the chaos of the times. This was a weekly feature through the end of 2010 and was phased out in the beginning of 2011. Now that I am increasing the frequency of my posting, I suspect I will bring back the Chart of the Week in short order.

Second on the list of most frequently used labels is VIX futures. This should come as no surprise to regular readers of the blog, as VIX futures are the foundation for understanding the entire VIX product space, including VIX options and VIX exchange-traded products.

In the third spot is VXX, which is the top ticker on the blog. Quite a few readers of this blog are VXX and volatility specialists and I take a great deal of pride in being the first destination site for that product and arguably still the best reference available for the broader list of VIX ETPs.

Scrolling down the list of labels, #4 is VIX spikes, one of my favorite subjects when it comes to trading the VIX. At #5 is VWSI, also known as the VIX Weekly Sentiment Indicator, which is the precursor to the Aggregated Market Sentiment Index (AMSI) that is featured exclusively in the VIX and More newsletter.

Looking farther down the list implied volatility comes in at #6 and historical volatility comes in at #10. This is not a big surprise, but it leads me to believe that I probably pay more attention to HV than most other traders – or at least than those who blog about the subject.

Just outside the top ten, the top index in the labels is the ISEE, a call to put ratio that is published by the ISE. The ISEE is also a component of the AMSI. It is something have not blogged about in a while – and I will be sure to remedy this soon.

Of the many ratios I track, the one with the most mentions on the blog is VIX:VXV, which was nearly flawless as a market indicator during its first 18 months following the launch of VXV, then struggled with some of the volatility idiosyncrasies that crept into the markets following the March 2009 bottom.

Also worth nothing is the top country, China, and the top options position, the strangle. China comes as no surprise, but the strangle does, as I consider myself more of a straddle guy than a strangle guy. My guess is that the ranking of options trades is somewhat distorted by that fact that when I translate some of my trading ideas for the benefit of others, I often make the trade idea a more simple or conservative one, such as substituting a strangle for a straddle.

Finally, there were three particular ‘blast from the past’ labels that remain among the all-time most used labels. These harken back to earlier incarnations and attitudes here, as well as a wider-ranging sense of subject matter:

  1. links – before Tadas Viskanta at Abnormal Returns and Charles Kirk at The Kirk Report created a near monopoly on link collections, many bloggers had their own link fests. Mine were heavy on volatility, ran from 2007-2009 and provide for an interesting historical perspective on what people were thinking about with respect to volatility and risk before, during and after the 2008 crisis
  2. wine pairing – imagine my surprise when I discovered that more posts were tagged with the ‘wine pairing’ label than with China, European sovereign debt crisis, VXV, VXN, etc. There was a time when a reader wondered aloud, mostly in jest, I’m sure, about how I might pair wines with the various VIX Weekly Sentiment Indicator readings. Never one to back away from a creative challenge, I jumped right in…
  3. CNBC Million Dollar Portfolio Challenge – I have no idea how many times CNBC has tried this contest, but I’m fairly sure the March-May 2007 version I participated in was the first one. I was new to blogging when I started posting about this, but I was surprised by how many people took some vicarious pleasure in my plight and also wanted more details about my approach in order to help them find the most volatile stocks and increase their chances of landing at the top of the charts. My rise was meteoric, but I risked it all in going for the win and fell back to earth just like Icarus.

Related posts:

Disclosure(s): short VXX at time of writing
Thursday, December 29, 2011

Top Posts of 2011

It seems hard to believe, but next week I will celebrate the fifth year anniversary of my first post (VIX and More: An Introduction) at VIX and More. Traditionally I have set aside some time at the end of the year to recognize the top 25 most read posts for archival purposes and as a proxy for how well some of what I have written has resonated with a broad base of readers. For the record, each year I also attach the hall of fame label to a handful of posts that I believe have particularly compelling and/or original content, regardless of readership.

Looking at the top posts of the year below, this is the first year there has been a strong representation from shorter more Twitteresque posts, with a diminution of the long-winded more academic research pieces that have populated these lists in past years. Part of this is no doubt due to timing. By way of illustration, when the VIX is over 40, pretty much anything I post is going to attract a wide audience of people who want to know how to interpret recent market moves and understand the implications for the direction of stocks and volatility going forward. On the other hand, when I write one of my better thought pieces and the VIX is at 14, it is sometimes a struggle for that post to find a broad audience.

Another theme I noticed this year is that the list is heavier than usual on the VIX, VIX-based exchanged-traded products and volatility subjects. In previous years I have enjoyed straying for the central themes of this blog and have used features such as the Chart of the Week (discontinued in February when my blogging took a back seat to family matters, but likely to return in 2012) as an excuse to focus on a broader basket of investment themes.

This year has been a target-rich environment in the volatility space and I hope I have been able to expand the knowledge base of those who visit here on a regular basis. Thanks to all whose efforts have contributed to making VIX and More what it is and best wishes for a healthy, happy and prosperous 2012.

  1. VIX Term Structure Evolution Over the Last Ten Days
  2. VIX Suggests Investors Don’t Believe Rally Is Sustainable
  3. Shorting VXX and Long XXV or XIV
  4. The Year in VIX and Volatility (2010)
  5. VIX Backwardation Commentary
  6. Echo Volatility and Another VIX Double Top
  7. Managing Risk with a Short VXX Position
  8. S&P 500 Index 20-Day Historical Volatility Hits 39-Year Low
  9. Front Two Months of VIX Futures Slip Back Into Contango
  10. SPX Pullback History, 2009-2011
  11. VIX Over 31 and SPX Down 12.5% from Peak as Bottom Nears
  12. Chart of the Week: The Year in Economic Data (2010)
  13. Chart of the Week: World Food Prices
  14. VIX Sets Some New Records, Suggesting Volatility Near Peak
  15. Chart of the Week: VXX Celebrates 2nd Birthday
  16. New VIX Backwardation Record
  17. VIN, VIF and an Obsolete VIX
  18. Now Sixteen Volatility ETPs, Four of Which Are Optionable
  19. Economic Data Not Supporting Gloom and Doom Forecasts – At Least for Now
  20. VIX Reflecting Skepticism About Rally
  21. Initial Thoughts on Using the iPad for Trading
  22. The Convergence of VIX and VIX Futures at Expiration
  23. Is Volatility a Better Play for Silver Than Direction?
  24. December Is the Cruelest Month…For the VIX
  25. Chart of the Week: the VIX Since 2007

Related posts:

Disclosure(s): none

Monday, April 25, 2011

Chart of the Week: VXV at Critical Juncture

It seems almost like heresy to consider something other than silver or the VIX as a candidate for the Stock of the Week, but since there have been so many posts and charts about both subjects, I thought I might offer a slightly different twist.

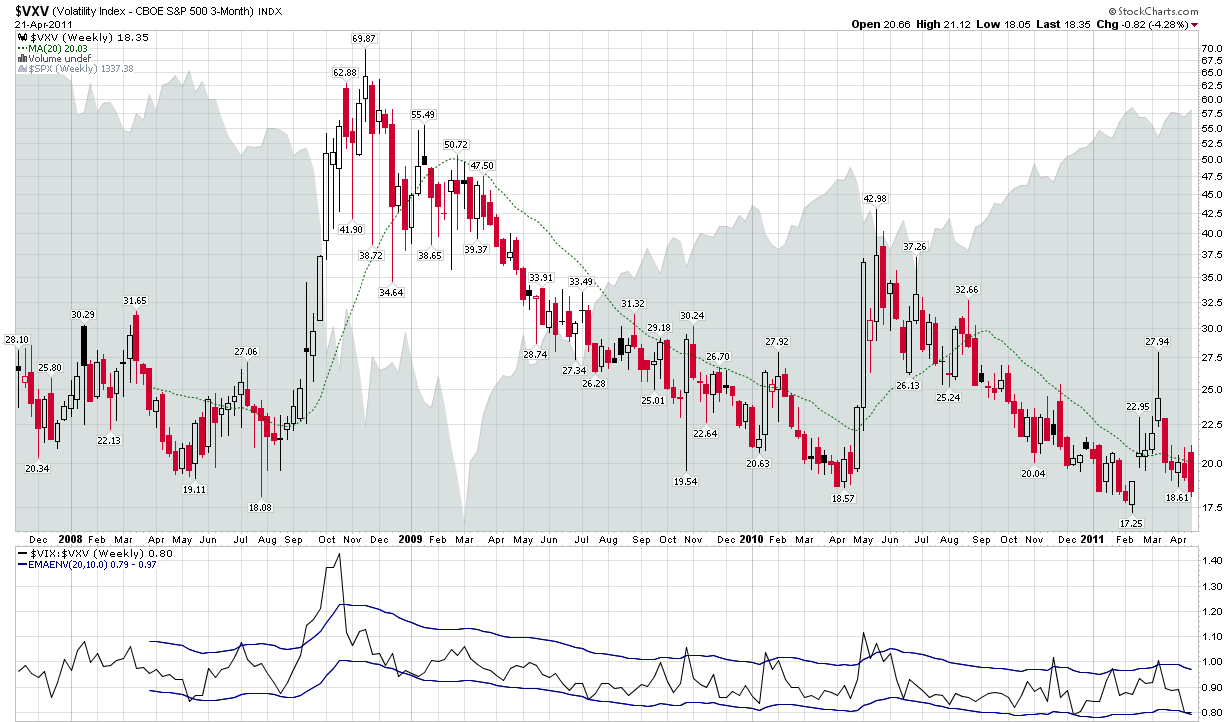
Yes, it is time for me to trumpet the importance of VXV once again. For those who may have forgotten, VXV’s formal name is the CBOE S&P 500 3-Month Volatility Index. The CBOE describes the index in detail here, but the key takeaway is that VXV is essentially a 93-day version of the 30-day VIX. In other words, whereas VIX looks out at just one month of potential volatility and disruptions to the financial markets, VXV has a time horizon of one quarter. This means, among other things, that while both capture the essence of the Q1 earnings reporting season, VXV includes three FOMC meetings and three nonfarm payroll reports, among other things. And whereas there may be no significant developments regarding Greek debt restructuring, it is unlikely that this issue will not be addressed in the next three months.

For these and other reasons, I have always felt that VXV provided a better reflection of long-term and structural/systemic volatility than the VIX, which is better suited to measuring short-term event volatility.

Looking at a weekly chart of VXV since its October 2007 launch, one cannot help but notice a pattern of historical support in the 17.50 – 18.00 zone. Friday’s close took VXV down to 18.35. A couple of closes below could signal not just a change in structural volatility and longer-term risk, but also the arrival of a new volatility regime.

Related posts:


Disclosure(s): neutral position in VIX via options at time of writing

[graphic: StockCharts.com]

Monday, April 4, 2011

Chart of the Week: Crude Oil and Transports

With crude oil prices hovering around $108/bbl. level, it is only natural to begin wondering just what kind of impact crude prices will have on stocks.

Looking back at recent history, crude oil and stocks have been positively correlated, largely because an improving economy translates into increased demand for crude oil. At some point, of course, rising crude oil prices are going to translate into a drag on GDP and on equities. Consensus estimates for the impact of crude oil on GDP generally assign about a 0.25% drop in U.S. GDP for every $10 increase in crude oil.

Whether the negative correlation between crude oil and stocks begins to become apparent at $110 or perhaps at higher levels remains to be seen.

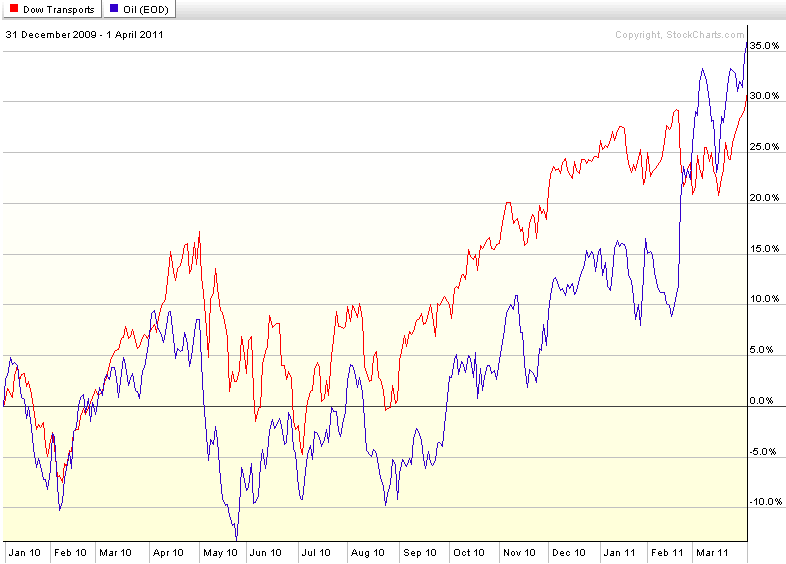
When oil prices begin to be a significant drag on stocks, it will likely show up first in the transportation sector. Looking at the Dow Jones Transportation Average (DJTA) and (West Texas Intermediate) crude oil prices since the beginning of 2010 in this week’s chart of the week, it is obvious that the positive correlation between crude oil prices and transports has continued all the way up to the present. While I expect this positive correlation to end shortly, as long as transports continue to move up in concert with rising crude oil prices, investors should feel comfortable with their long positions in equities.

Related posts:


[source: StockCharts.com]

Disclosure(s): long crude oil futures at time of writing

Sunday, February 27, 2011

Chart of the Week: Flight to Safety ETPs

It has already been an interesting year for students of market sentiment, volatility and geopolitical influences on financial markets. We have seen revolutions of various sizes and shapes in the likes of Tunisia, Egypt and Libya, with smaller uprisings in Bahrain, Algeria and elsewhere in North Africa and Middle East. For the most part, volatility in the equity markets has been rather muted prior to the Libyan revolution and its influence on crude oil prices.

In this week’s chart of the week, I examine the year-to-date performance of five exchange-traded products (ETPs) that are central to the flight-to-safety trade. They include volatility (VXX), gold (GLD), oil (USO), the dollar (UUP) and U.S. Treasuries (TLT).

Note that with the exception of crude oil, the political unrest in North Africa and the Middle East has not been disruptive enough to make these trades profitable ones in 2011, though there has been an uptick across the board since violence heated up in Egypt on January 25th and in Libya starting on February 15th. The VXX chart does an excellent job of capturing the nature of the VXX gambit. Even with the geopolitical turmoil and spike in crude oil prices, this ETN is still down 16.2% on the year. The volatility spikes have provided VXX longs with very short-lived opportunities to capitalize on heightened market anxiety, with the chart reflecting the continued downward trend and high volatility in this ETN. [As an aside, a similar chart swapping VXZ for VXX would show very little difference in terms of performance.]

So the next time you think about a long volatility position in the context of a geopolitical crisis, give some strong consideration to some alternative flight-to-safety plays.

Related posts:


[source: ETFreplay.com]

Disclosure(s): long VXZ, short VXX, USO and TLT at time of writing

Monday, February 7, 2011

Chart of the Week: EGPT and Collateral Damage

Unrest in Egypt is barely three weeks old and already the ripple effect has crossed the globe in several waves.
I find it interesting how regional and country ETFs can be of some assistance in evaluating how investors are thinking in terms of contagion risk, be it political or economic – or at the very least in terms of the breadth and depth of the economic impact of specific events.

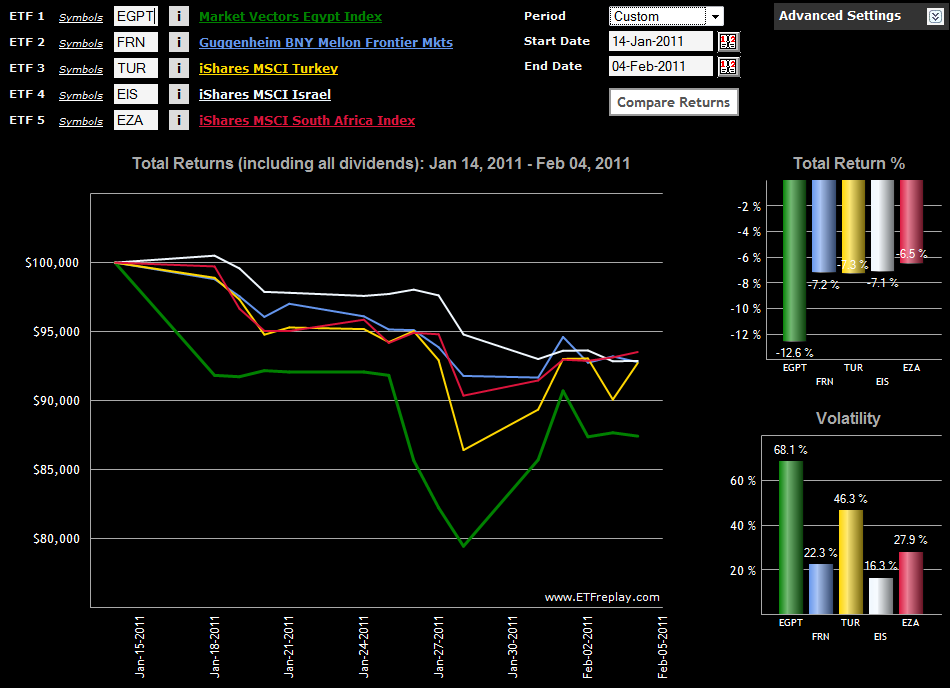
In this week’s chart of the week, I endeavor to track some elements of the relative geographical spread of concern with a handful of ETFs. The baseline ETF, EGPT, shows how the situation deteriorated over the long weekend in the U.S. from January 14th to January 18th, then began to accelerate downward during the January 26th trading session.

In terms of impact, the additional four ETFs include one broad-based frontier ETF, FRN, and three single-country ETFs: Turkey (TUR); Israel (EIS); and South Africa (EZA). Of this group, the Turkey ETF has proven to be the most volatile during the crisis and also suffered the largest drawdown. Interestingly, the Israel ETF has been the least volatile of the group, but the only one which appeared not to find a bottom on January 28th and continued to trend lower. The top performer of the group is EZA, the South African ETF. EZA has fallen slightly more than half as far as EGPT since the beginning of the crisis and has steadily gained strength during the past week. Among country ETFs, EGPT and TUR were the top two performers during the past week.

Note that there are several regional ETFs which cover northern Africa and the Middle East. I discussed these during the Dubai crisis at some length in Frontier ETFs and Chart of the Week: Market Vectors Gulf States ETF (MES).

Related posts:


[source: ETFreplay.com]

Disclosure(s): long TUR at time of writing

Sunday, January 9, 2011

Chart of the Week: World Food Prices

Talk of rising commodities prices seems to focus primarily on energy and metals, with agricultural commodities often overlooked, at least in the United States.

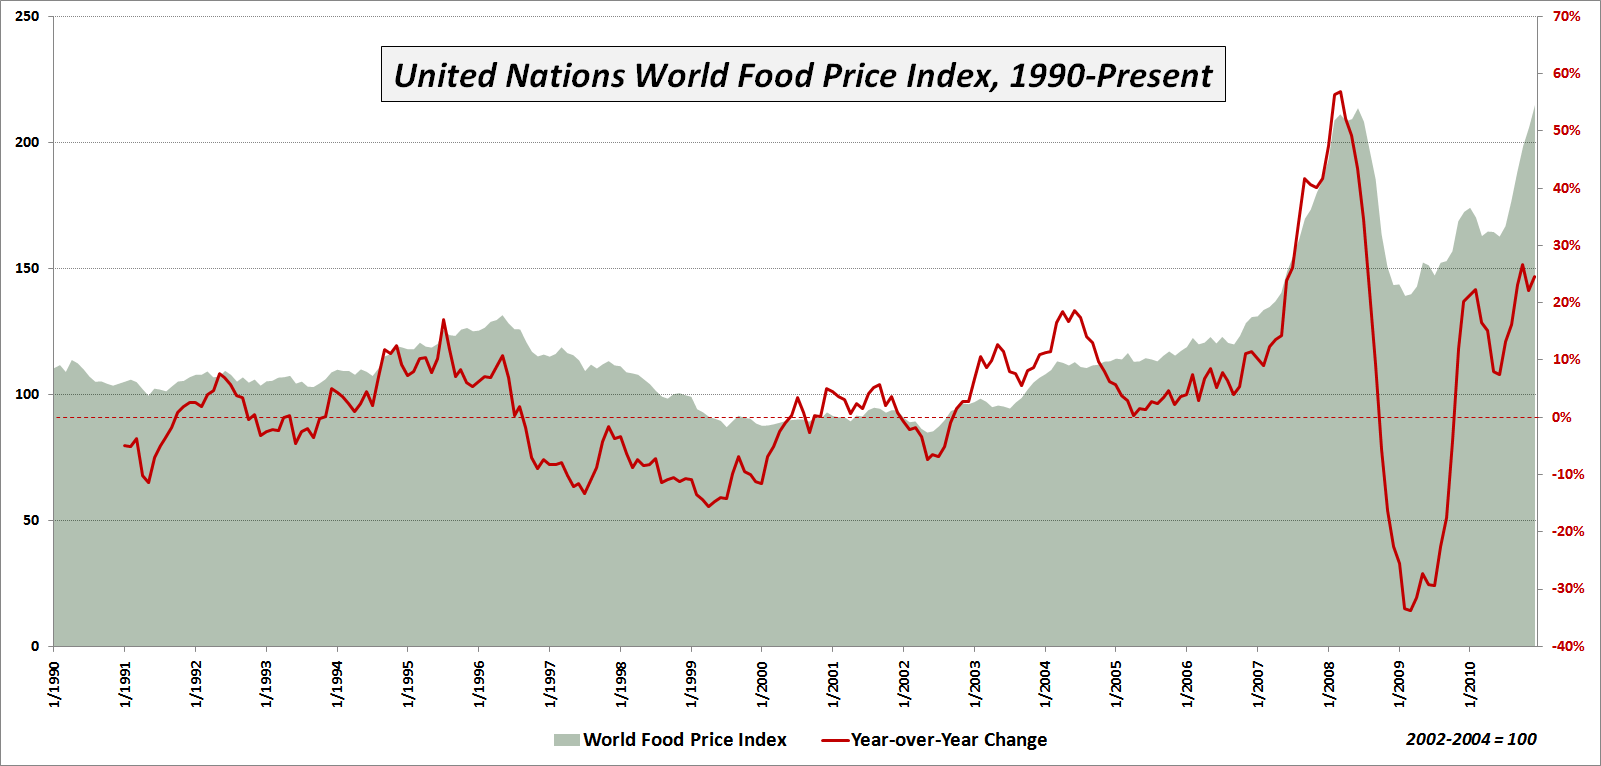
This week’s chart of the week is intended to underscore the inflationary trend in agricultural commodities and ‘softs’ (which generally refer to sugar, coffee and cocoa) as reflected in the United Nations World Food Price Index. As the chart below shows, world food prices hit a new high in December, after jumping more than 54% from a February 2009 low. The new high in the index eclipses the old high from June 2008.

Among the various sub-indices, the most dramatic increase has been seen in sugar, which is up 51% in just four months and is up a staggering 239% over the course of the past two years to a new all-time high. Meat prices are also at new highs, but while the sugar price index currently stands at 398.4, meat has only risen to 142.2. Note that all index values reflect a baseline of 100 that is derived from the 2002-2004 average prices.

Commodities prices have both economic and political implications. The economic implications are particularly severe for emerging markets in which food costs represent a disproportionately high percentage of the typical household budget. Here the incremental increase in food prices can have a disastrous impact on the family cost structure. There are also some countries where the possibility of food riots and related civil unrest has the potential to destabilize those who are in power and in some cases perhaps even thrust the political system into chaos.

So far rising food prices have triggered only a mild backlash here and there, but should prices continue to rise at the current rate of more than 20% per year, it is not possible to rule out catastrophic consequences across the globe.

Related posts:


[source: United Nations]

Disclosure(s):
none

Monday, December 27, 2010

Chart of the Week: U.S. Retail Gasoline Prices

As more and more data points begin to suggest that the green shoots of months past are finally showing signs of developing, concerns about supply and demand in the energy space are starting to heat up again.

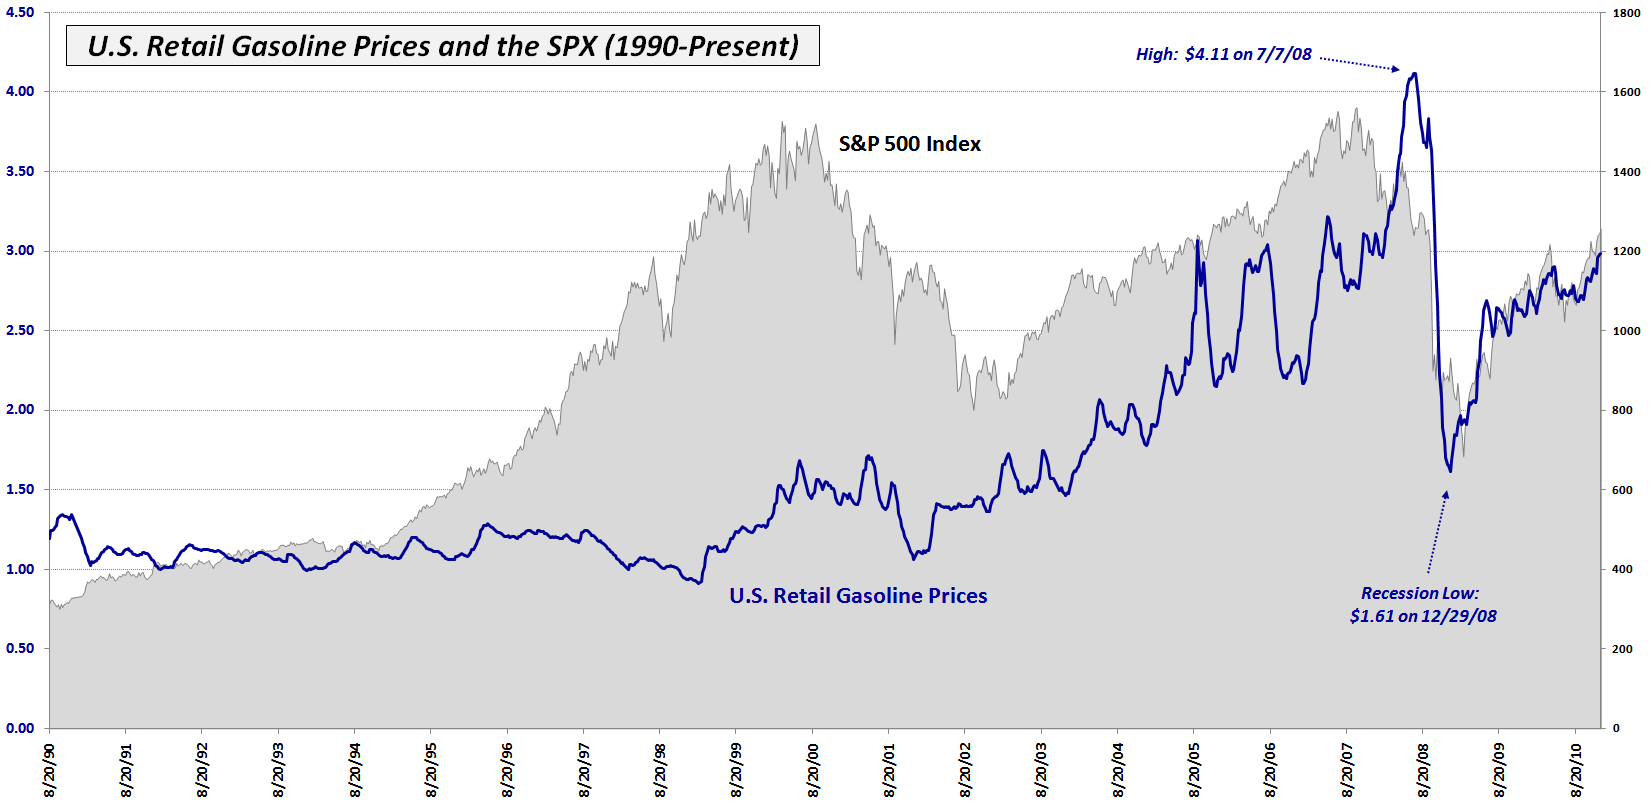
In the past week, the average retail price of gasoline in the United States shot up to $2.98 per gallon (and $3.29 per gallon in my home town of San Francisco, but who’s counting?) to a post-crisis high.

This week’s chart of the week shows 21 years of retail gasoline prices in the U.S. (blue line) plotted against a backdrop of the S&P 500 index (gray area chart.) Note that gasoline prices peaked in July 2008 at $4.11 per gallon and fell all the way to $1.61 per gallon by the end of the year, less than six months later.

Not surprisingly, gasoline prices peaked after stocks did and followed stocks down during the financial panic. Interestingly, gasoline actually bottomed about 2 ½ months before stocks and the two have been tracing a very similar pattern back up toward previous highs during the course of the past two years.

Going forward, continued increases in gasoline prices should begin to put pressure on consumer spending and slow down economic growth and the rebound in stocks. Whether this phenomenon begins to show up just on the other side of $3.00 per gallon or at much higher levels remains to be seen, but it is an important factor in the ability of consumers to repair their balance sheet, increase their spending, and power the 70% of the GDP that relies on consumer spending to drive growth.

Related posts:


[source: Energy Information Administration]

Disclosure(s): none

Monday, December 20, 2010

Chart of the Week: Historical Volatility Plummets in Seasonal Swoon

‘Tis the season for the annual holiday effect in which historical volatility (HV) has a strong tendency to plunge and drag implied volatility down with it. This is a subject I have tackled on a number of occasions in the past (see links below) and is really just a longer variant of what I call calendar reversion – the tendency of the VIX to fall an extra 1% or so on Fridays due to market makers adjusting prices ahead of the weekend. The lack of volatility all boils down to the same root cause: fewer trading days during the 30 calendar day window specified by the VIX (and implied volatility in general) means there are fewer opportunity for stocks to stray significantly from the path projected by efficient markets, standard deviations and the rest of the normalcy regime.

As of Friday’s close the S&P 500 index had a 10-day historical volatility of 5.5, which is the lowest reading since May 2007. In this week’s chart of the week below, I have elected to show the 10-day historical volatility of the Russell 2000 small cap index (RUT), which traditionally has higher volatility than the SPX and is also more susceptible to the winds of economic change and uncertainty. As the chart shows, 10-day historical volatility (white line) sits at a two-year low and has helped to pull the implied volatility (red line) of the index down below 20. Note that last week the CBOE Russell 2000 Volatility Index (RVX) dipped as low as 19.55 and is threatening to drop below the 19.00 level for the first time since June 2007.

After the first of the year I expect to see the holiday effect magically disappear and HV, IV and volatility indices begin to reflect a more accurate view of investor expectations.

Related posts:


[source: Livevol.com]

Disclosure(s): Livevol is an advertiser on VIX and More

Monday, December 13, 2010

Chart of the Week: Banks on a Tear

There were many cross-currents in the financial markets during the last week, but one of the dominant themes was the spike in Treasury yields. As expectations for interest rates move higher, the banks are also catching a bid. Long able to borrow at Bernanke-induced artificially low rates, now banks are finding better prospects on the lending side – and have the added bonus of a larger yield spread on their loans as interest rates start to climb.

These factors make banks the focal point of this week’s chart of the week. In the graphic below, note that the upper study shows banks have been consistently underperforming the S&P 500 index for the past seven months. In the last week, however, banks have shown a dramatic turnaround that has lifted KBE, the popular bank ETF, above resistance (dotted blue line) and also reversed the trend of outperforming the broader market.

As was the case in 2010, the performance of the banks will be a critical factor in the performance of the broader market in 2011. Said another way, banks will continue to be a critical barometer not just of global growth, but of the ability of various economies to deal with threats to growth, such as sovereign debt and other issues.

Related posts:


[source: StockCharts.com]

Disclosure(s): long KBE at time of writing

Sunday, December 5, 2010

Chart of the Week: VIX Support

In this week’s chart of the week, I have created a chart of the VIX going back to June 2007 which uses weekly bars to show that just about the time stocks made their 2007 pre-crisis highs, the VIX was establishing the 17-18 area (yellow bar) as a zone of support.

During the past three plus years, the VIX has frequently found support in the 17-18 zone before bouncing higher. In fact, the one time the VIX has made its most impressive break below the 17-18 zone was back in April, just before the European sovereign debt crisis hit and pushed the VIX all the way up to 48.20, which just happens to be the highest VIX level recorded outside of the financial crisis of 2008-2009.

For this reason, VIX puts are extremely inexpensive right now and one can actually buy VIX puts for March, April and May of 2011 for less than half the price of what the December 2010 puts are currently being offered.

Related posts:


[source: StockCharts.com]

Disclosure(s): neutral position in VIX via options at time of writing


Sunday, November 28, 2010

Chart of the Week: The Resurgent Consumer and Holiday Shopping

During the first half of 2010, a recovery in manufacturing helped to lift stocks. When manufacturing plateaued, stocks gave up their gains. Now it looks like manufacturing may be picking up again, but it has been consumer spending that has been responsible for much of the recent rise in equities.

There are two large ETFs devoted to retailers, XLY and XRT. While neither is a great proxy for the types of stores most likely to compete for our holiday shopping dollars, they will both pick up the major trends. I tend to have a slight preference for XRT over because XRT has more holding and these are more equally distributed. The top holding for XLY, for instance, is McDonalds (MCD).

In this week’s chart of the week below, I show the performance of XRT over the course of 2010. Note that earlier in the month XRT broke above its April high and has continued to maintain a bullish trajectory since then. Of particularly interest is the sector’s performance relative to the S&P 500 index (top study), which has been very strong since stocks began to rally in the beginning of September.

With the holiday shopping season off to a good start, XRT makes an intriguing momentum play and should be a barometer of the strength of U.S. consumer throughout the holiday season.

Related posts:


[source: StockCharts.com]

Disclosure(s): none

Sunday, November 21, 2010

Chart of the Week: European Stocks Holding Up Well

Six months ago the European sovereign debt crisis was flaring up and my chart of the week was the Flight-to-Safety Trade.

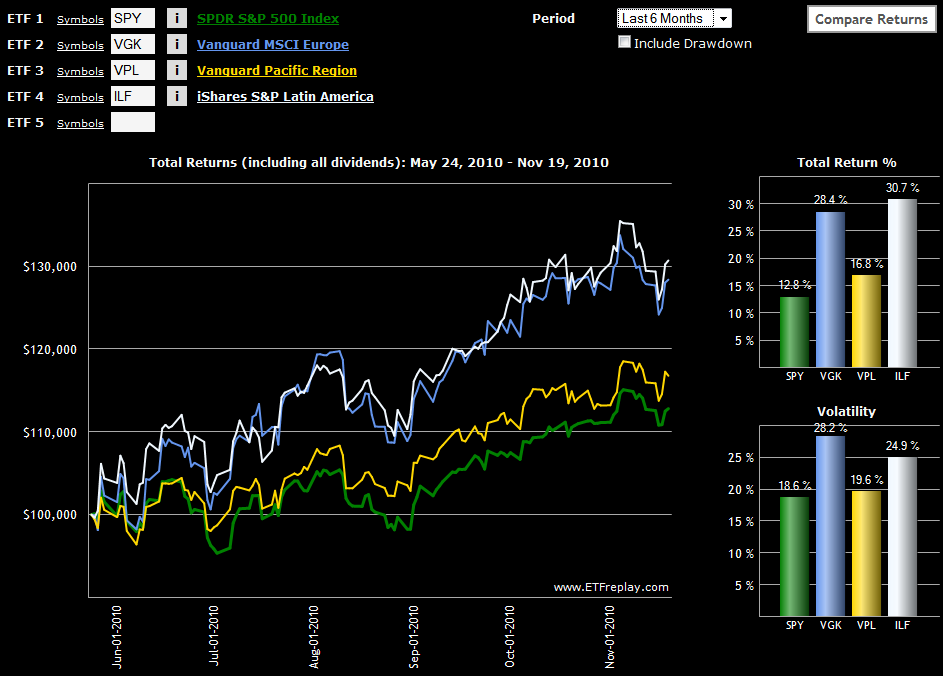
With the joint EU-IMF bailout of Ireland unfolding over the weekend and the future of Greece and Portugal in the euro zone also being called into question over the course of the past two weeks, this seems like a good time to compare the performance of Europe against some of the other continents.

While relative performance is almost always dependent upon the date one picks as a starting point, I still think many will be surprised to see in this week’s chart of the week below that at least over the course of the past six month,s Europe (VGK) has performed on par with Latin America (ILF) and has significantly outperformed Asia (VPL) and the United States. Should Europe be able to finish the year without giving up any ground to its counterpart regional ETFs, I think the continent should be allowed to exhale and declare victory, at least for 2010.

For more on related subjects, readers are encouraged to check out:


Disclosure(s): none

[source: ETFreplay.com]

Sunday, November 14, 2010

Chart of the Week: Uptick in the Jobs Picture

Lost in all of the attention paid to Ireland, China, Cisco (CSCO) and the week’s other headline grabbers was some signs of progress on the jobs front, specifically in the area of the weekly jobless claims data.

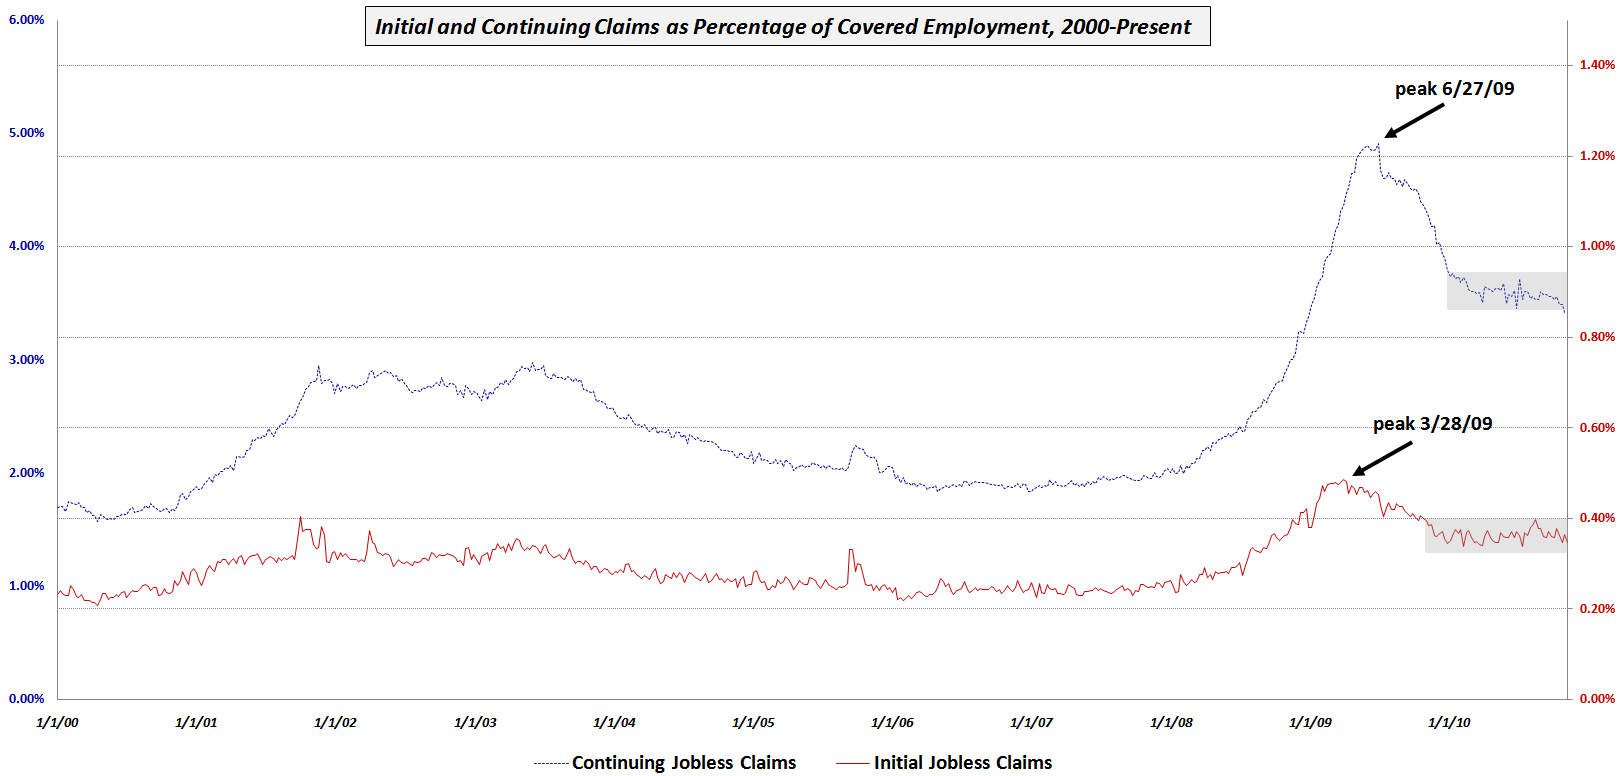
This week’s chart of the week shows initial and continuing jobless claims since 2000 as a percentage of total covered employment in order to adjust for the changing size of the workforce. Note that while initial claims (solid red line) peaked first in March 2009, they have been in a holding period for the last year or so. Continuing claims (dotted blue line) peaked three months later and initially showed a sharper decline. While continuing claims began to form a plateau earlier in the year, the last month or so has seen noticeable improvement, with the trend line now dropping below the gray rectangle which marks the recent consolidation area.

This improvement could be a precursor to some downward movement in the unemployment rate, which may show up as early as in this month’s data.

Related posts:


[source: Bureau of Labor Statistics]

Disclosure(s): none

DISCLAIMER: "VIX®" is a trademark of Chicago Board Options Exchange, Incorporated. Chicago Board Options Exchange, Incorporated is not affiliated with this website or this website's owner's or operators. CBOE assumes no responsibility for the accuracy or completeness or any other aspect of any content posted on this website by its operator or any third party. All content on this site is provided for informational and entertainment purposes only and is not intended as advice to buy or sell any securities. Stocks are difficult to trade; options are even harder. When it comes to VIX derivatives, don't fall into the trap of thinking that just because you can ride a horse, you can ride an alligator. Please do your own homework and accept full responsibility for any investment decisions you make. No content on this site can be used for commercial purposes without the prior written permission of the author. Copyright © 2007-2023 Bill Luby. All rights reserved.
 
Web Analytics