Monday, December 31, 2007

SPX Daily Volatility Below 80 Year Average in 2007

Kudos to Bespoke Investment Group for coming up with yet another interesting graphic, which I have reproduced below.

The graphic shows that the average daily volatility of the SPX was 0.72% in 2007, higher than the low volatility years of 2004-2006, but below the 80 year average of 0.75%.

For more information, try the original Volatility? What Volatility? post at Bespoke.

Bullish TRIN as Year Winds Down

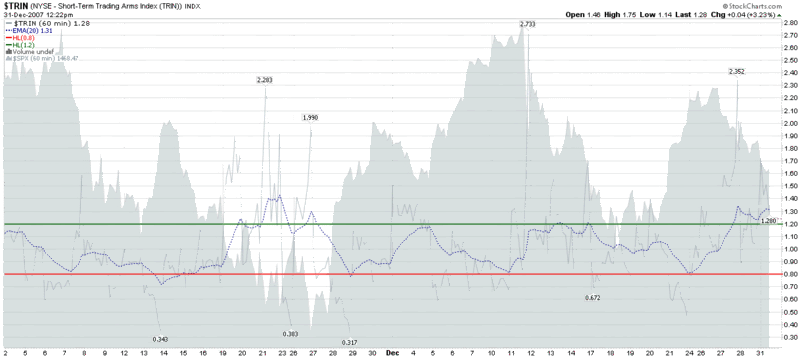
One indicator that I have yet to comment on in 2007 is the TRIN, also known as the Arms Index, after its inventor, Dick Arms.

The TRIN is calculated by first dividing the number of stocks that advanced in price by the number of stocks that declined in price to determine the Advance/Decline Ratio. Next, the volume of advancing stocks is divided by the volume of declining stocks to determine the Upside/Downside Ratio. Finally, the Advance/Decline Ratio is divided by the Upside/Downside Ratio. In mathematical terms, the TRIN looks like:

(Advancing Issues / Declining Issues)

────────────────────────────

(Advancing Volume / Declining Volume)


Like the VIX and put to call ratios, the TRIN is a contrarian sentiment indicator. Generally, a rising TRIN indicates increasing bearish sentiment and a falling TRIN reflects increasing bullish sentiment. I have included the traditional 1.2 and 0.8 thresholds as indicative of sentiment extremes. These are levels at which the probability of a market reversal increases.

Depending on their trading time frame, practitioners use different bars for the TRIN. In the chart below, I chose to use 60 minute bars over the course of a two month period to generate swing signals of the short to intermediate-term variety. For comparison purposes, day traders frequently use 5 or 10 minute bars. It is important to note that different length bars give very different signals and also usually require a rethinking of where one should place the threshold levels for market turns.

At the moment, the TRIN is generating a fairly bullish signal – certainly the most bullish signal since Thanksgiving, when the markets began a strong rally that surprised many who were not watching the TRIN closely.

I will have more on the TRIN in 2008.

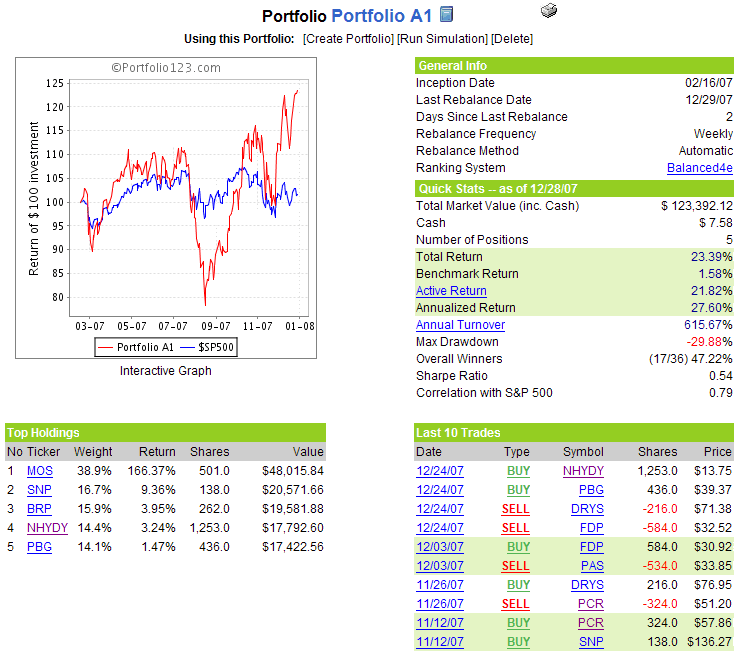
Portfolio A1 to Best SPX By 20% in 2007

On the heels of a strong fourth quarter, it looks as if Portfolio A1 will finish 2007 with at least a 20% advantage over the benchmark S&P 500 index since the portfolio’s February 16th inception. With one trading day left in the year, Portfolio A1 has a 23.4% gain, a full 21.8% better than the 1.6% gain in the SPX during this period.

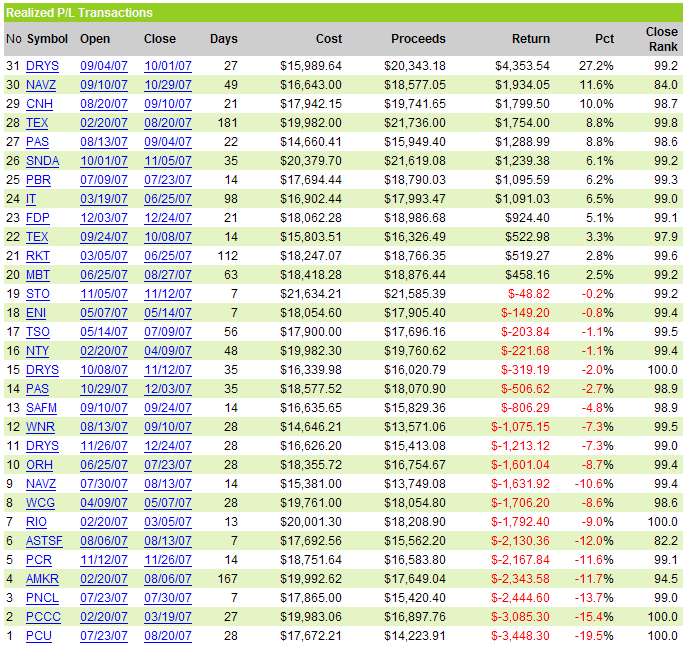
I will publish some additional statistics once 2007 is in the books, but suffice it to say with the likes of MOS, DRYS, TEX, PBR, RIO and others in the portfolio over the past 10 ½ months, we have been fishing in very rich waters.

In addition to the usual equity curve and summary information, I have added a list of positions that were closed out during the year.

There no changes to the portfolio this week.

A snapshot of the portfolio is as follows:


VWSI at Zero as Year Coasts to a Close

A year ago, the VIX stood at 11.56. Last week it ended the week at 20.74, up 79%. Of course, in the absence of a VIX ETF (or ETN), it was almost impossible for volatility aficionados to capture that 79% gain.

For the moment, at least, things seem to be quiet on the volatility front. Last week the VIX gained 2.27 points (12.3%) to bring the index to a level just 0.17 below the 10 day simple moving average and 0.93 below the 20 day SMA. Partly because of this, the VWSI is back at zero and indicating no directional bias for the beginning of 2008.

As is my weekly custom, for a survey of the best in current thinking about the markets, Barry Ritholtz at The Big Picture sums up the week that was and the week that will be in his New Year’s Linkfest.

Finally, as volatility tends to run in 2-4 year cycles, it is appropriate to ask whether the 79% gain in the VIX in 2007 marks the beginning of a new volatility macro cycle. In spite of the historical precedent, I am on the record as saying that the most likely volatility scenario for 2008 is a VIX in the low to mid-20s.

(Note that in the above temperature gauge, the "bullish" and "bearish" labels apply to the VIX, not to the broader markets, which are usually negatively correlated with the VIX.)

Wine pairing: For a VWSI of zero, I began the year recommending some Rhone blends and later expanded the category to include any expensive blend. For 2007, I will close out the year with my two favorite inexpensive blends: the $8 Oakley Five Reds (the 2003 vintage is a blend of 41% syrah, 27% zinfandel, 22% petite sirah, 10% alicante bouschet, and 1% mourvedre from Cline Cellars); and the 2005 vintage of The Hermit Crab from D’Arenberg, a delicious $13 blend of 70% viognier and 30% marsanne.

Friday, December 28, 2007

Technology, Energy and Bulls

Conventional wisdom – which usually strikes me as something like 95% convention and 5% ‘wisdom’ – holds that returns on technology stocks and energy stocks are largely a function of the business cycle. The theory is that technology stocks generally outperform in the early stages of a bull market, while energy stocks deliver their best returns at about the time that the broad markets peak

I should note that while I have chosen to focus on technology and energy for the moment, the full sector rotation/business cycle theory spans all sectors. For those interested in further reading, the CXO Advisory Group has an excellent discussion of a comprehensive business cycle approach to sector rotation (they are skeptical about trading on the theory) and a variety of sources, including Fidelity and Optionetics, have good summary articles.

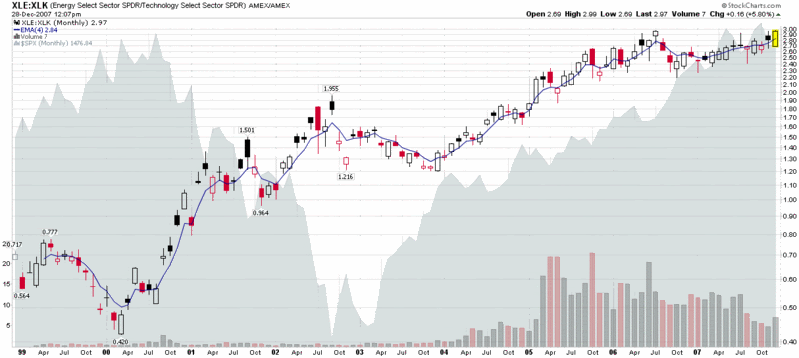
Getting back to energy and technology, I have included below a ratio chart of the AMEX Select SPDRs for the energy (XLE) and technology (XLK) sectors going back to their 1998 launch. The graph shows an almost perfect negative correlation between the ratio of energy to technology sector performance and the SPX from 1998 through the end of 2003. This time frame is reasonably representative as well, as it includes two bull periods of about 1 ½ years each, as well as a bear market of a little more than two years.

From the beginning of 2004 to the present, however, the correlation between the energy to technology ratio and the SPX flips from negative to positive, as energy starts to outperform technology at the same time the markets begin a long bull run. For the past four years, up to and including the current month, energy has generally had the upper hand or at least been the equal of the more ballyhooed technology sector.

I find it interesting that the last time the XLE:XLK ratio was this high was July 2006, when the markets were selling off over uncertainty about whether Bernanke would continue to raise the Fed discount rate. Now I won’t go as far as to say that the bull market is officially over if the XLE:XLK ratio gets over 3.0, but keep an eye on this ratio. As US consumers get accustomed to $100/barrel oil and $3.50/gallon gas, any number of things are possible, but I don’t believe the broader markets will continue to rise if energy outperforms technology going forward.

Thursday, December 27, 2007

Good Luck Getting a Mortgage Here…

I don't talk much about my trading and investing background, but suffice it to say that I have been an active investor for 25 years, have traded all sorts of options for 10 years, have accounts with about a dozen financial institutions, some of which carry what I consider to be significant balances, etc. On top of that, the options commissions alone that I generate are quite substantial.

So...just for the heck of it, I decided to open an account with Bank of America and see how well their 30 free trades a month promotion works and whether it makes sense to move a large chunk of money there and make them a part of the network of institutions with which I place most of my trades.

On their options application BofA asks the usual questions about the number of years trading options, number of trades per year, average trade size, types of trades, etc. Given the substantial history and volume I have in this area, including writing naked options on equities and indices, I was surprised that it had taken several weeks for them to add options authority to an account that I opened and funded at the beginning of the month. Finally, I get a call from them today. I returned the call and their rep proudly informed me that I have been approved for Level 3 options trading – which is their equivalent of an investor with training wheels: no authority to write uncovered puts and calls for equities, not to mention index options. I just laughed. I love thinkorswim and optionsXpress. I also think TradeKing does an excellent job with options, especially considering their pricing. No doubt those three brokers will continue to get 95+% of my options business. Fortunately, I won't have to worry about how good the options executions are at Bank of America. What a joke...

[For those who are wondering, I did not reference the blog, nor ask the person on the other end how he would go about evaluating a fair price for a VIX calendar spread when the VIX is in contango.]

Disclaimer: I have no position in BAC at the moment, but keep in mind that this is the same company that invested $2 billion in Countrywide Financial when the common stock of CFC was trading at about 26 (it is now at 9)

Other Voices on Volatility, Risk, etc.

One of the advantages of living in California is that by the time I wipe the sleep out of my eyes and stare at the computer screen for the first time each morning, bloggers from time zones to the east of me have already digested information I haven’t even seen yet and drawn their own conclusions. In many instances, this allows me to cherry pick what I think is important to ponder without having to boil the ocean along with a couple of eggs before the market opens. This particular morning, five related items are among those that are most prominent in my deliberations:

Wednesday, December 26, 2007

Portfolio Rebalancing, Diversification, and ETFs

In addition to dreaming about the great investment opportunities of 2008, the end of the year is a time when many investors think about rebalancing their portfolios, enhancing diversification, and lowering risk. It is also a good time to cut loose bad ideas and bad investments, while at the same time opening one’s mind to the possibility of new types of investments.

I can’t say where the best opportunities for 2008 lie, but I can tell you where to find them. Without a doubt, many the best investments for 2008 will found among the ETF universe. This should not come as a surprise, as the ETF universe has, by far, the broadest array of investment vehicles. So while some individual stocks may top next year’s list in terms of total return, the careful selection of a few ETFs in new asset classes will provide a better opportunity to enhance returns and lower overall portfolio risk at the same time.

While there are a number of places to research and screen ETFs, I am also a fan of those handy one page ETF ‘cheat sheets’ put out by Bespoke Investment Group: the US ETF Family Tree; and the Global ETF Family Tree, each of which are superbly organized. For my purposes, however, I can do one better with a four page PDF from ETF Guide: ETF Reference Guide 2007 Q4. Updated quarterly, this document gives me four important pieces of information that are not available from the Bespoke cheat sheets:

  1. Indication of which ETFs are optionable
  2. Average daily volume
  3. Expense ratio
  4. Expense ratio median for each category

Armed with this information, now is as good a time as any to start thinking about how to take advantage of the changing mix of investment opportunities – and the ETFs that can expand the scope of your investment reach.

Monday, December 24, 2007

Was 2007 the Beginning of a New Era in Volatility?

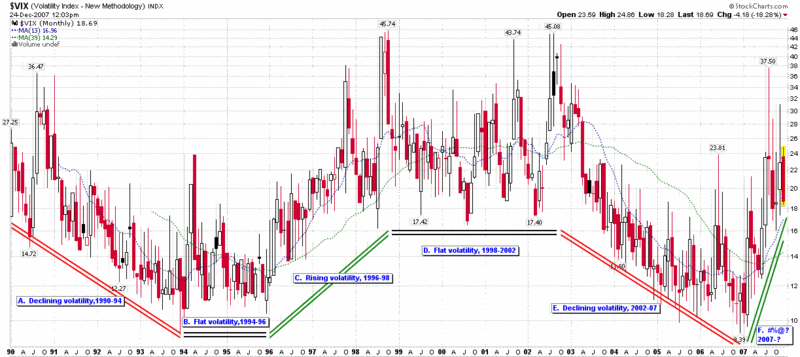
From the chart below, it certainly looks as if 2007 was the beginning of a new volatility macro cycle. It also looks as if the rate of change in volatility over the course of 2007 is unsustainable going forward – or at least inconsistent with the slope of volatility macro cycles during previous cycles. I am not going to make a specific long-term volatility forecast for 2008, but it would not surprise me if volatility flattened out in the low to mid-20s range in much the same manner that it did from late 1998 to early 2002.

While VIX macro cycles are somewhat dependent upon a subjective determination about the beginning and ending dates for each cycle, it should be noted that these cycles tend to last a minimum of two years, suggesting that the current rise in volatility should persist through all of 2008, even if the rate of rise in volatility begins to slow.

The evolution of the current macro cycle will undoubtedly be a big story to watch in 2008; VIX and More has a front row seat to watch the action and provide the play-by-play and color commentary as appropriate.

Portfolio A1 Reshuffles Holdings for Holidays

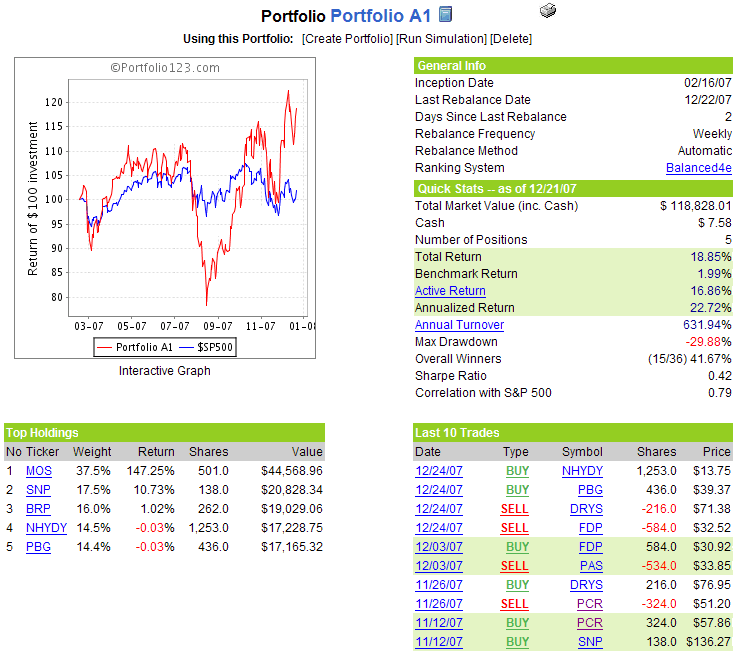
Portfolio A1 continued its strong performance last week, with cumulative gains of 18.9% since the portfolio’s February 16th inception – 16.9% better than the 2.0% return of the benchmark S&P 500 index during this period.

Notwithstanding the excellent recent run, this high turnover portfolio continues to seek out better opportunities and therefore dropped DryShips (DRYS) and Fresh Del Monte Produce (FDP), replacing them with Norwegian energy and aluminum giant Norsk Hydro (NHYDY), as well as The Pepsi Bottling Group (PBG), a Pepsi subsidiary. I find the Pepsi move a little surprising, especially since the portfolio had already experimented with PepsiAmericas (PAS) in November. How can a computer program have an affinity for a particular brand…?

There are no additional changes to the portfolio this week.

A snapshot of the portfolio is as follows:

VIX Shrinkage Continues; VWSI at +6

During the week, I chronicled The Incredible Shrinking VIX, which addressed the issue of volatility falling in a market that was going mostly sideways to down. By the end of the week, the VIX was down 4.80 points or 20.6% from the previous week, to 18.47 – a level not seen since the beginning of November.

The interesting part of the week is that the SPX had a modest gain of 16.51 (1.1%), so that very little of the move in the VIX (perhaps 1.25 of those 4.80 points) can be attributed to a rise in the SPX. The rest? Some of it certainly comes from a seasonal pattern of historically low volatility around the holidays (see the CXO Advisory Group on U.S. Stock Returns Around the Year-End Holidays), but a considerable account is still unaccounted for. It looks like it may take the unfolding of events in 2008 to explain the shrinking VIX anomaly.

On the VWSI front, the shrinking VIX contributed to a new elevated VWSI reading of +6, suggesting that the VIX should be close to bottoming. Ironically, the VIX is up this morning, and so are the markets…

As is my weekly custom, for a survey of the best in current thinking about the markets, Barry Ritholtz at The Big Picture sums up the week that was and the week that will be in his Christmas Linkfest.

Finally, good news for those who are content to sit on the sidelines and wait for a more compelling market signal before committing to a specific direction, PowerShares is launching three new Buy-Write ETFs:

  • PowerShares DJIA BuyWrite Portfolio (PGB)
  • PowerShares S&P 500 BuyWrite Portfolio (PBP)
  • PowerShares NASDAQ-100 BuyWrite Portfolio (PWBW)
These join old standbys MCN, BEP and BWV in the buy-write stable.

(Note that in the above temperature gauge, the "bullish" and "bearish" labels apply to the VIX, not to the broader markets, which are usually negatively correlated with the VIX.)

Wine pairing: For a VWSI of +6 I favor a semillon. This often overlooked varietal tag teams with sauvignon blanc to form the white wines of Bordeaux, otherwise known as Graves. The thin skinned semillon grape is particularly susceptible to the Botrytis fungus, which means that semillon is also the primary grape used in the classic dessert wine known as Sauternes.

In the New World, semillon has gained a strong foothold in Australia, where it is frequently blended with chardonnay and sauvignon blanc, but also sold on its own. Last I checked, Peter Lehmann Wines produces four different semillons, with the Barossa Valley one of the most widely distributed in the US. Skipping a little to the east, just this evening I had an excellent 2002 Alpha Domus semillon from New Zealand, but the Kiwis have yet to show the same enthusiasm for semillon that they have for sauvignon blanc. Still, the Alpha Domus effort proves that the potential is there.

It is harder to pick a particular US producer that has built a reputation for semillon, but one to keep an eye on is L'Ecole Nº 41, from the Walla Walla, Washington area. This is, by a considerable margin, my favorite non-French semillion tasted in the past 25 years, a mineraly stunner that may have you rethinking how often you should be drinking this varietal.

For more information on semillon, StarChefs.com has a good discussion of the varietal, along with a handful of recommended producers in Australia and South Africa.

Friday, December 21, 2007

How Timely Is Your News?

CurrencyTrading.net, whose last blog list included VIX and More as one of their Top 100 Day Trading Blogs, is out with a new list of note: 50 Places to Discover News Before It Goes Mainstream, authored by Heather Johnson. It is a list well worth checking out, regardless of whether or not you follow the currency markets.

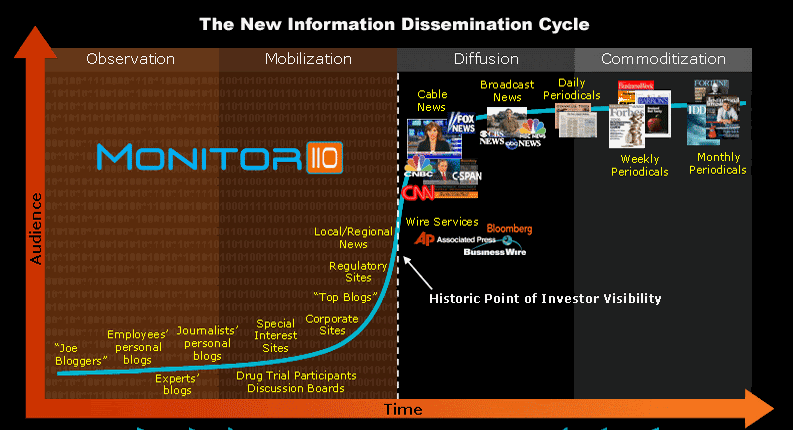
On the same subject, when you think of the information lifecycle in terms of the graphic below from Monitor110, consider how important it is for your news sources to include blogs that give you new ideas to think about, long before they find their way into the mainstream media. That is part of the reason why I have a “Blogs I Frequent” list on the right hand column of the blog. If you haven’t checked that list lately, now might be a good time to revisit it, as in the past month or two I have added several excellent blogs featuring cutting bleeding edge thinking.

The Incredible Shrinking VIX

Santa Claus didn’t quite deliver the expected rally this year, but at least we got the incredible shrinking VIX. I have talked about the absence of fear on several occasions, most recently on Wednesday, but the sinkhole in investor fear has continued to expand since then. Today’s fall in the VIX all the way down to 18.65 means the lowest low water mark since the first day in November, when the VIX traded in the low 17s.
I believe Rob Hanna of The Money Blogs was the first to comment on the unusual phenomenon of the VIX following the markets down. While Rob was cautious about the negative implications of this phenomenon on the broader markets, Brett Steenbarger at TraderFeed was more open about the likelihood of an impending period of ‘subnormal short-term returns’ indicated by his research in Stocks Down, Option Volatility (VIX) Down: What Happens Next.

Adam Warner of Daily Options Report has required a little more confirmation to believe that the drop in volatility is something more than the vagaries of the holiday trading calendar, but in Volatility Dippage, it seems he has finally come around to the point of view that the VIX drop is real and not a calendar-driven oasis.

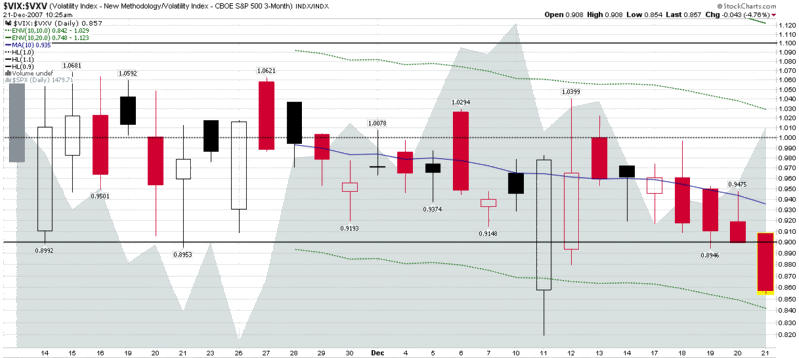
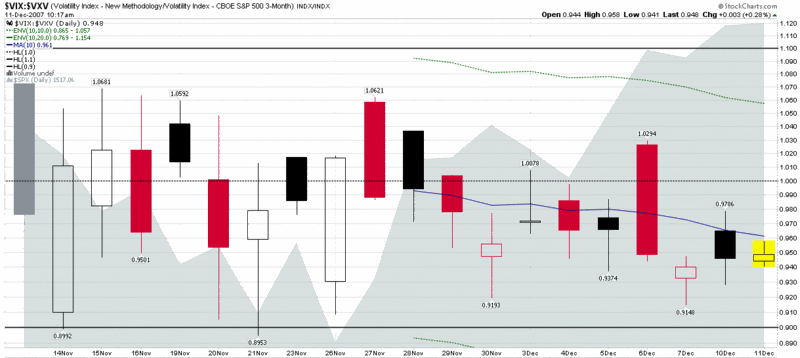
I agree that the drop in the VIX is real, but not to the extent that the VIX suggests. Here is a perfect opportunity to use the VXV, which measures volaltility 93 days out instead of the VIX's 30 day window. Per the VIX-VXV ratio chart below, the expectations of volatility over the next 30 days (VIX) are dropping much faster than those over the next 93 days (VXV). Further, if you look at the VIX futures quotes, you can see that future volatility expectations are pretty much flatlined out through the November 2008 contract, with the VIX contract prices all currently hovering in the 23 range. The bottom line: fear may be slipping a little, but it is not in a free fall, as the VIX might lead some of us to believe.

I will close with a link to a post from May in which the title tells the story: High Positive Correlation Between VIX and SPX Often Signals Market Weakness.

Thursday, December 20, 2007

Gap City: LDK

I’m reasonably sure that whatever I write here will be obsolete in the ten minutes that it takes me to post it, but I feel compelled to comment about LDK Solar (LDK) anyway.
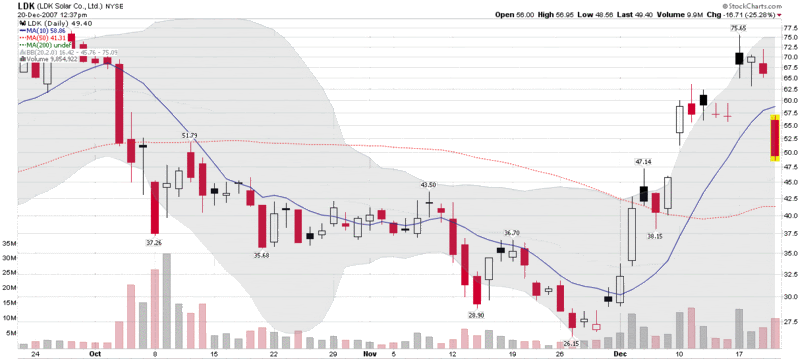
For those who do not follow LDK, this is the Chinese solar company that was the subject of accounting fraud allegations by a former controller that helped to knock the stock down from the mid-70s to the mid-20s over the course of a month or so. On Monday, LDK reported that the Audit Committee of the Board of Directors had finished their review of the matter and concluded that there had been no wrongdoing. Things were looking up until LDK reported quarterly results after the close yesterday. The numbers were generally in line, but concerns about margins and the absence of raised guidance has put pressure on this stock this morning, which traded down as much as 27% earlier in the session.

While the story is interesting, the chart may raise even more eyebrows, as it is littered with gaps and the tombstones of overzealous traders. If you are thinking about playing solar roulette, consider that directional plays are extremely dangerous. One way to make to potentially make some money off of the faddish momentum and wild gyrations is to sell volatility below support and above resistance, so you can get paid while you watch the fun. Even if you don’t play this stock, the entertainment value alone makes it worth keeping an eye on.

On a related note, is it only me, or does anyone else who trades Chinese solar counterpart JA Solar Holdings (JASO) think of a hockey mask every time they look at the ticker? Given the volatility in that stock, somehow it seems an appropriate image…

Finally, anyone interested in rolling the dice in the solar sector, Chinese and otherwise, should start their research with the excellent solar stock comparison table at China Analyst.

Wednesday, December 19, 2007

No Fear?

We may be stuck in a holiday time warp, but I find the lack of fear in the VIX to be more than a little surprising, particularly given the spate of gloomy headlines. I talked about this same subject three weeks ago, but the gulf between the VIX action and the news flow has grown wider and wider ever since. Is it possible that this kid has already grown up enough to get a hedge fund job?
The ISEE (below the long-term mean for the 30th day in a row) and the CBOE equity put to call ratio (spiking once again) both indicate that call buying relative to put buying is considerably below historical norms, which makes the VIX numbers even more surprising.

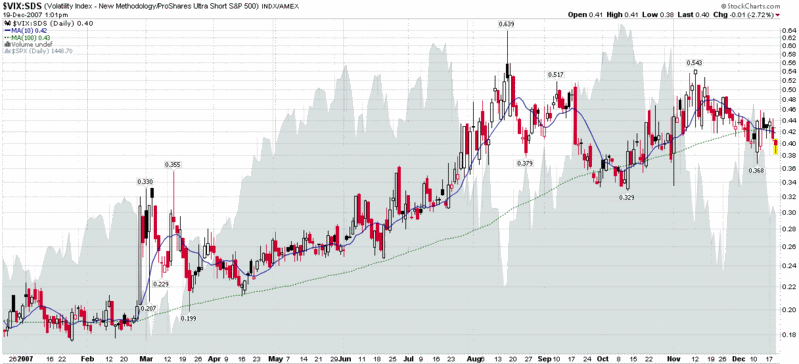
In times like this I turn to the VIX:SDS ratio. As shown below, my proxy for the fear premium component of the VIX is now showing a reading that is substantially below the 10 and 100 day simple moving averages. Is this merely a case of desensitization or is something else going on?

Tuesday, December 18, 2007

Volatility as an Asset Class I

I am beginning to believe that to some extent, this blog may be carrying the seeds of its own destruction. Specifically, the worst thing about trading and blogging about volatility is that when stuff hits the fan, the best trading and blogging setups both spike at the same time. So…if sometimes it seems to take longer for me to comment on various market action and volatility-related topics just when these topics seem juiciest of all, well it is probably a case of my trading taking precedence over my blogging.
On that note, let me open a new can of worms that I will come back to regularly and in more detail: volatility as an asset class.

There has been considerable discussion in the past few days about whether or not volatility should be considered an asset class, much of it spurred by a Barron’s article over the weekend authored by Steven Sears and bearing the title Volatility: Finally Getting Respect.

The subject of volatility as an asset class is a fairly complex one and for now I have just enough time and space here to introduce it, provide some links, and promise to be back with some analysis and opinions soon.

Before getting in to volatility, there is another perhaps larger can of worms regarding what exactly an asset class is. I am going to pass on this issue for now, other than to say that I think the Wikipedia asset class examples are an excellent way to think about the subject.

Getting back to volatility as an asset class, this subject has been discussed in some circles for at least the past five years, but the idea has received increasing media attention in the last year or two. The Financial Times was talking about Why Volatility Becomes an Asset Class in May 2006, while Hafner and Wallmeyer published an academic paper Volatility as an Asset Class: European Evidence last year that had been widely distributed in previous incarnations in 2005. Three months ago, a book edited by Izzy Nelken of Super Computer Consulting was published with the title Volatility as an Asset Class. For those who are interested, the book is available through Amazon. To get a sense of how far along this idea has progressed, Euromoney Training was recently offering a training program on the subject of volatility as an asset class.

To complete the laundry list of links, here are four excellent posts triggered by the Steven Sears article from some of my favorite bloggers on the subject of volatility as an asset class:

More to follow on this subject, as soon as that pesky market volatility takes a bit of a breather…

Monday, December 17, 2007

OHFdex Getting Killed

This is how the Overripe High Fliers index (OHFdex) looked just after 3:00 p.m. ET:

Portfolio A1 Continues Strong Finish to Year

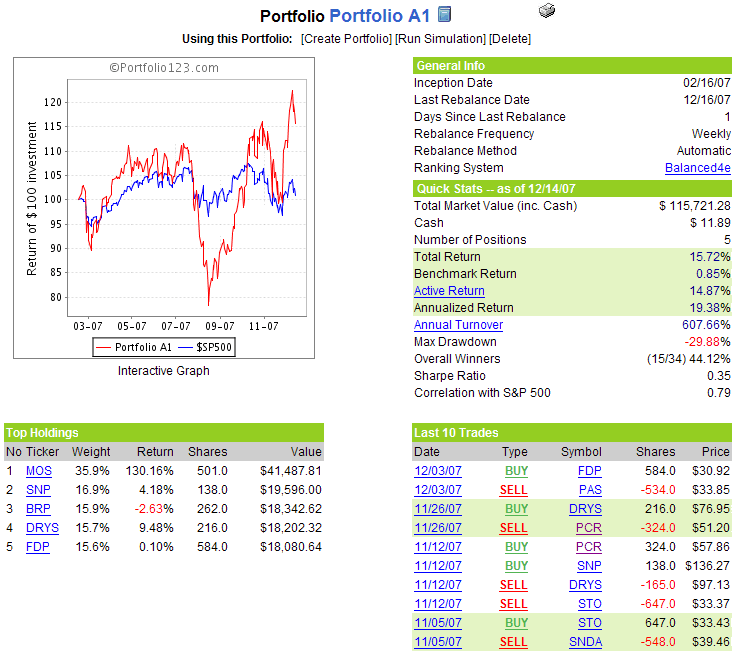
Portfolio A1 held on to most of its gains this past week and now stands up 15.7% since the portfolio’s February 16th inception – a full 14.9% better than the 0.85% return of the benchmark S&P 500 index during this period.

While some portfolio managers may be content to dial down their aggressiveness and coast in to the end of the year with an index-beating performance all but locked up, this automated portfolio has no such feature. Instead, it will continue to try to squeeze out additional percentage points during the final two weeks of the year. Given the current state of the markets, this could be riskier than most years, but this approach also happens to reflect my personal philosophy that it is generally best to press one’s advantage when things are going well.

No matter how the chips fall, it should be an interesting last two weeks.

There are no changes to the portfolio this week.

A snapshot of the portfolio is as follows:

Lethargic Pre-Christmas VIX Has VWSI at Zero

While last week felt to most investors like a turbulent week in the markets, it must have also been a week in which the VIX was not listening to the gloom and doom reports. While the SPX fell 36.71 (2.4%) on the week, the VIX rose 2.42 points or 11.6%. Historically, when the SPX falls 2.4%, the VIX jumps about 11.4%, so last week was a typical reaction in the volatility markets, with no apparent extra fear factor in the mix. Keep in mind, however, that Adam Warner of the Daily Options Report is maintaining that the VIX is artificially low at the moment because of some idiosyncrasies in the holiday trading calendar.

So here we are, tottering on the precipice of a bear market, but with a relatively mild fear component. My bias has turned bearish, but until we start to see a pattern of lower lows, I will probably play this as more of a sideways market than a downward sloping one.

As is my new weekly custom, for a survey of the best in current thinking about the markets, Barry Ritholtz at The Big Picture sums up the week that was and the week that will be: Winter Solstice Linkfest Review/Review

I suspect that in the coming week and into the new year, headline risk will be one of the largest drivers of investment strategy. Whether you are positioning your portfolios for a potential last minute Santa Claus rally, for the January effect, or for any other strategy, consider some of the headlines you may be seeing in the next few weeks and keep in mind that one of the most important tenets of risk management is to limit potential losses.

(Note that in the above temperature gauge, the "bullish" and "bearish" labels apply to the VIX, not to the broader markets, which are usually negatively correlated with the VIX.)

Wine pairing: For a VWSI of zero, I have heretofore been recommending a variety of inexpensive blends. I recently enjoyed the 2005 Trentadue Old Patch Red, a steal at $12. Previous recommendations for a VWSI of zero have included Brassfield Serenity, as well as a wide variety of Rhone blends.

Friday, December 14, 2007

Neighborhood Home Values Holding Up Nicely

A month ago, in The Other Bubble, I mentioned that I live in Marin County, just north of San Francisco and commented on the surprising strength of the local real estate market. Well, things appear to be better than I thought.

Amidst all the talk of the subprime meltdown and impending financial calamities, I found it interesting that not too far from where I live, a house has apparently just gone into contract for $65 million – the full asking price. The Wall Street Journal broke the story this morning, but an old Forbes profile of The Most Expensive House in California is a better stop to read more about Locksley Hall, currently owned by Robert “Toxic Bob” Friedland, a global mining tycoon who earned his nickname by helping to turn Summitville Mine into one of the most notorious Superfund sites.

While I mentioned on Wednesday that I have had a good run with my trading lately, I hasten to add that I am not the buyer. So far, the buyer's name has not been disclosed. One locally famous name worth noting, however, is Olivia Hsu Decker, who handled the listing and whose web site makes for interesting browsing if you are into house envy.

Friedland has renovated the original house extensively and various sources list the current square footage at 10,000 or 12,000. I must say, however, that $6,000 per square foot is not outrageous for the area, especially considering that the views from the site are generally considered to be in the top five in the world.

If nothing else, this transaction will make for some interesting average home sale price statistics in the area. Perhaps some day I can try to sneak it in as a comp...

Thursday, December 13, 2007

Implied Volatility as a Sector Drill Down Diagnostic

I have said relatively little about the crisis in the financial sector largely because there are so many others out there who are covering this story in much more detail than I have any desire to get into. Also, my trading is driven largely by technical analysis, charts and market sentiment, with fundamental analysis usually playing a prominent role only in my long-term holdings.

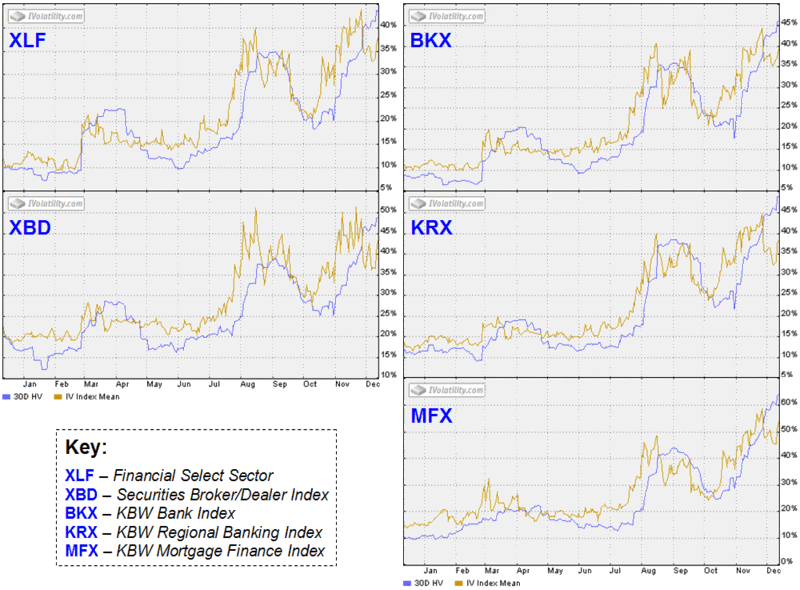
That being said, this blog has an emphasis on volatility and risk, so this morning I pulled up some implied volatility charts in the financial sector and drilled down from general to specific to see to what extent implied volatility might indicate vis-à-vis the possibility of the tide turning in investor fear. I have appended several of these charts below. On the left hand side, they include the generic large cap financial sector index, XLF (components), as well as the securities broker dealer index, XBD, whose volatility I analyzed back in August. On the right side, I have the banks. The BKX (components) is capitization-weighted and thus tilts toward money center banks; the KRX (components) has a strong regional and local focus; and the MFX (components), as the name suggests, includes banks and other financial companies that are heavily involved in the mortgage finance business. For comparison purposes, the BKX is down 18.7% on the year, the KRX is down 20.5% and the MFX is off 44.6%.

From an IV perspective (and yes, many of these companies could use some intravenous fluids) I generally glance at XLF only as a generic overview of the financial sector. The first finding of interest is that implied volatility in the XBD peaked in August and made a double top before Thanksgiving. This is consistent with the widespread belief that Goldman Sachs (GS) has dodged the subprime bullet and other players in this sector have had sufficient time and corporate agility – if not perhaps the ideal risk management policies – to limit any additional damage.

The banks are another story. Implied volatility in the money center banks and regional banks topped out at the end of November and is currently just below the August highs. Still more concerning, if not more surprising, is the performance of the mortgage finance sector, where implied volatility is above the August peak and in the process of challenging the late November high water mark. If I were a meteorologist looking at implied volatility, I would conclude that the storm has passed in the broker-dealer sector, but more thunderclouds are approaching in the regional banking and mortgage finance sectors.

Wednesday, December 12, 2007

Carrot Day

It has been a crazy few weeks of trading – and one of my most profitable stretches in at least a year – so I recently decided to reward myself with a couple of early holiday presents, as I am a firm believer that the lone wolf trader needs more carrots than sticks in order to achieve superior performance.
So today I am playing with my new Microsoft Zune 80GB (the first piece of Microsoft hardware I have ever purchased), waiting for AMC to unbox yet another laptop (I’m up to about two dozen since my Toshiba T1000), the HP dv2500t broadband wireless variant, and have already had a chance to thumb through Richard Bookstaber’s A Demon of Our Own Design. I’ll have to finish Alan Greenspan’s The Age of Turbulence before I get to Bookstaber, but Bookstaber certainly passes the ‘first paragraph test’ with flying colors:

“While it is not strictly true that I caused the two great financial crises of the late twentieth century – the 1987 stock market crash and the Long-Term Capital Management (LTCM) hedge fund debacle 11 years later – let’s just say I was in the vicinity. If Wall Street is the economy’s powerhouse, I was definitely one of the guys fiddling with the controls. My actions seemed insignificant at the time and certainly the consequences were unintended. You don’t deliberately obliterate hundreds of billions of dollars of investor money. And that is at the heart of this book – it is going to happen again. The financial markets that we have constructed are now so complex, and the speed of transactions so fast, that apparently isolated actions and even minor events can have catastrophic consequences.”

I’m still trading, but today is one of those days where I am mostly selling additional premium and watching time decay while I fiddle with my new toys. We all need carrot days, so be sure to take them when you earn them.

Tuesday, December 11, 2007

The VIX:VXV Ratio

Yesterday I talked a little bit about what the CBOE has said about the VXV. Even though it is still early days, today I thought I would offer up a simple framework that might be useful for using the VXV as a timing tool.

The chart below covers the first month of data from the VXV and calculates a ratio of the VIX to the VXV (the CBOE chart from yesterday chose to use the ratio of the VXV to the VIX, but I generally prefer to have the more volatile number in the numerator and the less volatile one in the denominator.)

I expect that the VIX to VXV ratio will make it easy to determine the extent to which the implied volatility on SPX options suggests investors expect volatility to rise or fall in the 30 day (VIX) to 93 day (VXV) time period. In addition to the 10 day simple moving average and 10% and 20% moving average envelopes, I have included three horizontal lines in the chart below. The dotted black line is set to 1.00 and indicates no expectations for a change in volatility over the 30 to 93 day time frame. The two solid black horizontal lines are set to 0.90 and 1.10 and are intended to be easy visual references to indicate when volatility is anticipated to change by at least 10% in that 30 to 93 day window.

The 10% level is somewhat arbitrary and largely dependent upon a desired signal to noise ratio, but it is supported by the CBOE data I highlighted yesterday and is consistent with much of my other research on the VIX. Just as is the case with VIX futures, I expect the VIX to have a tendency to fall and the markets to rise when the VIX:VXN ratio is above 1.10; and will look for the VIX to rise and the markets fall when the ratio is below 0.90, in classic mean reversion fashion.

Monday, December 10, 2007

Thinking About the VXV

I have recently received a couple of inquiries about the new VXV, which I first mentioned just after the CBOE launched the product in mid-November.

In short, whereas the VIX measures the implied volatility of SPX options 30 days out, the VXV measures IV for options 3 months (93 days) out. For those who want to get into the details of the VXV, the best source is a 6 page “Index Description” PDF published by the CBOE. In this paper, I found the following comments to be of particular interest:

“VXV has tended to be less volatile than 1-month VIX. Since January 2002, the volatility of VXV daily returns has been 58.4% compared to 90.1% for VIX. The correlation between VXV and 1-month VIX during that time was 0.92, indicating a strong tendency to move together, but far from moving in lockstep.

Using VXV and VIX together provides useful insight into the term structure of SPX option implied volatility. The following chart shows VXV price movement along with a measure of the difference between the 3-month VXV and 1-month VIX. Since January 2002, VXV has been higher than VIX – reflecting an upward sloping term structure – 79% of the time. However, 21% of the time, especially when volatility spikes, VIX is greater than VXV – reflecting a downward sloping term structure.”

Even better, the CBOE lays out what dedicated VIX and More readers could probably already have guessed:

“The behavior of VXV relative to VIX illustrates the mean-reverting properties of volatility and suggests that the slope of the 1- to 3-month SPX implied volatility term structure could be used to predict future levels of near-term (1-month) implied volatility...

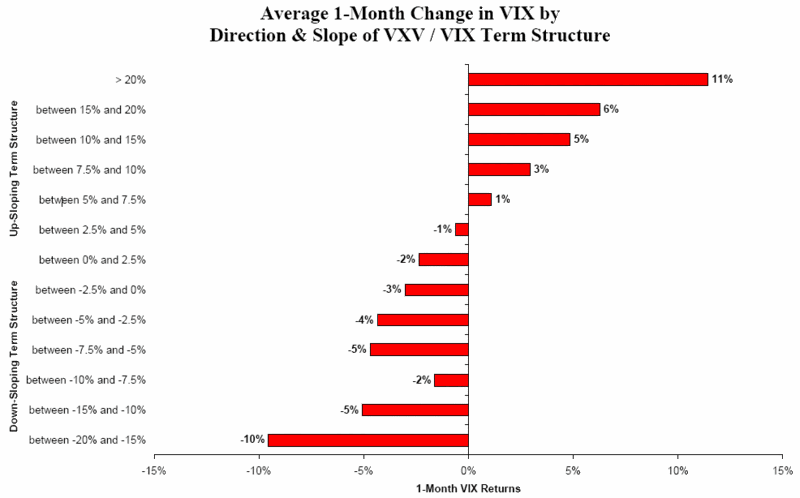
When the VXV / VIX term structure was sharply upward sloping; that is, 3-month VXV was higher than 1-month VIX by more than 10%, the average closing VIX level over the following 20 trading days was, on average, higher by at least 5%. Moreover, this effect became more pronounced as the slope of the term structure steepened. Conversely, when the slope of the VXV / VIX term structure was relatively flat (less than 5%) or downward sloping (VXV lower than VIX), VIX levels over the next month tended to be lower, on average.”

All this can be neatly summarized in a CBOE graphic:


Now that we are coming up in one month of VXV data, I will start talking about this most interesting index on a regular basis.

Portfolio A1 Finishing Year With Big Gains

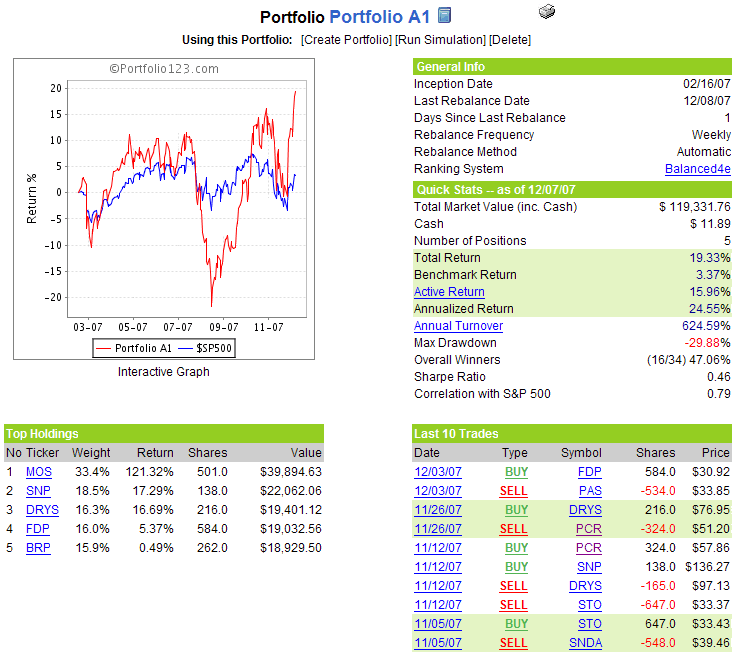
What was largely an up and down year for Portfolio A1 through Thanksgiving has suddenly turned out to be a very successful one, thanks to what is shaping up as a very strong finish. Essentially even on the year at Thanksgiving, Portfolio A1 is now up 19.3% just two weeks later, putting a lot of space between the portfolio and the benchmark S&P 500 index, which is now showing a 3.4% gain since the portfolio’s February 16th inception.

While a bullish run in Sinopec (SNP) and a resurgent DryShips (DRYS) have helped, the 121% gain in Mosaic (MOS), added to the portfolio in mid-August, is the primary reason that the portfolio has made such impressive recent gains.

Given that the portfolio is putting up such superb numbers, I am inclined to reverse my previous thinking and continue to highlight it here past the end of the year, rather than start a new portfolio from scratch.

There are no changes to the portfolio this week.

A snapshot of the portfolio is as follows:

VWSI Holds at +3 Pre-FOMC

Last week the VIX fell 2.06 (9%) points to 20.85 after briefly trading below 20 for the first time since November 1st.

Volatility has a tendency to spike up dramatically, but rarely does it decline in the same dramatic fashion. In fact, the successive weekly drops in the VIX 11.7% and 9.0% marks only the third instance since the March 2000 market top that the VIX has fallen at least 9% for two consecutive weeks. For mean reversion aficionados, the last four times the VIX has fallen at 9% or more two weeks in a row, in the subsequent week the VIX has changed +40%, +6%, +19%, and -3%.

While my portfolio is leaning in the bullish direction at the moment, the VWSI is holding steady at +3, a marginally bearish signal for the overall markets.

For a survey of the best in current thinking about the markets, Barry Ritholtz at The Big Picture sums up the week that was and the week that will be:

While I wait for the Fed to make a decision on rates, I am in the process of reading Alan Greenspan’s The Age of Turbulence – an excellent read so far. One of the recurring themes in the book is how the resilience of the economy always seems to exceed his expectations. For more on the Fed, try my Fed Links.

(Note that in the above temperature gauge, the "bullish" and "bearish" labels apply to the VIX, not to the broader markets, which are usually negatively correlated with the VIX.)

Wine pairing: For previous VWSI readings of +3, I highlighted sauvignon blancs from Cloudy Bay and the Marlborough region of New Zealand, as well as some excellent California producers whose sauvignon blanc can be had locally for $10 or less: Bogle; Chateau St. Jean (where it goes under the fumé blanc moniker); Concannon; Kenwood; and Sterling. More recently, I was impressed by a complex sauvignon blanc, with a little bit of oak, from Gary Farrell Vineyards. Their 2005 effort can be had for about $25; for my money, it knocks the socks off almost all of the chardonnays in that price range.

Finally, for an entertaining (think the mannerisms of Joe Pesci and Woody Allen blended with the enthusiasm of Jim Cramer) and informative look at sauvignon blanc, I encourage the reader to sample Gary Vaynerchuk's "Sauvignon Blanc Taste-Off" on wine library tv.

Friday, December 7, 2007

Marc Allaire on VIX Options

I was only half kidding when I noted in the VIX and More disclaimer “Anyone wishing to trade VIX derivatives should have their head examined.” If you pick your spots, there are some great VIX setups out there, some of which Brian Overby recently highlighted and I summarized for the blog. VIX options can also provide relatively inexpensive portfolio insurance. The problem is that VIX options have many idiosyncrasies that make them much different from what even an experienced options trader might expect to encounter.

Today I see that Futures & Options Trader has included an article by Marc Allaire (author of The Options Strategist) on the subject of VIX Options on pages 16-19 of the current (December 2007) issue. Allaire is given enough space to get under the hood and offer up a fairly detailed treatment of VIX options. For those looking for a beginning to intermediate treatment of the subject, this is a good place to start. Fortunately, Futures & Options Trader is available free of charge in digital form. If you follow the link above, the logistics are self-explanatory. Note that these are the same people who also put out Active Trader Magazine.

Finally, if you are interested in an excellent free publication dedicated to VIX futures, I highly recommend the CBOE’s own Futures in Volatility monthly ezine.

Thursday, December 6, 2007

A Year of the VIX

It was one year ago today that I decided to download the VIX historical data from the CBOE, dump it into Excel, do some quick and dirty analysis, then make some sort of determination about whether I should expend any additional time and energy studying market volatility.

One year later I am pleased to have taken that initial step, made a decision to expand the scope of my research, and little by little begun to incorporate some new ideas into my trading. Along the way, of course, a blog was born to collect and archive my semi-random thought tangents. After the first of the year, I will sit down at the keyboard and see what I can do in terms of distilling some of my thinking that is appropriate for publication and putting it here in blog-sized pieces, perhaps even in a more orderly fashion than the blog has evolved. Maybe I’ll begin with something like “VIX 101: An Introduction” or “A Dozen Things Everyone Should Know About the VIX” and go from there. Comments and suggestions, as always, are welcome.

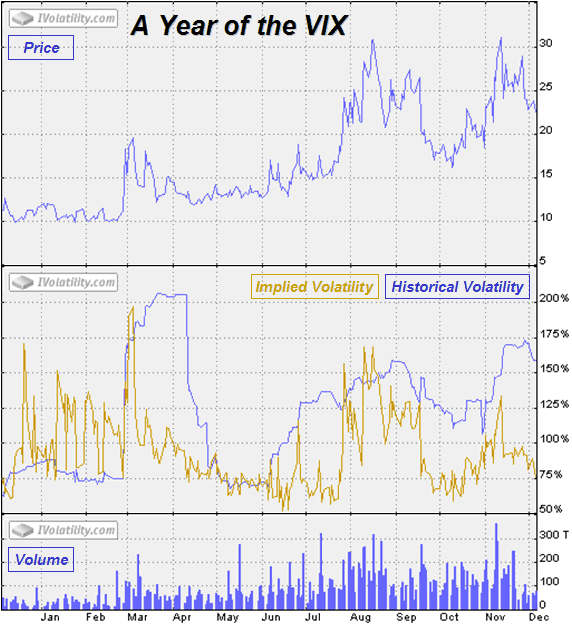
In the meantime, I thought it might be interesting to assemble in one graphic the three charts iVolatility has for the VIX. These are the one year charts of the VIX price, the implied and historical volatility of VIX options (meta volatility), as well as the VIX options volume. I find it interesting to observe, among other things, the relationship between the VIX, VIX IV and VIX options volume.

Wednesday, December 5, 2007

Inverted VIX Still Bullish

The inverted VIX was such a big hit in its debut that I thought I maybe we should cut one more album, then go on tour, perhaps somewhere that we can get paid in euros…

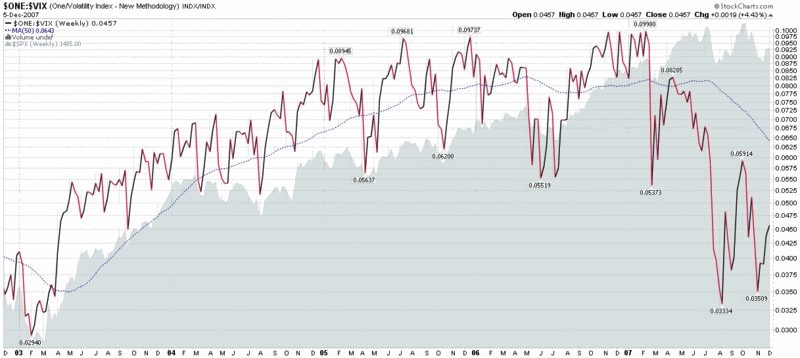
For those that haven’t bothered to click through one of the links above, the inverted VIX chart below is generated by calculating the inverse of the VIX (1/VIX in mathematical terms) so that it can be plotted in such a manner that VIX tops tend to coincide with market tops and VIX bottoms with market bottoms. For fun, I have added a 50 week SMA to the weekly chart of the inverted VIX, along with an area chart of the SPX.

The result, particularly when looking at the current value of the inverted VIX relative to the 50 week SMA, suggests a market that has just begun to rebound and still has a long way to go before it starts to get overbought.

To be fair, if this turns out to be the beginning of a bear market, neither the VIX nor the inverted VIX is likely to be a particularly helpful intermediate or long-term timing tool, as a graph of the inverse VIX during the 2000-2003 bear market demonstrates. Until we start making lower highs and lower lows in the broader indices, however, the VIX will continue to be a helpful tool for determining when to buy on the dips.

Tuesday, December 4, 2007

Thinking Sideways But Volatile? Consider MCN…

Until further notice, I am going to consider this a sideways market instead of trying to guess whether the next big move will be up or down.
In terms of trading implications, this means selling volatility in the form of bear spreads, iron condors, iron butterflies, short strangles, short straddles, selling an occasional naked call, and even that old standby, covered calls.

If you are not a regular options seller, many of these strategies can seem daunting, risky, expensive, and a lot of work. While this can be the case, there is an easy way: a covered call fund or ETF. I have prominently mentioned BEP here in the past. BEP, also known as the S&P 500 Covered Call Fund, is a closed-end fund that does exactly what the fund’s name says. I am increasingly becoming more of a fan of another closed-end fund that is very similar: the Madison/Claymore Covered Call and Equity Strategy Fund (MCN). This fund trades a little more actively than BEP, appears to be a little more flexible in its investment approach than BEP, and carries a current dividend yield of 11.5%.

In a sideways market where investors fear a lot of volatility, I’ll take 11.5% and a chance to participate in an up move any day…

Monday, December 3, 2007

Christmas Shopping Strength: Luxury Purveyors vs. Discounters

Early data from the Christmas shopping season suggests that the consumer is more willing to spend than most pundits had anticipated.

In the deluge of December data to come, there will be answers to questions about how much consumers are spending, where they are buying, how important discounts are to their buying decisions, how much credit they are using, etc.

From a stock picking perspective, however, I am most interested in how upscale the purchases will be. Is this going to be a Tiffany’s (TIF) and Nordstrom (JWN) Christmas or will it be Zales (ZFC) and K-Mart (SHLD) under the tree? There are a number of ways to look at the high end vs. discounter equation, but I am going to offer up one that may simplify things a little.

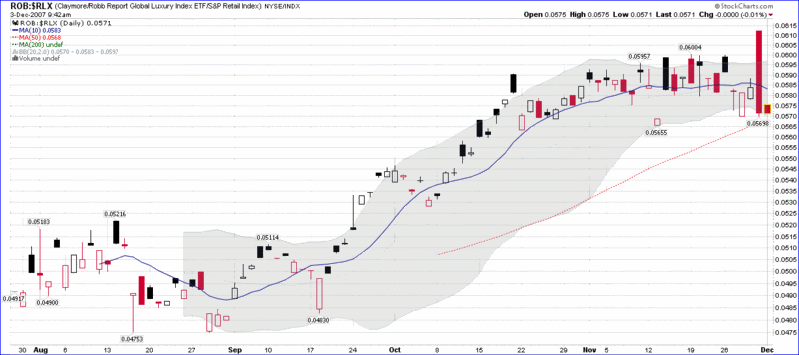
Four months ago Claymore Advisors launched the Claymore/Robb Report Global Luxury Index ETF (ROB), with a list of holdings appropriate for those who own property on at least three continents. For the normal consumer, the S&P Retail Index has a much broader list of holdings that is more representative of where middle America shops. Combine the two and get one of those StockCharts.com ratio charts like the one below, which shows that for the past three months at least, luxury goods have held up nicely while the stocks of mainstream retailers have struggled in comparison. For the next three weeks in particular, this chart (or the free version) can serve as be a handy guide to determining which tier of retailer – and consumer – is suffering the most.

Portfolio A1 Moves Up Smartly

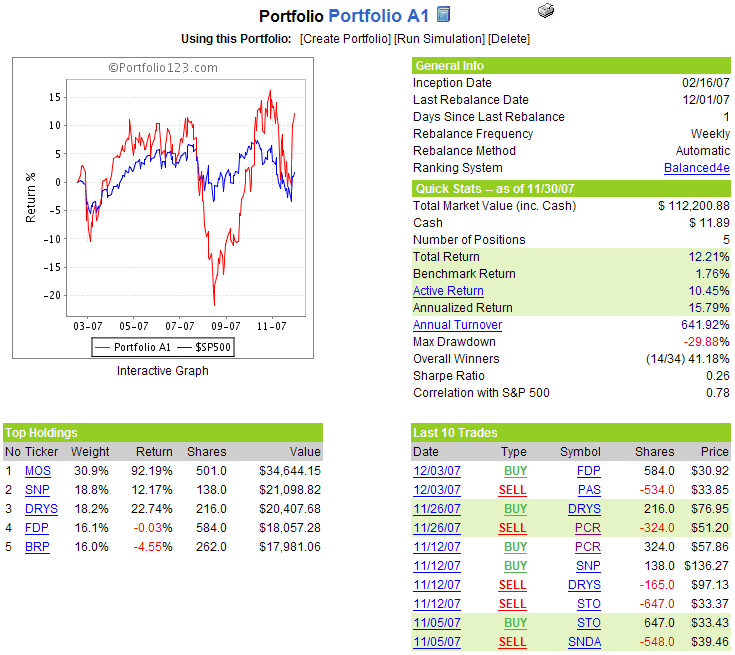
It was a very good week for Portfolio A1 – and an excellent week for the portfolio’s top three holdings. With Mosaic (MOS) gaining 13.4%, Sinopec (SNP) up 13.7%. and DryShips (DRYS) surging 22.8%, it is not surprising that the full portfolio tacked on 10.6% in a remarkable week.

With less than a month to go in the trading year, Portfolio A1’s cumulative 12.2% gain is 10.4% better than the meager 1.8% gain in the benchmark S&P 500 index.

Despite the recent success, the portfolio is not standing pat, as beverage company PepsiAmericas (PAS) is being swapped out for Fresh Del Monte Produce (FDP) in a move that I cannot attempt to explain. As fun as it has been watching and commenting on the doings of this mechanical portfolio, I am looking forward to rolling out a discretionary portfolio at the beginning of the new year.

There are no other changes to the portfolio this week.

A snapshot of the portfolio is as follows:

VWSI Rises to +3 as Volatility Wanes

The VWSI last hit +3 just eight weeks ago and prompted the headline VWSI Slips to +3; Pressure Builds for Correction. That correction arrived, but the bigger question is whether it is going to be taking a seasonal vacation this year. I suspect that this will not be the case and December will have more than the usual amount of fireworks, so I will be long dry gunpowder.

With a drop of 3.05 points or 11.7% to 22.91, the VIX had its lowest end of week close in five weeks, but I wouldn’t necessarily read too much into these data points. Ultimately it is what the markets do at major support levels that will determine how volatile we are going forward and not volatility that will wag the dog.

For a survey of the best in current thinking about the markets, Barry Ritholtz at The Big Picture sums up the week that was and the week that will be:

Looking ahead, for those with an interest in the COT report, note that the commercials have been getting long volatility as of late. While the track record of this group is not great, it is better than most, so their actions bear watching.

(Note that in the above temperature gauge, the "bullish" and "bearish" labels apply to the VIX, not to the broader markets, which are usually negatively correlated with the VIX.)

Wine pairing: For previous VWSI readings of +3, I highlighted sauvignon blancs from Cloudy Bay and the Marlborough region of New Zealand, as well as some excellent California producers whose sauvignon blanc can be had locally for $10 or less: Bogle; Chateau St. Jean (where it goes under the fumé blanc moniker); Concannon; Kenwood; and Sterling. More recently, I was impressed by a complex sauvignon blanc, with a little bit of oak, from Gary Farrell Vineyards. Their 2005 effort can be had for about $25; for my money, it knocks the socks off almost all of the chardonnays in that price range.

Finally, for an entertaining (think the mannerisms of Joe Pesci and Woody Allen blended with the enthusiasm of Jim Cramer) and informative look at sauvignon blanc, I encourage the reader to sample Gary Vaynerchuk's "Sauvignon Blanc Taste-Off" on wine library tv.

DISCLAIMER: "VIX®" is a trademark of Chicago Board Options Exchange, Incorporated. Chicago Board Options Exchange, Incorporated is not affiliated with this website or this website's owner's or operators. CBOE assumes no responsibility for the accuracy or completeness or any other aspect of any content posted on this website by its operator or any third party. All content on this site is provided for informational and entertainment purposes only and is not intended as advice to buy or sell any securities. Stocks are difficult to trade; options are even harder. When it comes to VIX derivatives, don't fall into the trap of thinking that just because you can ride a horse, you can ride an alligator. Please do your own homework and accept full responsibility for any investment decisions you make. No content on this site can be used for commercial purposes without the prior written permission of the author. Copyright © 2007-2023 Bill Luby. All rights reserved.
 
Web Analytics