VXX and VXZ Now Five Years Old!
In the midst of all the emerging markets turmoil, I wanted to take a moment to acknowledge the fifth birthday of the two pioneering VIX ETPs : VXX and VXZ. Launched five weeks before stocks hit their 2008-09 financial crisis bottom, both VXX and VXZ have struggled against a tide of falling volatility over the course of the past five years and have also been battered by persistent contango in the VIX futures, which has created additional head winds in the form of negative roll yield.
The table below captures the grim history of these two products, looking at product lifecycle years from January 30th to January 30th:
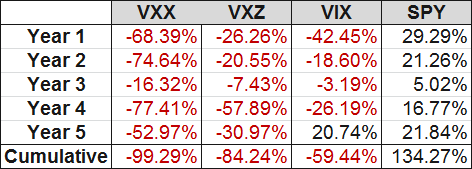
[source(s): CBOE, Yahoo, VIX and More]
Note that even though each of the five years have been losing years for both products, there have been periods in which these products have been extremely strong performers. One of these periods was from July to October 2011 when VXX nearly tripled (maximum gain of 198%) and VXZ rallied some 66%. I mention this because both have performed well in January, with VXX up 13.0% as I type this and VXZ with gains of 2.2% for the year.
While I am not going out on a limb and predicting a renaissance for these two VIX ETPs, they are two of the most important and liquid VIX ETPs on the market and can be attractive hedges or speculative trades when the markets go through a period of selling and/or there are concerns about a potential crisis.
I have been writing about these even before they were launched and will continue to offer my thoughts on them going forward.
Related posts:
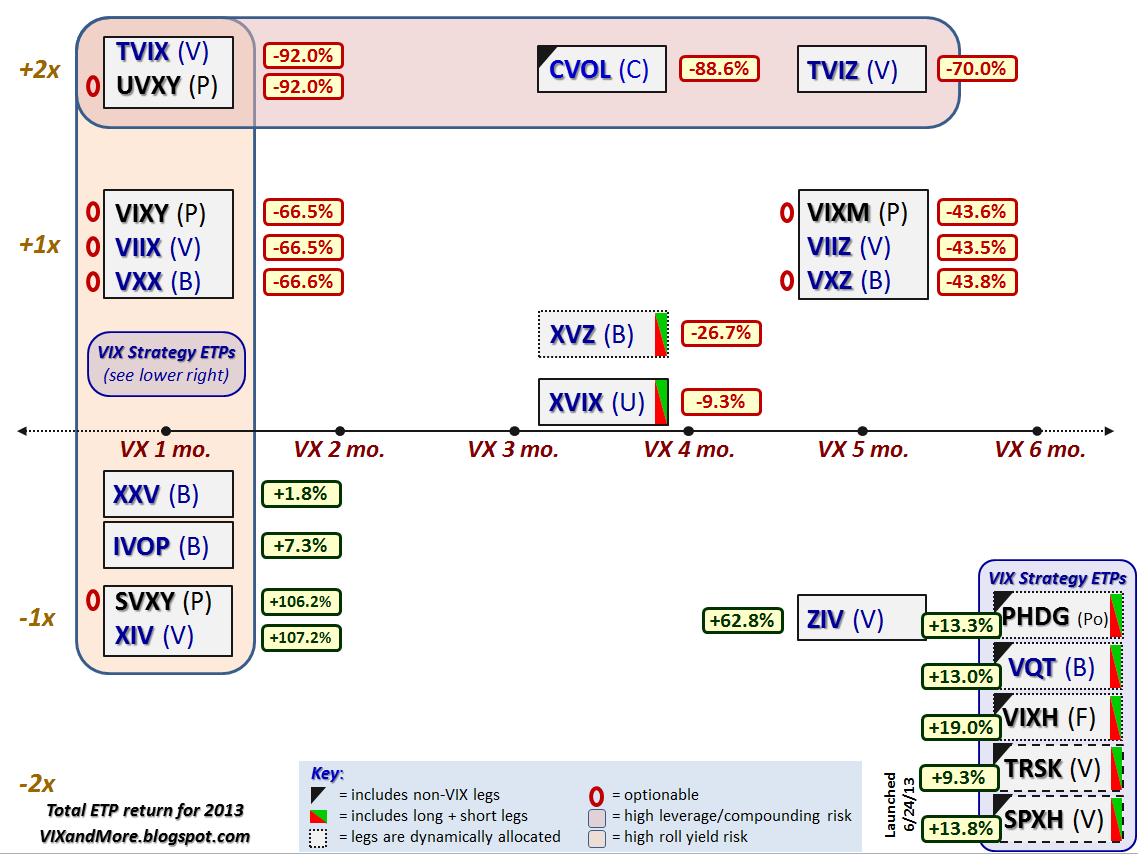
- Performance of VIX ETPs in 2013
- VIX ETP Performance in 2012
- VIX Exchange-Traded Products: The Year in Review, 2011
- Performance of VIX ETPs During the Recent Debt Ceiling Crisis
- VXX, VXZ, XIV and ZIV During Eleven Months of a Sideways VIX
- A Monthly Comparison of VXX and VXZ
- XIV and ZIV Are Huge Success Stories Two Years After Launching
- VIX Futures Term Structure in 2013 Looks a Lot Like 2012
- VXX and VXZ Celebrate Fourth Birthday
- VXX Celebrates Third Birthday
- Chart of the Week: VXX Celebrates 2nd Birthday
- VXX Calculations, VIX Futures and Time Decay
- Why VXX Is Not a Good Short-Term or Long-Term Play
- VXX Monthly Performance
- Chart of the Week: VXX Celebrates One Year of Futility
- Chart of the Week: VXX vs. VIX
- Managing Risk with a Short VXX Position
- Charting the Assets of Volatility-Based ETPs
Disclosure(s): short VIX and VXX at time of writing
[source(s): CBOE, Yahoo, VIX and More]