Performance of VIX ETPs During the Recent Debt Ceiling Crisis
Since the first big wave of VIX ETPs hit in 2010, I have periodically plotted all these products on a grid that used the y-axis for leverage and the x-axis for target maturity. While the initial intent was to highlight roll yield risk and leverage/compounding risk, over time I was unable to resist the urge to indicate which ETPs were optionable, which had both long and short legs, which had legs that were dynamically allocated, which had non-VIX components, etc. In other words, I fell victim to my unceasing need to try to tell an entire story on one slide, no doubt due in part to having seen too many 80-page presentations put together by consulting teams…
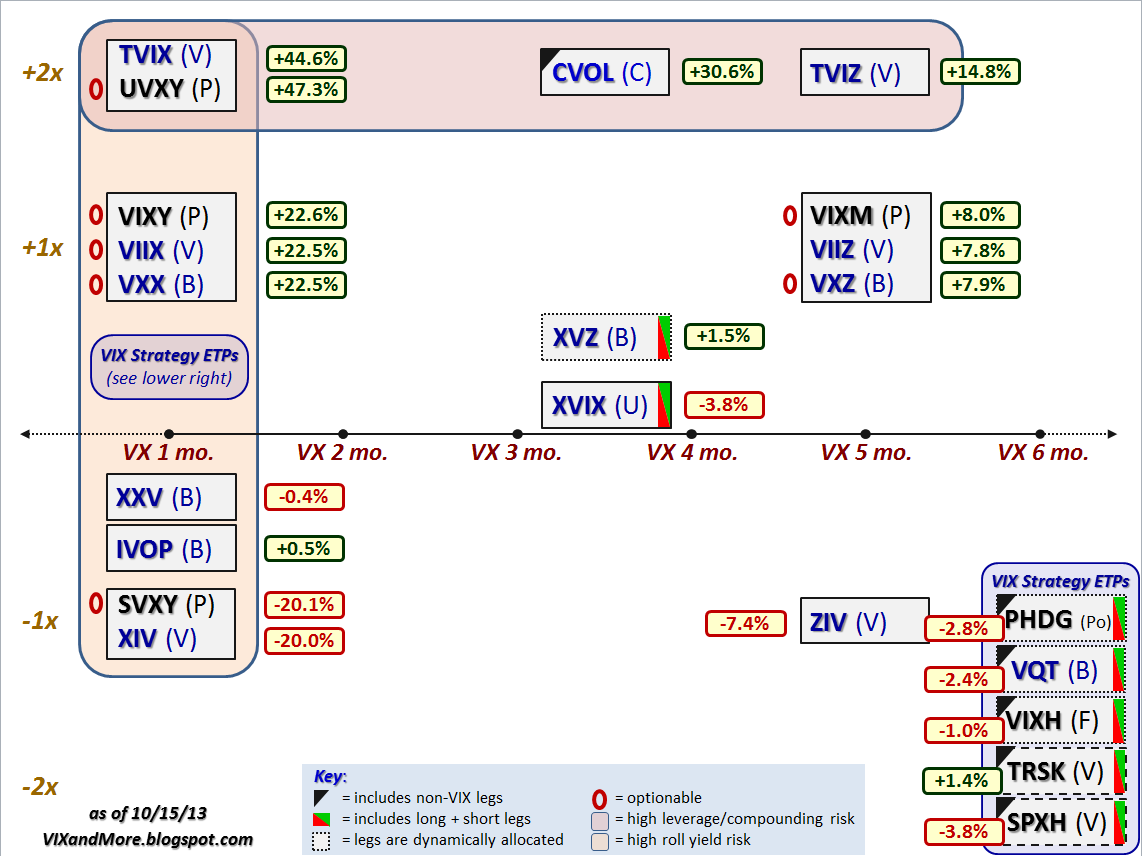
That being said, today’s iteration of my graphical depiction (“field guide”) of the VIX ETP universe is somewhat of a compromise. This compromise is due in part to the proliferation of VIX ETPs that combine long and short legs and have those legs dynamically allocated. The first of these to launch (back on August 31, 2010) was the Barclays ETN+ S&P VEQTOR ETN (VQT), which was followed by the First Trust CBOE S&P 500 Tail Hedge Fund ETF (VIXH) on August 29, 2012 and later by the PowerShares S&P 500Downside Hedged Portfolio (PHDG) on December 6, 2012. The field became considerably more crowded this year when VelocityShares launched the Tail Risk Hedged Large Cap ETF (TRSK) and the Volatility Hedged Large Cap ETF (SPXH) on June 24, 2013.
Rather than cramming these five similar products into the same narrow space, I have separated them from the grid and given them their own “VIX Strategy ETPs” box. With VIXH and PHDG now having a reasonable body of historical data to analyze, I have had a fair amount to say about these products already and will have more to say about them in the near future. TRSK and SPXH present an entirely different approach to hedging with volatility products and I will devote a separate post to these in short order.
In the meantime, the graphic below shows the performance of all the VIX and volatility ETPs from September 20 (when the VIX closed at 13.12) to October 8 (when the VIX closed at 20.34), when the VIX spiked 55% increase in just 12 trading days. As the graphic shows, for the most part the higher the leverage and the shorter the duration, the better the VIX ETP performed during the crisis. The performance of the VIX strategy ETPs was a mixed bag, with only TRSK posting a gain during this period. Another perennial hedging favorite, XVZ, also posted a gain.
[source(s): CBOE, Yahoo, VIX and More]
The trick with these hedges is one of timing. As has been noted here on many instances in the past, the top performers in a crisis are typically those which are ravaged by price decay due to roll yield and/or compounding when the VIX does not spike. Compare the winners and losers in the graphic below with the winners and losers tallied in VIX ETP Performance in 2012 to gets a sense of how expensive it can be to carry speculative long volatility positions as well as more dynamic hedging positions over the course of an extended period. The bottom line is that it is almost impossible to create a VIX ETP that will perform well when the VIX spikes and when there is below average volatility or expectations of future volatility.
This is not to say that it is impossible to time long and short volatility positions in order to be positioned to take advantage of increases and decreases in volatility, only that most buy-and-hold scenarios have a negative long-term expectation and timing the volatility market is probably more difficult than timing the equities market.
The bottom line is that if you think Democrats and Republicans might have some difficulty navigating the January 15 deadline for funding the government or the February 7 deadline for raising the debt ceiling once again, then look no farther than the graphic above for some ideas about how to trade these events.
Related posts:
- A History of the VIX During Recent Debt Ceiling and Sequestration Battles
- VIX ETP Performance in 2012
- Expanded Performance of Volatility-Hedged and Related ETPs
- Performance of Volatility-Hedged ETPs
- Performance of VIX ETP Hedges in Current Selloff
- Comparing SPLV and VQT
- Three New Risk Control ETFs from Direxion
- Will TVIX Go To Zero?
- Four Key Drivers of the Price of TVIX
- All About UVXY
- The Case for VQT
- Why VXX Is Not a Good Short-Term or Long-Term Play
- VXX Calculations, VIX Futures and Time Decay
- 2012 VIX Futures Term Structure as an Outlier
- Cheating with Partial Hedges
- How to Insure Your Stock Portfolio (Barron’s)
Disclosure(s): none

