Thursday, April 28, 2011

Reader Q and A: Straddles and Implied Volatility

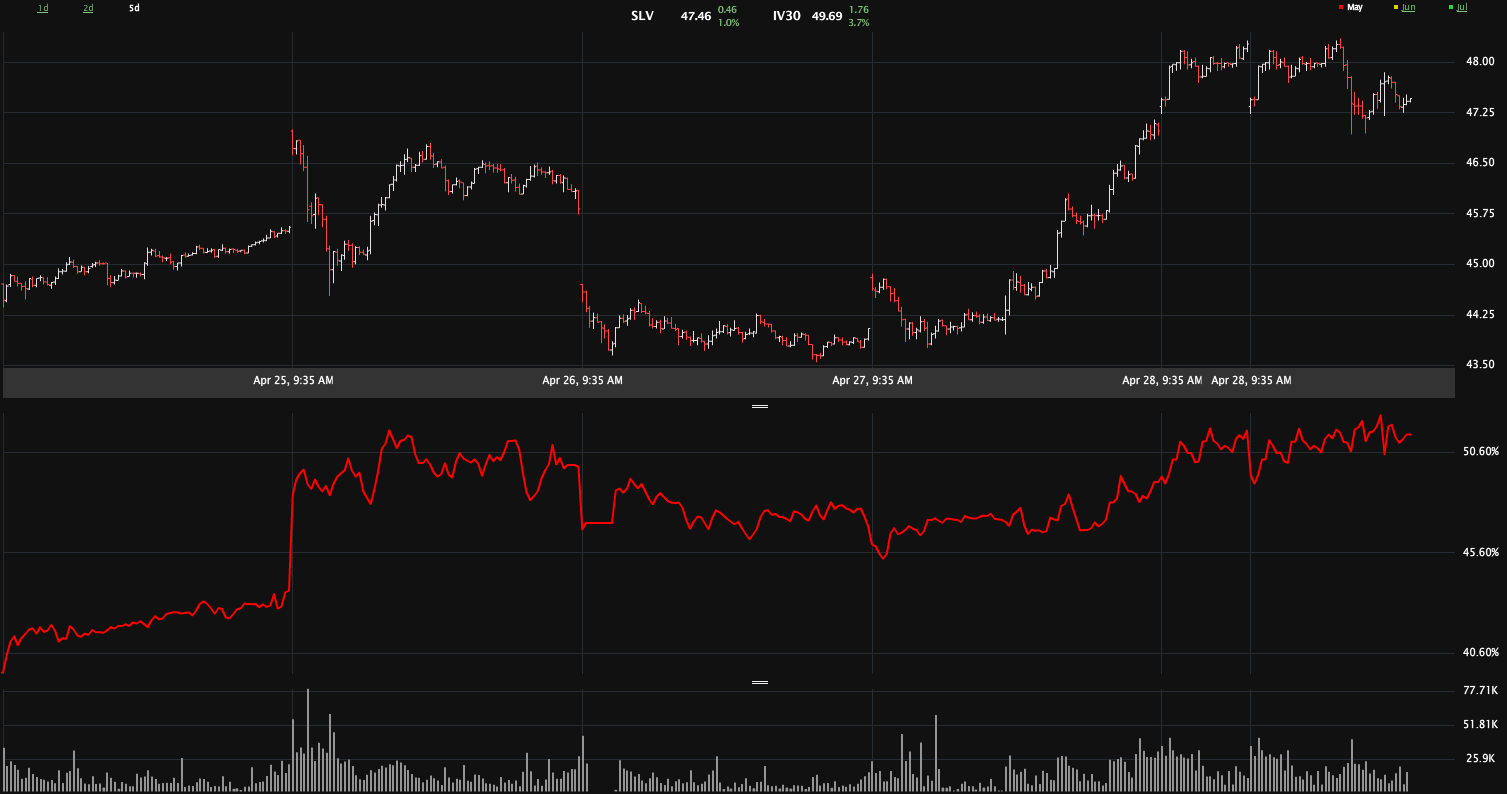
Right before the close last Wednesday I placed an ATM straddle that proved to be profitable and I closed it after the IV spike on Thursday. I shouldn't have come back for more, but I placed another ATM straddle Monday before the close and even with the huge drop in price on Tuesday the IV collapse only allowed me to break even. These were my first two super short term volatility trades and now I now that the free IV data on the CBOE's website is an end of day service... definitely wouldn't have placed that trade on Monday afternoon. Seeing now that I possibly should have been doing the opposite, shorting volatility, do you suggest any strategies that aren't outright short and don't require a big amount of margin to be put up? 

Also, what service do you use to view real-time IV for ETFs and such?
Adam C.

Hi Adam,

As a newbie, you should make an important distinction between options trades that have unlimited risk and those that you should characterize as limited risk or defined risk. Shorting 10 SLV July 47 calls theoretically opens you up to unlimited risk because SLV can continue to go up and up. Should this happen, depending upon your cash cushion, eventually your broker will hit you with a margin call and you will be forced to cover at a significant loss.

Take the same basic trade and add a second leg as a hedge and your unlimited risk is now limited. Instead of a naked short, a bear call spread involving 10 short SLV July 47 calls plus 10 long SLV July 50 calls caps your loss at the distance between the two strikes. Here that is 50-47 or three points. Three points times 10 options (with a 100 multiplier) puts your maximum loss at $3000.

Make that trade right now and for 10 contracts you should receive a credit of about $1.20 for that spread, so that means your maximum profit is $1200 and maximum loss is $3000 - $1200 or $1800.

This is a directional bet. For a non-directional bet – meaning that you expect SLV to be at about 47.00 at the time of the July expiration, you should probably focus on condors and butterflies, which are essentially the limited risk version of strangles and straddles. Sometimes you will hear a trader refer to “buying the wings.” What that means is they are converting an unlimited risk strangle or straddle into a limited risk condor or butterfly by buying out-of-the-money legs to hedge their risk, just as was the case with the call spread example above. As a matter of fact, one way to think about an iron condor is that it is just a bear call spread plus a bull put spread. Early on I used a more generic label of vertical credit spread on the blog for these strategies. You should be able to follow any of these links to get more information.

An even better way to get up to speed on these strategies is with some online resources. A good place to start is with the Options Industry Council (OIC), where they have an Options Strategy Index. Click on any strategy diagram for more information. Among the many great resources out there, I can highly recommend the CBOE’s Options Institute, where you might want to start with their tutorials. Keep in mind that the options brokers also do an excellent job of educating their customers on options strategies. Two that put a great deal of effort into education are optionsXpress (Education Center) and thinkorswim (Swim Lessons).

Also, the links below should provide some specific posts that will give you some food for thought regarding your recent SLV (?) trade and some alternative approaches.

In terms of real-time IV, I use Livevol Pro, which provides the graphs that I use on the blog for implied volatility and historical volatility. Your favorite options brokers (thinkorswim, optionsXpress, TradeMONSTER, Options House, Trade King, etc.) should also have good real-time or nearly real-time IV data. If you don't have an account at a broker that specializes in options, I highly recommend you open up one with at least one of the brokers mentioned above so you can get your data and place your trades on the same platform.

Related posts:
Disclosure(s): Short SLV at time of writing; Livevol, CBOE, optionsXpress, TradeMONSTER, Options House and Trade King are advertisers on VIX and More

Silver Implied Volatility Rises Over 50

Yesterday, in the awkwardly titled Is Volatility a Better Play for Silver than Direction? I noted that silver implied volatility had managed to push to heretofore unseen heights and argued that future projections based on SLV options prices had led to a high probability short volatility setup.

Of course, no sooner had I posted than SLV began to climb rapidly in price, bringing implied volatility along for the ride. The pattern has continued for the first half of today’s trading session, with silver futures above $49/oz. and the SLV ETF pushing above 48.

The chart below, from Livevol.com, shows the intraday price and implied volatility (red line shows implied volatility for May options) action in SLV for the past five trading sessions. Note that for the most part, silver implied volatility has had a strong positive correlation with the price of the underlying ETF. This is largely because silver is making new highs and traders see the potential for a big move should silver futures break out above $50/oz.

In terms of trading, I still like the idea of a short volatility play on silver and am currently actively managing several positions with both a volatility and directional component.

For directional traders, the lure of huge momentum play is often too much to resist. For options traders, who are essentially trading volatility more than anything else when all is said and done, playing volatility Whac-A-Mole can be similarly enticing. If you jump on this trade, just make sure you are the one doing the whacking…

Related posts:


[graphic: Livevol Pro]

Disclosure(s): Short SLV at time of writing; Livevol is an advertiser on VIX and More

Wednesday, April 27, 2011

Is Volatility a Better Play for Silver than Direction?

It seems as if everyone in the world has an opinion about silver. Is it a bubble? Has it topped? Is it just consolidating before it goes to triple digits?

I have been trading silver directionally with a trend-following approach for many months, but recently exited all my long positions when I came to the decision that a top was imminent.

Still, silver looks way too attractive for me to sit on the sidelines, so now I am trading silver volatility instead of a directional play. The chart below from Livevol.com neatly illustrates my rationale.

Looking at the silver ETF, SLV, for the past six months, one cannot help but observe the ever-widening gap between implied volatility and historical volatility that has developed during the latter half of March. While it is certainly understandable that there is a great deal of uncertainty about the price of silver going forward, given the extreme recent volatility, I find it hard to believe that traders are betting silver will be about twice as volatile in the next month as it has been over the course of the last month.

For me this is a classic short volatility setup, with straddles, strangles, butterflies and condors looking to be pricing in an excessive amount of volatility. One need not necessarily structure those short volatility trades with the current price of SLV (about 44.18) at the midpoint of the spread. If one thinks silver has topped, why not sell a straddle at 43 or a strangle with a 40-45 spread? For now my focus is primarily a non-directional short volatility play, but one can also make a good case for a short volatility trade with a small directional twist, at least as I see it.

Of course, silver always presents some interesting pairs trading possibilities, typically with gold, but given the recent positive correlation between silver and stocks, an interesting approach is to look at short silver trades as a hedge for long equity positions.

Related posts:


[graphic: Livevol Pro]

Disclosure(s): neutral position in SLV via options at time of writing; Livevol is an advertiser on VIX and More

Tuesday, April 26, 2011

A Trio of Niche iPad Financial Markets Apps

In my ongoing review of financial markets apps for iPad, there are several which defy easy categorization or appear to be the only entrants in their respective categories. Today I look at three such apps:

  1. ETFdb

  2. CBOE

  3. WolframAlpha
All three apps offer very different content that is aimed at users who focus on a specific niche of the investing world.

In the case of ETFdb, the focus is on ETFs and the app carries over much of the content from the popular ETFdb.com web site. The app has two main pieces of functionality: an ETF screener and ETFdb news articles. The screener is somewhat basic and the articles appear in chronological order, what it makes it difficult to keep track of specific sectors or asset classes in real-time. Still, when one drills down from the screening tool, some excellent ETF (and ETN) content is unveiled. The profile pages (see graphic below) include eight separate tabs that are filled with information, including data on holdings, fund performance, charts, technical analysis details, related news, and a link to the issuer home page, where one can generally find a prospectus, dividend information and other details. In short, ETFdb is an excellent tool for researching individual ETFs, though its screening and news functionality could use some enhancements.

The CBOE app covers a different slice or slices of the investment world. It includes general market data (indices, most active stocks, most active options, etc.), quotes, news and a watchlist function where users can pull up options chains and access data and charts for every option associated with a particular underlying. The CBOE app also has some high quality educational content from the Options Institute. Here one can learn the basics of options strategies, take an online course or review a variety of additional educational materials from the CBOE’s educational arm. CBOE TV content is also available on the app. These include videos on breaking news and timely subjects as well as more general background material. Last but not least, the CBOE app has a link to the CBOE twitter feed, which highlights significant options transactions, breaking news and new content on the CBOE web site. For those who are interested in options and particularly options education, the CBOE iPad app should be a high priority.

I found WolframAlpha to be the most interesting and difficult to describe of the three apps. This is partly because it had been awhile since I visited the WolframAlpha web site, but also because the app is such a superb fit for the iPad form factor and display. A self-styled “computational knowledge engine,” think of WolframAlpha as Wikipedia on steroids (lots of them), tied to a world class mathematical brain that effortlessly conveys the nuances of complex subjects with the help of an extremely deft use of statistics and graphics. Yes, it is an elegant nerd. Type in “VIX’ at the web site or in the iPad and you can quickly see what VIX is all about. Try “iron condor option” and you can quickly visualize and internalize much of what that strategy is all about. Tickers work too, though not all of them. Enter “GOOG” and the app (or web site) will pull some interesting stock data and graphics for Google. Unfortunately, there is no such luck with “VXX” and the rest of the VIX exchange-traded products. Unlike the other apps review above and in previous posts, the iPad version of WolframAlpha is not free, but for $1.99 I have little doubt that users will find a way to get their money’s worth out of this application.

In sum, these are three apps that cover a specific aspect of the investment universe and do so in an attractive manner. Investors interested in ETFs, options or computational data and graphics are encouraged to take each of these three apps for a test drive.

Related posts:

[graphic: ETF db]

Disclosure(s): short VXX at time of writing; the CBOE is an advertiser on VIX and More

Monday, April 25, 2011

Chart of the Week: VXV at Critical Juncture

It seems almost like heresy to consider something other than silver or the VIX as a candidate for the Stock of the Week, but since there have been so many posts and charts about both subjects, I thought I might offer a slightly different twist.

Yes, it is time for me to trumpet the importance of VXV once again. For those who may have forgotten, VXV’s formal name is the CBOE S&P 500 3-Month Volatility Index. The CBOE describes the index in detail here, but the key takeaway is that VXV is essentially a 93-day version of the 30-day VIX. In other words, whereas VIX looks out at just one month of potential volatility and disruptions to the financial markets, VXV has a time horizon of one quarter. This means, among other things, that while both capture the essence of the Q1 earnings reporting season, VXV includes three FOMC meetings and three nonfarm payroll reports, among other things. And whereas there may be no significant developments regarding Greek debt restructuring, it is unlikely that this issue will not be addressed in the next three months.

For these and other reasons, I have always felt that VXV provided a better reflection of long-term and structural/systemic volatility than the VIX, which is better suited to measuring short-term event volatility.

Looking at a weekly chart of VXV since its October 2007 launch, one cannot help but notice a pattern of historical support in the 17.50 – 18.00 zone. Friday’s close took VXV down to 18.35. A couple of closes below could signal not just a change in structural volatility and longer-term risk, but also the arrival of a new volatility regime.

Related posts:


Disclosure(s): neutral position in VIX via options at time of writing

[graphic: StockCharts.com]

Spotlight on the VIX and Bollinger Bands

As we sit in the pre-FOMC doldrums contemplating how Ben Bernanke will handle his historic post-meeting press conference and wondering whether we can properly label the next VIX move to 17 or 18 a ‘spike,’ this seems like a good time to review some of the elements of VIX spikes and other measures of VIX extremes.

Better yet, point your browser to the My Simple Quant blog and more specifically to a post from last Thursday, More on VIX and Bollinger Bands, in which the resident author Chris has presented the results of his analysis of what happens to the VIX and SPY in the week following those instance in which the VIX closes below its lower Bollinger band two days in a row.

A couple of comments are in order on the analysis at My Simple Quant. First, the results should not surprise long-time readers here, but for those who are prone to not click through, there is always something to be learned in the details. I have discussed at some length how one can use simple and exponential averages, moving average envelopes, Bollinger bands and other similar mechanisms to measure how far the VIX has strayed from various assessments of a historical range.

An important point to consider – and one not stressed by My Simple Quant – is that the VIX is generally a better market timing mechanism when it spikes up than when it prints extreme lows. Perhaps a better way of thinking of this phenomenon is that while an extremely high VIX can rarely cause investors to rethink where an appropriate range should be for volatility, an extremely low VIX can sometimes be a self-reinforcing mechanism and signal a move to a new lower volatility regime.

Related posts:

Disclosure(s): neutral position in VIX via options at time of writing

Thursday, April 21, 2011

iPad Financial Markets Apps from FOX, Thomson Reuters and NASDAQ OMX

In reviewing broad-based financial markets news and data apps for iPad, I began with the free apps, which include the high quality CNBC Real-Time for the iPad and runner up, Bloomberg for iPad – both of which I reviewed earlier this month.

A second tier (perhaps too harsh of a characterization) of free apps in the same broad-based financial markets space that I experimented with include one app from FOX, two from Thomson Reuters and a more specialized app from the NASDAQ OMX.

My favorite of these near misses is FOX Business for iPad, which is similar to the CNBC and Bloomberg apps in that its focus is on news, video content and market data. The site is attractively organized, has a large amount of up-to-date video content, includes a portfolio tracker function and a FOX Business Minute button which enables users to quickly scan the day’s headlines and link to related video. In sum, the feature-filled FOX app is a strong competitor to CNBC and Bloomberg and will probably be preferred by some to its two main competitors. In the end I am counting it as a near miss because of some content organization and graphics issues. I was also disappointed that FOX Business for iPad did not have the XIV ETF in its database and was therefore unable to add it to my portfolio.

The two Thomson Reuters products struck me as slightly too news and text-centric for my taste. My favorite of the two is Reuters News Pro for iPad, which has a strong global focus in terms of financial and non-financial news. It also puts more emphasis on global markets and currencies than the competition. While this app lacks a formal portfolio management function, it does have an attractive portfolio monitoring module, Stocks, that makes it easy to track various holdings in terms of news and performance, along with charts. For the international investor, I can certainly see where News Pro might supplement or in some cases even win out over the more U.S.-centric CNBC, Bloomberg and FOX apps. I am still not sure exactly which audience the Thomson Reuters Marketboard app is targeting, though it looks as if this app attempts to leverage and extend the functionality and data available to Thomson ONE account holders. In some respects the app strikes me as a potential companion to News Pro. Again there is a strong global data to the content, but the emphasis is more on headlines and snapshots than detailed content. If you are interested in research, company reports and corporate events – and particularly if you are an existing Thomson ONE subscriber – Marketboard should have a good deal of appeal.

Of all the apps in this group that I wanted to get excited about, at the top of my list was QFolio HD – the NASDAQ OMX Portfolio Manager. While apps from individual brokers are great for tracking broker-specific holdings, the functionality I have yet to find is one that deftly aggregates portfolio information across multiple brokers and asset classes. Unfortunately QFolio did not live up to my expectations, though not for lack of trying.

There are three main screens for QFolio: Portfolio; Company Details; and Market Mind. The Portfolio screen includes aggregated portfolio information with total portfolio value. I was disappointed by the fact that the overview screen only has sufficient real estate to display four holdings on one screen at a glance. While scrolling affords quick access to the full list of holdings, it would be nice to have more holdings and less information available on one screen, ideally with this information customizable by the user. The graphic below is a snapshot [with fictitious portfolio data -Ed] of the Company Details data display, which includes links to a StockTwits feed as well as a StockTwits TV video feed. Last but not least is the Market Mind feature, which turns out to be the best way to monitor changes in prices for five or more holdings at a time. Here one can monitor prices, view intraday charts and even view time and sales data. While the current incarnation of QFolio is certainly an adequate portfolio management tool, it has the potential to be even more. I look forward to seeing how this app evolves over time.

Related posts:


[graphic: QFolio/NASDAQ OMX]

Disclosure(s): long XIV at time of writing

Continued Lackluster Economic Data vs. Expectations

While investors are focusing most of their attention on earnings reports, I am looking ahead to next week’s FOMC meeting, where the Fed will be more interested in economic data rather than corporate earnings.

For this reason – and because of the absence of recent compelling trends in economic data – I have elected to publish an updated version of my chart of economic data vs. expectations, which has been a big hit in the past.

The chart shows that manufacturing and employment are no longer providing positive surprises relative to expectations, while data related to the consumer reflect consumer activity that is plodding at best. Housing and construction data, which had been a source of positive surprises in 2010, has shown some recent strength, but it is too early to consider this development any sort of new trend.

If I were the Fed I would continue to see a slow growth story, with 2011 bringing much less in the way of positive surprises than 2010 – at least in the first four months.

For more information on the components of this chart and the methodology, check out the links below to archived posts on the same subject.

Related posts:


Disclosure(s): none

Wednesday, April 20, 2011

The VIX, VIX Products and Replication

Jared Woodard of Condor Options is out with a post today, Why I’m Not Worried About VIX Derivatives, in which he reviews some recent FT Alphaville commentary about the difficulty in valuing VIX futures, the idiosyncrasies of various VIX-based products, the shortcomings associated with a synthetic VIX, and the implications for volatility as an asset class.

Over the years (I still can’t believe I am in my fifth year of blogging) I have addressed all of these issues to one degree or another, but seeing some of the points being raised by Jared and the FT Alphaville staff, it looks like time to take a deeper dive into these issues, some related sidebar issues, and make an effort to come up with some sort of unified theory of volatility products. Of course I can’t possibly cover all of the space today, but I can at least dive in.

For starters, here are the four FT Alphaville articles referenced by Jared, which are authored by Izabella Kaminska, Tracy Alloway, as well as Theo Casey of Futures & Options World:

The question that seems to be on everyone’s mind right now is why the VIX is “so low.” Better yet, investors would like to know how low the VIX will go and what some reasonable expectations are for the VIX for the balance of 2011.

First, let me dispense with the idea that the VIX is low. With 10-day and 20-day SPX historical volatility just over 8 and 100-day SPX HV below 12, the VIX is actually a little inflated relative to current measures of realized volatility, even factoring in the standard risk premium.

Second, the VIX is currently in the 32nd percentile of VIX readings going back to 1990. This means that in the 21 years of VIX historical data, the index has been below its current level about one out of every three days.

Third, I think most investors are struggling most with the idea that even with low realized volatility, we have huge issues facing the global economy, including the European sovereign debt crisis, a Japanese nuclear disaster and ripple effect that is far from contained, rising oil prices, strong inflationary pressures across the globe, a huge Fed balance sheet and a host of other formidable threats to economic and political stability.

Fourth, investors are still reeling from the financial crisis of 2008 and the many ways in which that crisis shaped not just a new economic landscape, but a new way in which investors look at the investment world (i.e. "disaster imprinting") and the risks associated with it.

The knee-jerk reaction for many investors is that the VIX is naĂŻve, misguided or perhaps not as relevant as many think it is.

In the links below I address a number of the issues raised by the FT Alphaville staff and Jared. I hope readers will find some insight in these archived posts below, but I promise that in the weeks to come, each of the issues noted above will receive a much more thorough treatment.

In the meantime, do not be surprised if the VIX stays “too low” for an extended period…

Related posts:
Disclosure(s): neutral position in VIX via options

Tuesday, April 19, 2011

Expiring Monthly April 2011 Issue Recap

The April edition of Expiring Monthly: The Option Traders Journal was published yesterday (in keeping with our practice of publishing on the Monday following options expiration) and is available for subscribers to download.

In this month’s issue I author the feature article, Exploring Put to Call Ratios. This is somewhat of a departure from the bulk of the content of the magazine, which continues to focus on options as trading vehicles. For many of us, however, options are not only highly flexible trading vehicles, but also the source of quite a few slices of data that can serve as indicators, most notably the VIX and put to call ratios.

Some of my favorite articles in the current issue of Expiring Monthly include a Mark Sebastian interview noted options guru Larry McMillan; a guest article on the CBOE PutWrite Index (PUT) from Jason Ungar; and a thought-provoking piece from Jared Woodard on three volatility plays for the European sovereign debt crisis.

Mark Sebastian also interviews Ping Zhou, a co-author of Trading on Corporate Earnings News and pens the monthly Follow That Trade column, which focuses on position management for an OEX butterfly. Mark Wolfinger continues to be a prolific contributor, speaking out on options brokers are putting limits on customer trading on the last trading day of the expiration cycle, debating the role of options as speculative vehicles and offering some thoughts to the new options trader around risk, timing and money.

All in all I am delighted by the quality of our fourteenth issue, thrilled by the positive feedback I have received from readers, and excited by some of the articles that are currently taking shape for the coming months.

In keeping with tradition, I have reproduced a copy of the Table of Contents for the April issue below for those who may be interested in learning more about the magazine. Thanks to all who have already subscribed. For those who are interested in subscription information and additional details about the magazine, you can find all that and more at (the newly redesigned) http://www.expiringmonthly.com/.

Related posts:


[source: Expiring Monthly]

Disclosure(s): I am one of the founders and owners of Expiring Monthly

Thursday, April 7, 2011

TVIX Trades One Million Shares for First Time

Launched at the end of November 2010, the VelocityShares Daily 2x VIX Short-Term ETN (TVIX) has been the most popular of the volatility-based ETPs to hit the market in the past six months. Today TVIX hit a new milestone – barely halfway into the trading session – by surpassing one million shares for the first time.

Back in the middle of December, I predicted TVIX “will hit a tipping point and become the darling of day traders” in 2011. Frankly, I am a little surprised that it has taken more than five months to hit the one million share mark, but now that TVIX is adding liquidity, I would expect that day traders, hedge funds and other short-term trading operations will become much more active in this product.

Below is a snapshot of the intraday movement of TVIX taken from Bloomberg for iPad.

Related posts:


[graphic: Bloomberg for iPad]

Disclosure(s): none

Bloomberg for the iPad

In my ongoing look at trading apps for the iPad, I have elected to initially focus on the ‘big media’ all-in-one apps. I began with an overview of the space and some initial thoughts. Yesterday I offered some more detailed thoughts on CNBC Real-Time for the iPad, and today I turn to CNBC’s main competitor, Bloomberg.

To reiterate from earlier in the week, there are actually two different apps from Bloomberg:

Bloomberg for iPad is designed as a news-first application, which is evident from the graphic below – a screen capture of the home page for Bloomberg for iPad. On the plus side, the home page is a healthy blend of news, market data and watch list information. On the minus side, this page is not configurable, save for the ability to edit the top two “My Stocks” entries in a separate module.

The menu on the bottom outlines the full range of functionality. Charts are available for equity indices and stocks, but not for currencies, commodities or equity index futures. While those charts are attractive, the user can only customize the look back period (1d, 1m, 6m, 1y and 5y) and not add any technical indicators. No indicators are included with the charts, not even moving averages.

Where Bloomberg does trump CNBC Real-Time is with its portfolio monitoring functionality. Here users can enter share quantities and cost basis information in order to monitor profit and loss information on a security by security basis. True to its name, this My Stocks feature is limited to equities (and ETFs) and does not accommodate futures or other types of securities. I was also a little disappointed that there is no functionality to display total portfolio profit and loss for the current trading day or any historical period. Finally, it is important to note that while index quotes are in real-time, quotes for individual securities are delayed 15-20 minutes.

From a video perspective, Bloomberg does have a wide variety of podcasts available. Comparing these to the CNBC Real-Time video content, my sense is that CNBC has much more video content available and also a much larger library of content that is from the current trading day.

All things considered, I like the Bloomberg app and find it the news and My Stocks modules to be helpful, but I also see areas where Bloomberg needs to make some enhancements in order to put its product on par with CNBC Real-Time.

That being said, I would imagine that Bloomberg Anywhere for iPad, which is intended to provide a mobile version of the full Bloomberg terminal, would probably be the undisputed content and functionality king in this space. Not having had experience with this app, I will leave it for readers to chime in with their comments.

Next up: QFolio HD – the NASDAQ OMX Portfolio Manager

Related posts:

[graphic: Bloomberg for iPad]

Disclosure(s): none

Wednesday, April 6, 2011

Options Insider Radio Interviews Jay Caauwe of the CFE/CBOE

Mark Longo and Options Insider Radio recently conducted an extensive interview with Jay Caauwe, Director of Business Development for the CBOE Futures Exchange (CFE).
As regular readers know, I believe that an understanding of VIX futures is the cornerstone for being able to analyze and trade successfully the entire VIX product space, including VIX options and VIX exchange-traded products.
For those who are looking to get up to speed as soon as possible on VIX futures or perhaps just enhance their existing knowledge base, I recommend listening to Options Insider Radio 83: The Future of VIX Futures.
Related posts:


Disclosure(s): the CBOE is an advertiser on VIX and More

CNBC Real-Time for the iPad

Since there seems to be such a large supply-demand imbalance (little supply, lots of demand) regarding information on trading apps for the iPad, I have decided to devote a little time to drilling down on some of these apps.

First up is CNBC Real-Time for iPad, which offers a large amount of content ranging from market data and graphics to news and videos. For the investor whose primary goal is to monitor the markets when he or she is not at a desk, this app is an excellent choice. The market data goes beyond just stocks and the major market equity indices and includes commodities, currencies and bonds. As the app name indicates, quotes are in real-time and even include a separate Pre-Markets tab with equity futures data. The graphic below shows the menu structure and various tabs available. In the screen capture, I have elected to highlight the Markets > Movers > S&P data. A similar tab, Dow Impact, ranks the five stocks with the largest positive impact and negative daily impact on the Dow Jones Industrial Average, along with the point impact for each stock.

Looking at other features, the news and video content are what you would expect from CNBC: high quality, voluminous and current.

For portfolio monitoring, the My Stocks content pulls charts, news and videos together for each watch list entry. The charts use real-time NASDAQ and NYSE data and make it easy to compare a security to a variety of indices, as well as utilize technical indicators such as moving averages (SMA, EMA, WMA), Bollinger bands, MACD, RSI, DMI and a handful of others. In short, the market technician is well-served here, though it would be nice to have some ability to customize the default settings on the technical indicators.  One thing that is lacking is an ability to enter share and cost basis information so that investors can easily track changes to their portfolio in dollar terms across the full range of their holdings.

Even with these small caveats, all in all the CNBC Real-Time for iPad is an excellent ‘do everything’ app for those who wish to monitor the markets remotely and do not need to trade directly from their market monitor platform. Of course, there is nothing stopping this person from keeping their favorite broker-based application open at the same time and becoming an opportunistic trader as well.

Related posts:


[graphic: CNBC Real-Time for iPad]

Disclosure(s): none

Tuesday, April 5, 2011

Initial Thoughts on Using the iPad for Trading

Thanks to all who offered up some comments on their experiences using the iPad for trading. Today I will summarize the feedback I have received from other traders, then comment on my own initial experiences with the iPad 2.

Traders express positive feelings about four iPad apps in particular. Two of the four were broker applications:

  • thinkorswim mobile – now that thinkorswim and T.D. Ameritrade are finally showing some signs of integration, the TOS and TDA apps are surprisingly similar
  • Mobile TWS – TWS is the Trader WorkStation app from Interactive Brokers
Two others were general applications that are aimed in replicating desktop functionality:
  • LogMeIn Ignition – According to the company web site, and confirmed by several users, “One touch on your iPhone or iPad lets you remotely access your computers anywhere, anytime and manage your files on the go. Directly control your desktop as if you’re sitting in front of it, access your computer applications as if they were on your iPad, and view or manage files directly from your iPad/iPhone.”
  • Air Display – works like a wireless monitor
My experiences with the iPad encompass limited exploratory work over the course of two trading sessions, but I thought I would share my thoughts nonetheless.

As a desktop complement, I find that the iPad has limited utility. Perhaps the largest value would be in offloading some peripheral trading or general computing functionality, such as monitoring news events and the like.

As a mobile computing device, I believe the iPad has considerable potential, not just for news, but for analysis, trade execution, position monitoring and the like. I found the thinkorswim and Interactive Brokers trading apps to be excellent and I was also pleasantly surprised by the Fidelity iPad app, which I would put at least on par with the TOS and IB apps as my top three broker apps that I have examined.

As an options trader, I also looked briefly at the apps from optionsXpress and OptionsHouse and while these are fine initial efforts, in my opinion, they have a way to go before they can be considered in the same league as the three mentioned above.

CNBC (CNBC Real Time) and Bloomberg (Bloomberg for iPad and Bloomberg Anywhere, which is the full Bloomberg terminal) also have apps. I experimented with CNBC and Bloomberg for iPad and came away with the impression that these are both adequate general-purpose applications, but traders will likely prefer the offerings from their brokers, including those who are looking for better charting applications.

I have done very little trading with my iPhone over the years, but it does help me keep on top of any sort of extreme market conditions when I am traveling, but it always feels as if I am about 95% in the dark in terms of news and what is really moving the markets. With the iPad, I can see iPad trading as being almost comparable to laptop-based trading, but in an more transportable form factor and perhaps a simpler and more direct user interface.

I eagerly await the next generation of trading apps.

Feel free to add your own experiences in the comments below and/or suggest some additional iPad trading apps.

Related posts:
Disclosure(s): none

Monday, April 4, 2011

Chart of the Week: Crude Oil and Transports

With crude oil prices hovering around $108/bbl. level, it is only natural to begin wondering just what kind of impact crude prices will have on stocks.

Looking back at recent history, crude oil and stocks have been positively correlated, largely because an improving economy translates into increased demand for crude oil. At some point, of course, rising crude oil prices are going to translate into a drag on GDP and on equities. Consensus estimates for the impact of crude oil on GDP generally assign about a 0.25% drop in U.S. GDP for every $10 increase in crude oil.

Whether the negative correlation between crude oil and stocks begins to become apparent at $110 or perhaps at higher levels remains to be seen.

When oil prices begin to be a significant drag on stocks, it will likely show up first in the transportation sector. Looking at the Dow Jones Transportation Average (DJTA) and (West Texas Intermediate) crude oil prices since the beginning of 2010 in this week’s chart of the week, it is obvious that the positive correlation between crude oil prices and transports has continued all the way up to the present. While I expect this positive correlation to end shortly, as long as transports continue to move up in concert with rising crude oil prices, investors should feel comfortable with their long positions in equities.

Related posts:


[source: StockCharts.com]

Disclosure(s): long crude oil futures at time of writing

Sunday, April 3, 2011

VIX and More Newsletter Celebrates Third Anniversary

Today’s publication of the VIX and More Newsletter marks the third anniversary of the launch of this newsletter, which was launched on the heels of the demise of Bear Stearns amidst increasing concerns about the stability of the financial system and increasing market volatility.

Three years later the newsletter has definitely found its voice and represents a more detailed discussion of geopolitical and macroeconomic events than can be found here as well as some broader perspective on the full range of asset classes and issues related to volatility.

Rather than clutter up this blog, I have an entire blog dedicated to the newsletter, as well as the model portfolios and Stock of the Week ‘Sequential Portfolio’ (yes it really is up 1918% in its first 2 3/4 years) information I discuss in the newsletter each week: VIX and More Subscriber Newsletter Blog.

Disclosure(s): none

DISCLAIMER: "VIX®" is a trademark of Chicago Board Options Exchange, Incorporated. Chicago Board Options Exchange, Incorporated is not affiliated with this website or this website's owner's or operators. CBOE assumes no responsibility for the accuracy or completeness or any other aspect of any content posted on this website by its operator or any third party. All content on this site is provided for informational and entertainment purposes only and is not intended as advice to buy or sell any securities. Stocks are difficult to trade; options are even harder. When it comes to VIX derivatives, don't fall into the trap of thinking that just because you can ride a horse, you can ride an alligator. Please do your own homework and accept full responsibility for any investment decisions you make. No content on this site can be used for commercial purposes without the prior written permission of the author. Copyright © 2007-2023 Bill Luby. All rights reserved.
 
Web Analytics