Showing posts with label put to call. Show all posts

Thursday, June 13, 2013

ISEE Equities Only Index Prints Something Not Seen Since March 6, 2009

Put to call ratios are a permanent fixture in my indicator stable and something I have been writing about for a number of years, including an early 2007 effort, A Sentiment Primer (Long).

My perennial favorite of all the off-the-shelf put to call ratios actually inverts the traditional ratio: the ISEE equities only call to put ratio. This ratio only counts opening options purchases and excludes index and ETF products so as to provide a more targeted approach to divining what sort of speculative trades retail investors are favoring.

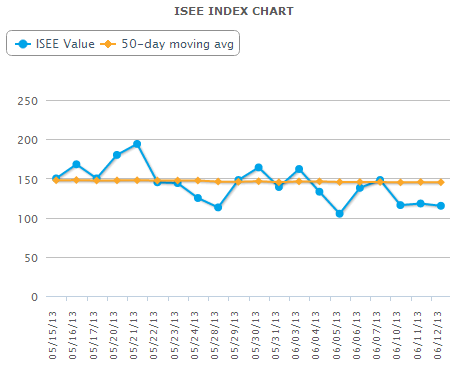
What got my attention yesterday was that in reviewing the components of my proprietary Aggregate Market Sentiment Indicator (AMSI) for the newsletter, I saw that the ISEE equities only call to put ratio closed under 120 (meaning less than 120 opening call purchases per 100 opening put purchases) for three consecutive days for the first time since March 6, 2009 – the date when the SPX put in its post-crisis bottom at 666 and began what has now been a bull leg that has lasted more than four years.  Not surprisingly, this kind of hat trick is typically associated with conditions in which stocks are extremely oversold and ripe for a bounce, as appears to be the case today and was certainly the case in March 2009.

For the record, the ISEE equities only call to put ratio is back in the middle of its traditional range today, most recently at 178, as the financial markets are discovering some sort of normalcy – at least outside of the context of the Japanese yen.

The chart below shows the ISEE equities only call to put ratio, using closing values for the past month, as of yesterday’s close.

Note that the ISEE ratios come in two other flavors: an index that is limited to index and ETF transactions; and an all securities index which combines the equities only data and the index + ETF data. Current and historical data for all three versions of the ISEE call to put ratios, as well as an interactive chart, are available at the ISEE Index page.

For those who may be interested in learning more about put to call ratios, I have a larger than usual list of links below to jump start your research.
[source(s): International Securities Exchange]

Related posts:

Disclosure(s): none

Thursday, May 17, 2012

A Million SPX Put Contracts Traded Today…a Contrarian Timing Signal

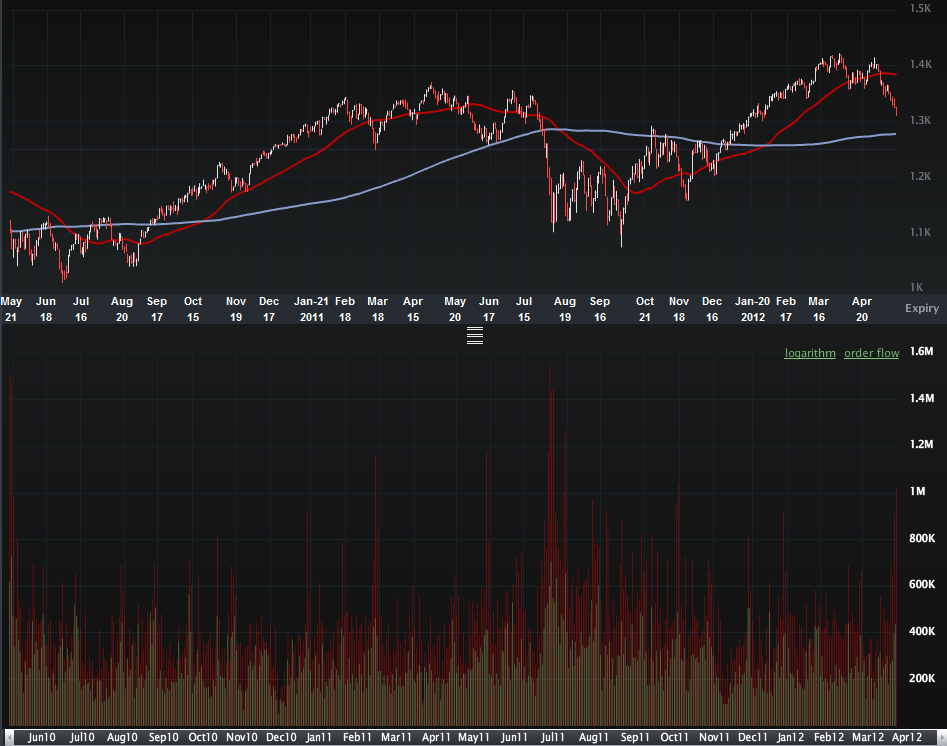
With a half hour to go in today’s trading session, over one million put contracts have already been traded on the S&P 500 index, which is about 2 ½ times the average daily volume. This elevated put volume comes on top of 913,000 SPX put contracts yesterday, which was the second highest for 2012.

The one million level is rarely seen in SPX puts and generally indicates an extreme amount of hedging on the part of institutional investors, as well as increased speculative activity.

Looking at the chart below, which goes back two years, one can see that in those rare instances when put volume (vertical red bars on lower half of chart) reached one million, this typically coincided with a bottom in stocks.  [Edit:  today’s finally tally is 1.28 million SPX puts, the highest total since August 9, 2011]

In addition to puts in the SPX, I also closely follow the ISEE equities only call to put ratio. The indicator I have developed which is based on the ISEE is now showing is greatest contrarian bullish bias (due to a preponderance of put volume) since the end of June 2010, just two days before the SPX put in an key bottom at 1010.

Of course, history is not guaranteed to repeat itself or even rhyme in the face of the current worries about Greece and Spain, but the odds now favor stocks finding at least a short-term bottom very soon.

Related posts:

[source(s): LivevolPro.com]

Disclosure(s): Livevol is an advertiser on VIX and More

Thursday, March 29, 2012

New Single Day High in ISEE Equities Only Index on Monday

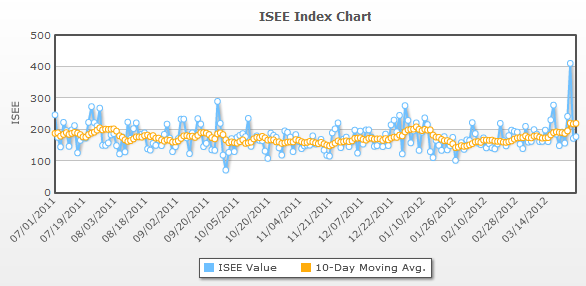
Lost in all the hoopla over the VelocityShares Daily 2x VIX Short-Term ETN (TVIX) was a historic event in the options and market sentiment world on Monday: a new single day high in the ISEE equities only call to put ratio.

To recap for those who may not be familiar with the ISEE, this ratio was developed by the International Securities Exchange (ISE) and is calculated by dividing opening long call options bought by ISE customers by opening long put options bought by ISE customers, then multiplied by 100. The ‘equities only’ slice of the full transaction pie means that all trades with indices and ETPs are excluded from this data, which also reduces the likelihood that any of the ISEE equities only data includes trades intended largely as portfolio hedges.

Monday’s record close of 410 means the ISE customers were buying four times as many calls as puts. Because there tends to be a lot of noise in the daily data, I like to average the data over a 10-day period. The chart below shows the ISEE equities only index since July 2011, along with the 10-day moving average.

Generally, put to call data is considered to be a contrarian indicator that flags when the masses are becoming overly exuberant or fearful and on Monday at least, exuberance – rational or otherwise – was running rampant, perhaps over the excitement of growing evidence of possible QE3 activity and a Bernanke put in general.

For what it is worth, the prior single day high in the ISEE equities only index dates from December 2010, when stocks were in the middle of a six-month bull move that resembles the current move in several respects and carried the SPX from 1039 to 1344.

Related posts:

[source(s): International Securities Exchange]

Disclosure(s): short TVIX at time of writing

Tuesday, April 19, 2011

Expiring Monthly April 2011 Issue Recap

The April edition of Expiring Monthly: The Option Traders Journal was published yesterday (in keeping with our practice of publishing on the Monday following options expiration) and is available for subscribers to download.

In this month’s issue I author the feature article, Exploring Put to Call Ratios. This is somewhat of a departure from the bulk of the content of the magazine, which continues to focus on options as trading vehicles. For many of us, however, options are not only highly flexible trading vehicles, but also the source of quite a few slices of data that can serve as indicators, most notably the VIX and put to call ratios.

Some of my favorite articles in the current issue of Expiring Monthly include a Mark Sebastian interview noted options guru Larry McMillan; a guest article on the CBOE PutWrite Index (PUT) from Jason Ungar; and a thought-provoking piece from Jared Woodard on three volatility plays for the European sovereign debt crisis.

Mark Sebastian also interviews Ping Zhou, a co-author of Trading on Corporate Earnings News and pens the monthly Follow That Trade column, which focuses on position management for an OEX butterfly. Mark Wolfinger continues to be a prolific contributor, speaking out on options brokers are putting limits on customer trading on the last trading day of the expiration cycle, debating the role of options as speculative vehicles and offering some thoughts to the new options trader around risk, timing and money.

All in all I am delighted by the quality of our fourteenth issue, thrilled by the positive feedback I have received from readers, and excited by some of the articles that are currently taking shape for the coming months.

In keeping with tradition, I have reproduced a copy of the Table of Contents for the April issue below for those who may be interested in learning more about the magazine. Thanks to all who have already subscribed. For those who are interested in subscription information and additional details about the magazine, you can find all that and more at (the newly redesigned) http://www.expiringmonthly.com/.

Related posts:


[source: Expiring Monthly]

Disclosure(s): I am one of the founders and owners of Expiring Monthly

Thursday, December 16, 2010

VIX and Put to Call Ratio Snapshot

There has been a good deal of discussion about recent high put to call ratios across the blogosphere lately, including in my post yesterday, Rohan Clarke on the VIX and Put to Call Ratios.

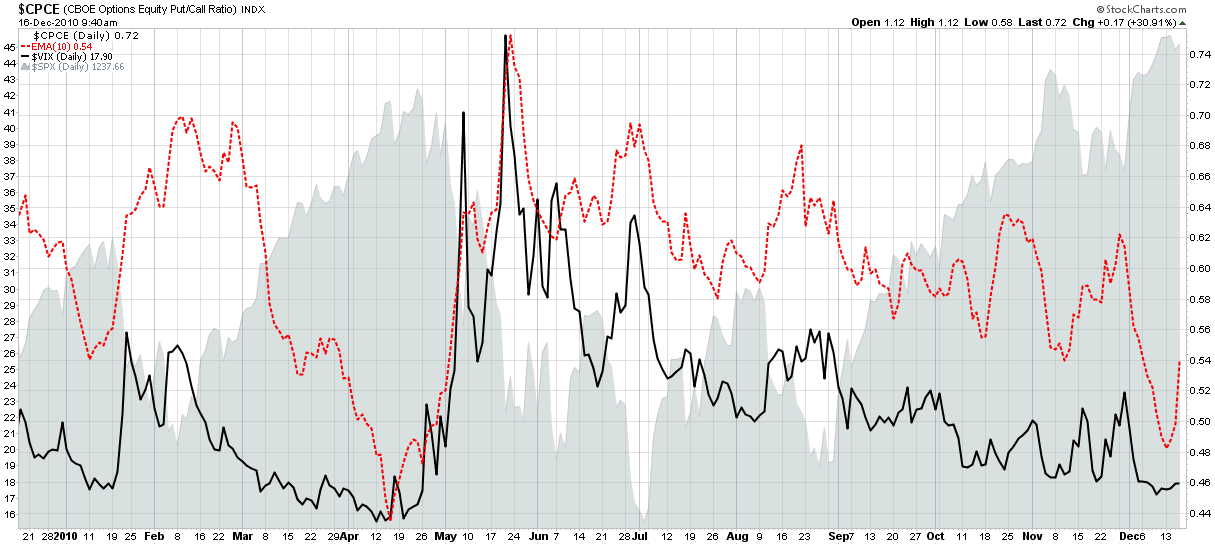
Given all the interest in the subject, I thought it would be an opportune time to share a simple chart of both that I often refer to. The graphic below captures the VIX (solid black line) and a 10-day exponential moving average of the CBOE equity put to call ratio (CPCE), which is show as a dotted red line.

Note that these two indicators are generally highly correlated. They both hit extreme lows in April, just before stocks began to correct – hence the concern about the current situation. The recent levels mark the second lowest readings of the year and may also portend a reversal. It is important to note, however, that the VIX can remain low for an extended period and also indicate nothing more than the fact that investors are comfortable accepting more risk. Also, the 10-day EMA of the CPCE is showing some signs that the recent extreme reading may self-correct before the bears are able to generate any significant traction. Finally, seasonal factors have a tendency to distort both indicators and often point to short-term holiday complacency rather than any sort of conviction that is expected to persist into 2011.

Related posts:


Disclosure(s):
none

[source: StockCharts.com]

Wednesday, December 15, 2010

Rohan Clarke on the VIX and Put to Call Ratios

With the favorable response I received on two recent posts, Edward Hugh and a Fistful of Euros and Market Psych Offers Language-Based Fear Index, I thought it might be a good time to highlight the work of another blogger who I believe deserves a wider audience and whose content nicely complements what readers can find here.

The blogger is Rohan Clarke and his blog is known as Data Diary and also carries the tag line, “An investor’s diary of economic data, corporate earnings and market sentiment.” While Clarke is based in Australia, his posts betray a broad range of geographical and intellectual interests. His latest missive, from earlier today, Betting on Zero, tackles inexpensive portfolio hedges, the VIX and put to call ratios.

For another insightful blog from Down Under, readers might also wish to check out billy blog, where I can guarantee that Bill Mitchell’s take on the global economy and economic issues in Australia will give you something to think about, whether you agree with his perspective or not.

Related posts:


Disclosure(s): none

Thursday, June 10, 2010

Interesting Chart Utilizing Put to Call Ratios and Volatility

I received quite a few excellent submissions for last week’s chart of the week contest and three subjects seemed to attract the most attention of chartists: put to call ratios; volatility and market breadth.

One chart that did a superb job with put to call ratios and volatility was submitted by Greg Neal. Actually, this was not a single chart, per se, but more of a series of charts which tell a compelling story. Whereas Greg submitted his chart over the weekend, I have used updated data through today and have cut Greg’s chart to two sections to make for easier reading below. In terms of key takeaways, I’ll let the chart and Greg’s annotations speak for themselves.

To find a live version of this chart that is continuously updated at StockCharts.com, click here. The full complement of Greg's public charts at StockCharts.com can be found here.

For more on related subjects, readers are encouraged to check out:


[source: StockCharts.com and Greg Neal]

Disclosure(s): none

Thursday, June 3, 2010

Yesterday’s Unusually Low ISEE Equity Number

Yesterday’s ISEE equities only closing value of 100 was sufficiently low that only once in the last year has there been a lower number.

Recall that the ISEE is a call to put ratio (or an inverted version of the more common put to call ratio) and that the equities only variant is probably the best way to tap into the options habits of the retail options trader.

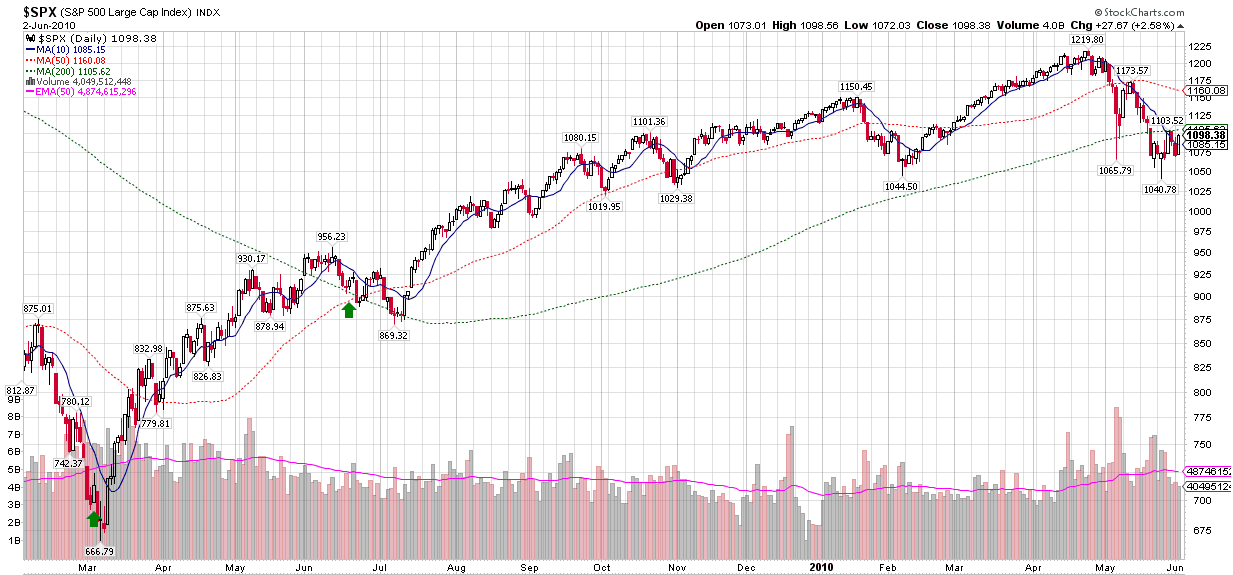
The chart below goes back to February 2009 to highlight with a green arrow the only two instances where the ISEE equities only index closed below 100. Note that both instance occurred just prior to an important bottom.

In the current context, the fact that the low ISEE equities only number appears just after what I think may be an important bottom raises two distinct possibilities:

  1. SPX 1040 may not turn out to be a bottom…OR

  2. SPX 1040 has a very good chance of holding as many investors are still firmly in the bear camp and have yet to come around to the long side

For more on the rationale behind the second alternative, which is the direction I am leaning in at the moment, Checking for Athiests (and some of the other posts linked below) may be of interest.

For more on related subjects, readers are encouraged to check out:


[source: StockCharts.com]

Disclosure(s): none

Sunday, April 4, 2010

Chart of the Week: CBOE Monthly Equity Put to Call Ratio Nears All-Time Low

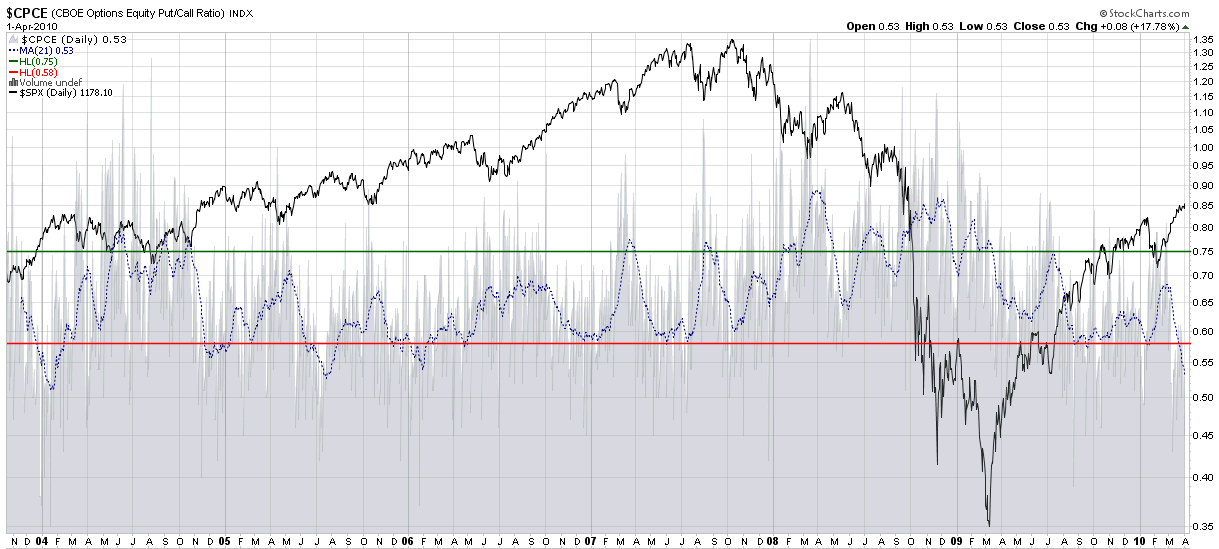
For trading purposes, I adhere fairly faithfully to a 10-day exponential moving average (EMA) of the CBOE equity put to call ratio (CPCE) as an appropriate smoothing factor to flag short to intermediate-term swing trading opportunities. There are occasions, however, when a longer-term moving average, like a 21-day simple moving average, is a better tool for identifying persistent extremes in put and call activity. This week is one of those occasions.

The chart of the week below looks at the full history of the CBOE equity put to call ratio, which dates from October 21, 2003, and applies a 21-day SMA (dotted blue line) to generate what I call the monthly equity put to call ratio. As the chart shows, readings below 0.60 have generally been a good time to take profits on long positions and/or initiate short positions. In fact, the current 0.53 level has only been seen on one prior instance, in January 2004. That period just happened to be exactly 13 months after the S&P 500 index had bottomed and started a strong bull rally. It also marked the beginning of a period in which stocks declined for ten months, before resuming a rally that would ultimately last until October 2007.

Of course there is nothing magical about low equity put to call ratios or rallies stalling after a 13 month rise, but bulls and bears alike should certainly take note of historical precedent.

For more on related subjects, readers are encouraged to check out:


[source: StockCharts.com]

Disclosure(s): none

Friday, March 19, 2010

Bears Emboldened By Low CBOE Equity Put to Call Ratio

Truthfully, I have not surveyed our ursine friends this morning, so I really have no idea if they are emboldened by the low CBOE equity put to call ratio (CPCE), but they should be.

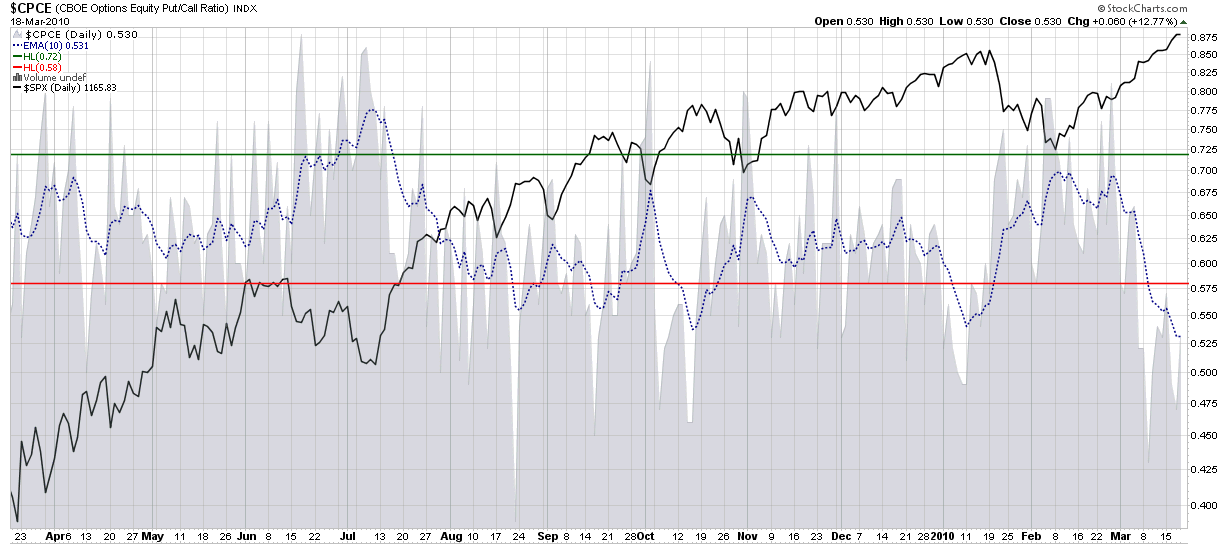
My preferred way of looking at the equity put to call ratio involves using an exponential 10 day moving average (EMA) as a smoothing factor. The 10 day EMA generates the dotted blue line in the chart below, which is now at a one month low, meaning that bullish investors are now likely to be speculating more aggressively with calls and are less concerned about managing risk with put protection. The chart shows that prior lows in August, September, October and January all preceded meaningful pullbacks. The history of put to call extremes suggests that another pullback is now in the offing.

Whether the bears are truly emboldened or even bother watching put to call ratios, this looks like an excellent time for longs to take some profits and go enjoy the vernal equinox.

For more on related subjects, readers are encouraged to check out:


[source: StockCharts]

Disclosure(s): none

Monday, March 1, 2010

Chart of the Week: Total Put to Call Ratio

Thanks to all who submitted charts for the chart of the week contest. After getting off to a slow start, I was somewhat skeptical that my idea of opening up the chart of the week to readers would turn out as I had hoped, but when over two dozen submissions landed in my inbox, I was humbled by the breadth and depth of the body of work they represented.

Alas there can only be one gold medal and this time around (I’m sure I will do this again), the winner is Amir from Las Vegas.

Amir’s chart shows how using the CBOE’s total put to call ratio (CPC) could have been helpful in identifying tops and bottoms in the S&P 500 index during the course of the last year. The areas highlighted in yellow show that the total put to call ratio (which summarizes put and call activity for individual equities plus indices) spiking to extreme levels during the June-July 2009 low and just last month dropping to the lowest level in several years. Clearly last month's signal was an excellent time to trade on the short side, at least for the short-term. Whether the extreme reading turns out to be a harbinger of a much steeper downturn remains to be seen.

My personal bias is to use the ISEE and CPCE (equity only) put to call data, but any one of these indicators is capable of generating excellent short-term to long-term market timing signals.

For his efforts, Amir also wins a one year free subscription to Expiring Monthly: The Option Traders Journal.

Thanks again to all those who submitted a very strong group of charts. As much fun as this was, I will be sure to periodically open up the Chart of the Week competition to readers going forward.

For more on related subjects, readers are encouraged to check out:


[source: StockCharts]

Disclosure(s): I am one of the founders and owners of Expiring Monthly


Thursday, December 10, 2009

Put to Call Ratio and the Probability of a Downturn

In the last day or two I have been fielded several questions about put to call ratios. It seems as if some investors are concerned that there is a stealth movement by sophisticated investors who are making substantial bets on a downward move with large purchases of puts. Invariably, these concerns have led to questions about what I see in the put to call ratios that will confirm or deny this.

To quickly recap, the CBOE publishes three put to call ratios. In my preferred charting site, StockCharts.com, these are known as:

  • $CPCE – the ticker for the equity put to call ratio
  • $CPCI – the ticker for the index put to call ticker
  • $CPC – the ticker for the total equity + index data

For reasons I have discussed in the past, I prefer the CPCE ratio and use this as a contrarian signal. The problem with the CPCI data is that institutional order flow for index options tends to come in large chunks that can create misleading short-term signals.

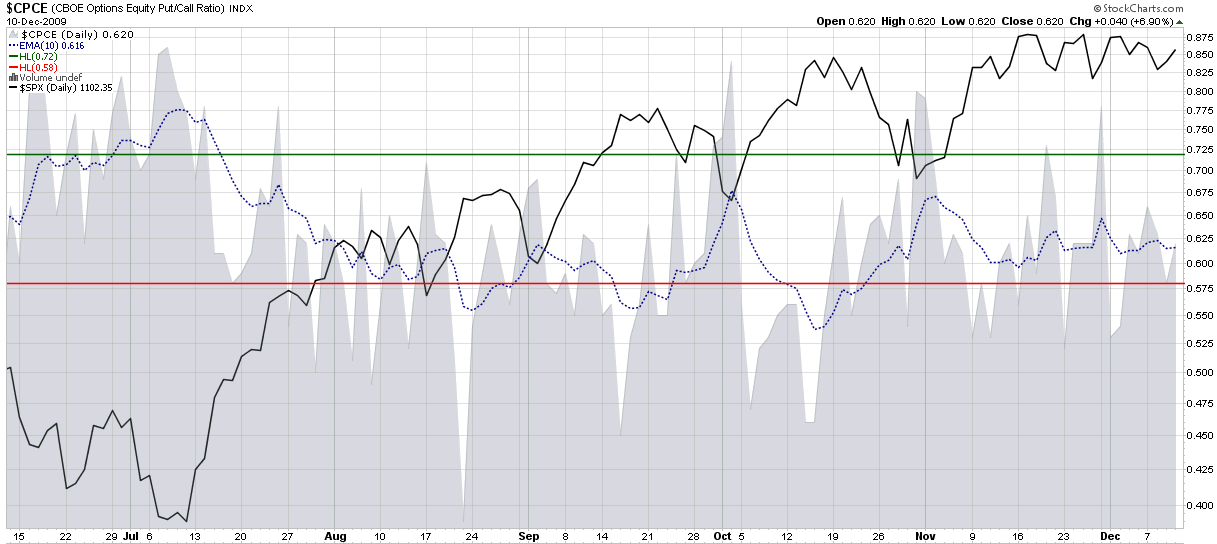
Recently, however, the CPCE, CPCI and CPC have all had very similar looking charts. I have reproduced the six month chart of CPCE below and it shows no unusual spikes in put activity relative to call activity. If anything, the 10 day EMA that I use to smooth the sometimes noisy CPCE data shows an almost eerie flat line for the past month or so, just as was the case when I last wrote about put to call ratios when in Equity Put to Call Ratio Not Pointing to a Correction when the Dubai debt crisis hit.

For more on related subjects, readers are encouraged to check out:

[source: StockCharts]

Disclosure: none

Tuesday, December 1, 2009

Equity Put to Call Ratio Not Pointing to Correction

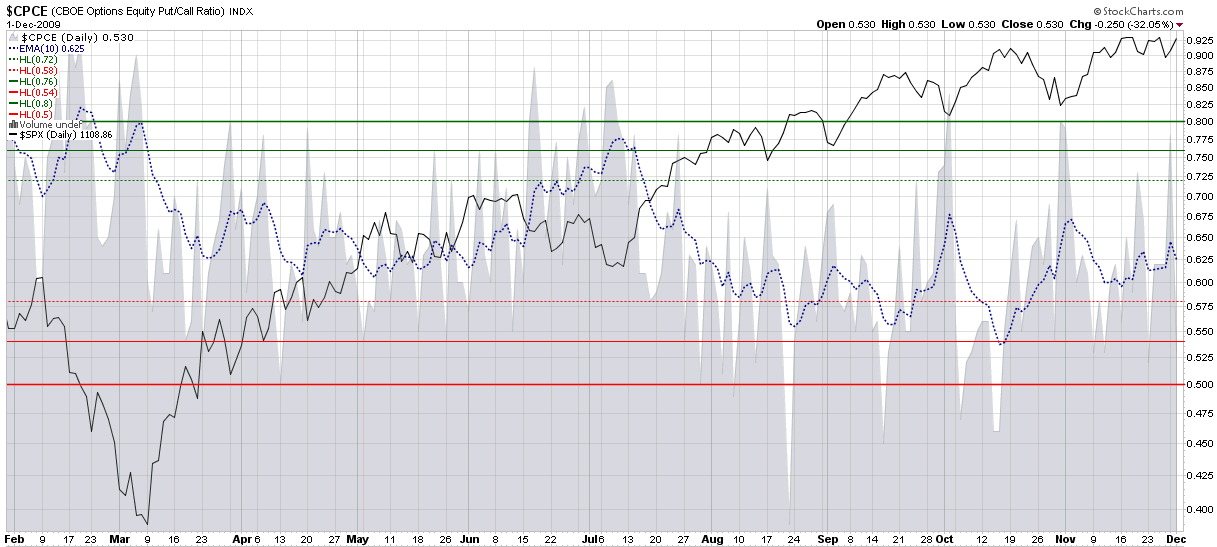
The recent Dubai debt crisis has spurred some investors to take some profits, protect their portfolios and contemplate both the acknowledged and hidden threats to the global economy. From Wednesday’s close to Friday’s intraday low, the S&P 500 index (SPX) only fell 17 points or 2.4%, hardly the type of selloff that typically strikes fear into the hearts of bulls. Fearing that further declines may be in the cards, however, investors snapped up puts aggressively, particularly on Monday, when the put buying pushed the CBOE equity put to call ratio (CPCE) to elevated levels.

In the chart below, I have reproduced the CPCE along with a 10 day exponential moving average (dotted blue line) to smooth the data over a two week period. The chart shows that since the July leg of the current bull market, significant pullbacks in the SPX (solid black line) have been preceded by drops in the 10-day EMA of the CPCE below the 0.58 level. In fact, for the last 5 ½ weeks, the 10-day EMA has never threatened the 0.58 area and at the current 0.625, the CPCE shows no signs of an impending correction.

For related posts on the CPCE, readers are encouraged to check out:

Disclosure: none

Wednesday, August 5, 2009

CBOE Equity Put to Call Ratio in Bear Territory

Lately I have been dipping my toe in the water on the short side – only to discover that something resembling an alligator seems intent on severing my leg at the ankle. Fortunately, I have managed to keep the stakes low to this point, but during today’s session I took a much more aggressive stance and bought a large quantity of puts.

In the process of reshaping my thinking, I found two indicators in particular to be persuasive. The first is the TRIN, where I am partial to using a 10 day EMA to smooth the data. Today it closed at a level seen only once since the beginning of 2006, just as the market put in a short-term top after a week and a half of bouncing off of the March lows.

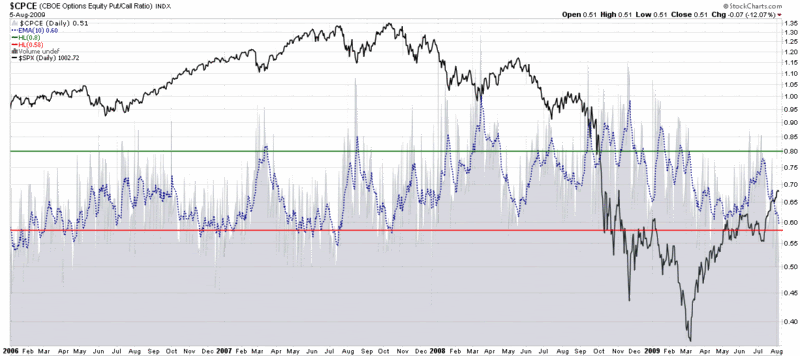
Even more persuasive is the CBOE equity put to call ratio (CPCE), where the 10 day EMA hit a low of 0.51 – a level which has not been seen since the October 2007 top. The chart below shows that a low CPCE warned of excessive optimism and the possibility of a top first in July 2007, when the SPX began to form the first half of a double top and again in October 2007, just as the market was topping for the second and final time.

For a different take on today’s CBOE equity put to call ratio, I can highly recommend 08/05/09 Market Recap: CPCE a little too low again, from Cobra’s Market View.

For some related VIX and More posts on the CPCE, try:


[source: StockCharts.com]

Thursday, March 26, 2009

Learning About Options (1)

I have recently received several requests from readers who are interested in learning about options from scratch and are looking for suggestions on how to proceed.

First, I should preface my answer by saying that even if you never intend to trade options, it will probably be worth your while to take some time to understand how they work. At the very least, it is helpful to appreciate what is in the black box that generates various options indicators, such as the VIX and the put to call ratios.

Second, I intend on making this the first installment in a series of posts that cover the subject of learning about options. Today I will talk about two excellent general resources on the web; in later posts I will examine educational resources offered by the exchanges and several options brokers, recommend some books, discuss additional web sites and conclude with an overview of some of my favorite options blogs.

The subject of options is broad and deep. Fortunately, there are some excellent free resources on the web that allow someone who is interested in options to learn at their own pace and in small chunks of ideas and information.

Two excellent all-purpose resources for options beginners are The Options Guide and The Options Industry Council (OIC). I mention these two sites first, because their sole intent is to inform and educate, unlike some commercial sites that provide some free information and then try to sell you something with a subtle or sometimes not-too-subtle approach.

The Options Guide has a variety of short articles in their Options Basics section, as well as a handy Options Strategies reference, where you can search for specific types of options strategies that meet your needs, or click on an excellent visual menu of profit and loss graphs to get detailed information about a wide variety of strategies. There are even separate sections for index options and VIX options.

The Options Industry Council takes a comprehensive approach to education. While The Options Guide is a great starter kit and reference tool, I consider the OIC’s web site to be the gold standard. It is a great place to browse and get lost. If you want articles, DVDs, books, brochures, etc. on just about any options topic you are interested in, there is a good chance you will find it in the OIC’s online vault. The OIC has embraced a multimedia approach and as a result, offers online classes, as well as seminars and webcasts. You can see what material is available as a video webcast and also download a wide variety of podcasts.

The OIC also has a broad range of tools that includes a several options calculators, an options strategy screener and a position simulator. If that is not enough, you can even do some virtual trading through the OIC.

Considering that everything offered by The Options Guide and just about everything (books are an exception) offered by the Options Industry Council is free, investors who are interested in learning about options should put these two web sites at the top of their list when embarking on a self-study approach to learning about options.

Thursday, March 19, 2009

Equity Put to Call Ratio Hits Ten Month Low

At the moment it is not at all difficult to find an indicator that believes stocks are overbought, at least on a short-term basis.

Of the many out there, I choose to highlight the CBOE’s equity ratio (CPCE), which, along with the ISEE, is one of my two favorite put to call ratios.

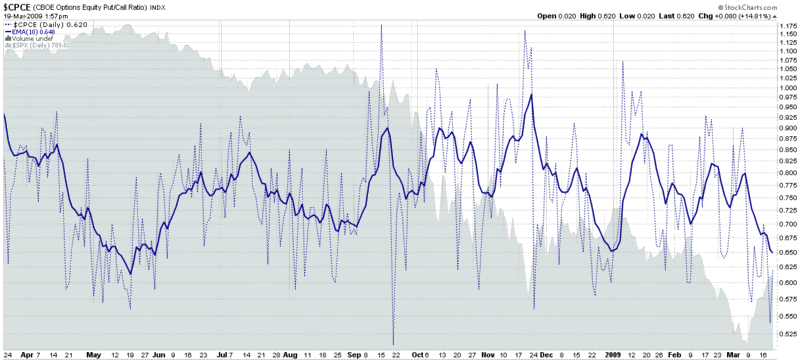
In the chart below, there is ample evidence of low levels of put activity compared to call activity at the CBOE. The daily data are represented by the dotted blue lines; I also use a 10 day exponential moving average to smooth the data over a two week period. I find that the 10 day EMA gives excellent contrarian signals. The most recent low in the 10 day EMA was at the beginning of the year and was a slightly early sell signal. The last time the 10 day EMA was this low was in May 2008, when it was an even more timely sell signal.

Longs, this looks like a good time to take some profits. Shorts, expiration week can sometimes delay trend reversals by a few days, but by Monday, the trend is likely to be back down.

[Edit: A commenter asked for an explanation of how to read this chart. For those who are interested, my response is in the comments section below.]

[source: StockCharts]

Monday, December 29, 2008

ISEE Equity Call to Put Ratio and the End of the Year

Further to this morning's ISEE Put to Call Ratio at Highest Level in 16 Weeks, the ISEE equities only call to put ratio finishes at 198 -- the highest close since May 16, 2008.

The last time this index had back to back closes this high was 12/28 and 12/31/07.

It is worth noting that the only other year for which the ISEE equity only data is broken out is 2006; that year also had some higher than normal readings on the last four trading days of the year.

Given the brief holiday track record of the ISEE, my suggestion is not to dismiss the ISEE equity only data out of hand, but to take it with a grain of salt.

ISEE Equity Call to Put Ratio at Highest Level in 16 Weeks

The ISEE equity call to put ratio hit a 16 week high of 189 on Friday, as investors showed a strong preference for calls over puts. Today that ratio is even higher, at 215 as of 11:30 a.m. ET.

Trading is light so far and extreme values in the ISEE have a tendency to revert to the mean (146) as the day wears on, but coming on the heels of Friday’s high number, I believe the ISEE numbers should bear watching throughout the day.

For the record, the last time the ISEE equity call to put ratio was over 200 in a single session was back in the middle of May. At that time, the markets were just in the process of putting in a post-March top.

[source: International Securities Exchange]

Friday, September 19, 2008

Puts Instead of Shorts?

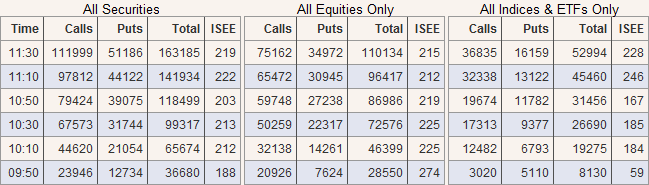
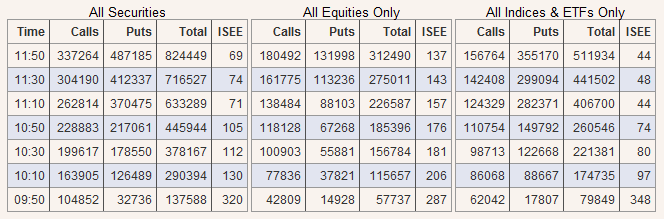
The table below shows call and put activity at the International Securities Exchange (ISE) during the first two hours of today’s trading. Keep in mind that the ISEE is a “call to put” ratio, not the “put to call” ratio reported by the CBOE.

As reflected in the table, right out of the gate there was a flood of calls for indices, ETFs, and individual stocks. Note that in the last hour or so, the activity has tilted heavily toward the put end of the spectrum, as the call to put ratios have dropped dramatically. It is difficult to differentiate between hedging and speculation in these transactions, but now that options spreads seem to be tightening and implied volatility is dropping sharply, I suspect those looking to get short financials and any other part of the market may be leaning toward puts.

It will be interesting to see how the options market is affected by the new shorting regulations.

[source: International Securities Exchange]

Wednesday, August 20, 2008

Put to Call Ratios and Volatility Predictions

Michael at MarketSci is out with another provocative post this morning. Focusing on the CBOE total put to call ratio (CPC) data history, he uncovers an interesting relationship between an elevated put to call ratio relative to the 50 day moving average and next day volatility in the S&P 500 index. In The Put-to-Call Ratio at Extreme Values, Michael draws the following conclusions:

“High and low put-to-call ratios…have done a pretty good job at predicting next-day volatility… High PCR levels indicate a bearish sentiment (high level of puts relative to calls purchased) and have been followed by a significant increase in volatility (+29.7%). Low PCR levels indicate a bullish sentiment and have been followed by a significant decrease in volatility (-17.3%).”

Looking at over a dozen years of data, MarketSci also concludes that the pattern has persisted over time but has been less pronounced over the course of the last two years (see chart for details).

I will leave the reader to ponder the implications of having a one day edge in predicting SPX volatility, but given how active SPX and SPY options are, there ought to be quite a few different ways to profit from this type of insight.

DISCLAIMER: "VIX®" is a trademark of Chicago Board Options Exchange, Incorporated. Chicago Board Options Exchange, Incorporated is not affiliated with this website or this website's owner's or operators. CBOE assumes no responsibility for the accuracy or completeness or any other aspect of any content posted on this website by its operator or any third party. All content on this site is provided for informational and entertainment purposes only and is not intended as advice to buy or sell any securities. Stocks are difficult to trade; options are even harder. When it comes to VIX derivatives, don't fall into the trap of thinking that just because you can ride a horse, you can ride an alligator. Please do your own homework and accept full responsibility for any investment decisions you make. No content on this site can be used for commercial purposes without the prior written permission of the author. Copyright © 2007-2023 Bill Luby. All rights reserved.
 
Web Analytics