Showing posts with label educational. Show all posts

Monday, March 11, 2013

The VIX, Interpolation and the Roll

Almost every month, some subset of the class of investors and journalists expresses extreme alarm when the VIX magically plummets on the Monday before the standard monthly options expiration that occurs on the third Friday of every month.

I have written about this before, notably in:

The executive summary is that for most of its monthly cycle the VIX is an interpolated value derived from the first and second month S&P 500 index (SPX) options contracts. In an interpolation, one is presented with two values and attempts to derive a value that is in between those two, typically by drawing a straight line between the values and attempting to determine where on that line the desired value should fall. When one wants to derive a 30-day VIX and the SPX options contracts are, say, 17 and 45 days out, then a simple linear interpolation accomplishes that goal – and that is what the VIX calculation methodology does.

Things become more interesting due to the fact that the CBOE mandates that the near-term month used in the VIX calculation have at least one week to expiration. So what happens is that on Friday the VIX used the March and April expirations in the VIX calculation; today April becomes the near-term month and May becomes the far-term month. With the April expiration falling on April 19th and the May expiration on May 17th, this means the two months used in the VIX calculation have 39 and 67 days until expiration, respectively. So how does the CBOE arrive at a 30-day VIX value? Well, they still use the near-term VIX calculation (VIN) and far-term VIX calculation (VIF), but they accomplish this task by using a negative coefficient for the weighting of the far-term value, in addition to a coefficient that is greater than 100% for the near-term value.

There is nothing wrong with this approach and it delivers reasonable numbers when the near-term and far-term VIX have roughly the same value, but when there is steep contango in the SPX options term structure, which has frequently been the case over the course of the past two years, the resulting VIX calculation can be dramatically lower than both VIN and VIF. Right now, for instance, the VIX is at 11.71, while VIN is 12.48 and VIF is 13.50.

My suggestion would be not to focus too much attention on the VIX while the calculation uses a negative coefficient for VIF, which will be for the remainder of this week. Instead, those looking for a better gauge of what the VIX is should probably focus on VIN for the next four days.

Alternatively, one can refer to SPX implied volatility calculations provided by their options data provider, such as are incorporated into the SPX skew graphic below, courtesy of LivevolPro.

Related posts:

[source(s): LivevolPro.com]

Disclosure(s): Livevol and the CBOE are advertisers on VIX and More

Friday, December 21, 2012

Volatility During Crises

[The following first appeared in the August 2011 edition of Expiring Monthly: The Option Traders Journal. I thought I would share it because it might help some readers put the current fiscal cliff crisis in historical context.]

The events of the last three weeks are a reminder that financial crises and stock market volatility can appear almost instantaneously and mushroom out of control before some investors even have a chance to ask what is happening. A case in point: on August 3rd investors were breathing a sigh of relief after the United States had finalized an agreement to raise the debt ceiling; at that time, the VIX stood at 23.38, reflecting a relative sense of calm, yet just three days later, the VIX jumped to 48.00 as two new crises displaced the debt ceiling issue.

Spanning the globe from Northern Africa, Japan, Europe and the United States, 2011 has seen no shortage of crises in the first eight months of the year. Given this pervasive crisis atmosphere, it is reasonable for investors to consider how much volatility they should anticipate during a crisis. In this article I will attempt to put crises and volatility in some historical perspective and address a variety of factors that affect the magnitude and duration of volatility during a crisis, drawing upon fundamental, technical and psychological causes.

Volatility in the Twentieth Century

Every generation likes to think that the issues of their time are more daunting and more complex than those faced by prior generations. No doubt investors fall prey to this kind of thinking as well. With a highly interconnected global economy, a news cycle that races around the globe at the speed of light and high-frequency and algorithmic trading systems that have transferred the task of trading from humans to machines, there is a lot to be said for the current batch of concerns. Looking at just the first half of the twentieth century, however, investors had to cope with the Great Depression, two world wars and the dawn of the nuclear age.

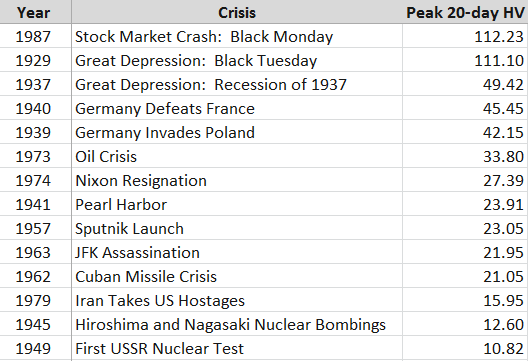
Given that the CBOE Volatility Index (VIX) was not launched until 1993, any evaluation of the volatility component of various crises prior to the VIX must rely on measures of historical volatility (HV) rather than implied volatility. As the S&P 500 index on which the VIX is based only dates back to 1957, I have elected to use historical data for the Dow Jones Industrial Average dating back to before the Great Depression. In Figure 1 below, I have collected peak 20-day historical volatility readings for selected crises from 1929 to the present.

Before studying the table, readers may wish to perform a quick exercise by making a mental list of some of the events of the 20th century that constituted immediate or deferred threats to the United States, then compare the magnitude of that threat with the peak historical volatility observed in the Dow Jones Industrial Average. If you are like most historians and investors, after looking at the data you will probably conclude that the magnitude of the crisis and the magnitude of the stock market volatility have at best a very weak correlation.
[source(s): Yahoo]

Any ranking of crises in which the Cuban Missile Crisis and the attack on Pearl Harbor rank in the lower half of the list is certain to raise some eyebrows. Frankly I would have been surprised if even one of these events failed to trigger a historical volatility reading of 25, but seeing that was the case for half the crises on this list certainly provides a fair amount of food for thought.

Volatility in the VIX Era

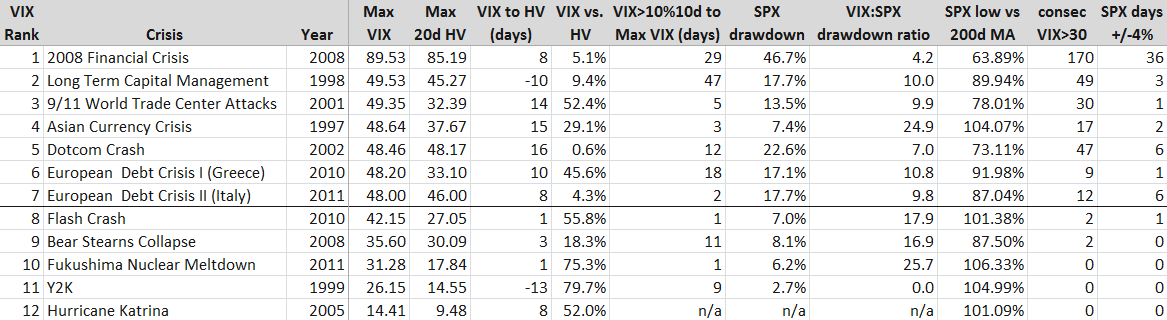
With the launch of the VIX it became possible not only to evaluate historical volatility, but implied volatility as well. With only 18 years of data to draw upon, there is a limited universe of crises to examine, so in the table in Figure 2 below, I have highlighted the seven crises in the VIX era in which intraday volatility has reached at least 48. Additionally, I have included five other crises with smaller VIX spikes for comparison purposes.
[source(s): CBOE, Yahoo]

[Some brief explanatory notes will probably make the data easier to interpret. First, the crises are ranked by maximum VIX value, with the maximum historical volatility in an adjacent column for an easy comparison. The column immediately to the right of the MAX HV data captures the number of days from the peak VIX reading to the maximum 20-day HV reading, with negative numbers (LTCM and Y2K) indicating that HV peaked before the VIX did. The VIX vs. HV column calculates the amount in percentage terms that the peak VIX exceeded the peak HV. The VIX>10%10d… column reflects how many days transpired from the first VIX close above its 10-day moving average to the peak VIX reading. The SPX Drawdown column calculates the maximum peak to trough drawdown in the S&P 500 index during the crisis period, not from any pre-crisis peak. The VIX:SPX drawdown ratio calculates the percentage change in the VIX from the SPX crisis high to the SPX crisis low relative the percentage change in the SPX during the same period (of course these are not necessarily the VIX highs and lows during the period.) The SPX low relative to the 200-day moving average is the maximum amount the SPX fell below its 200-day moving average during the crisis. Finally, the last two columns capture the number of consecutive days the VIX closed at or above 30 during the crisis and the number of days the SPX closed at least 4% above or below the previous day’s close during the crisis.]

Looking at the VIX era numbers, it is not surprising that the financial crisis of 2008 dominates in many of the categories. Reading across the rows, one can get an interesting cross-section of each crisis in terms of various volatility metrics, but I think some of the more interesting analysis comes from examining the columns, where we can learn something not just about the nature of the crises, but also about volatility as well. One important caveat is that the limited number of data points does not allow for this to be a statistically valid sample, but that does not preclude the possibility of drawing some potentially valuable and actionable conclusions.

Looking at the peak VIX reading relative to the peak HV reading I note that in all instances the VIX was ultimately higher than the maximum 20-day historical volatility reading. In the five lesser crises, the VIX was generally 50-80% higher than peak HV. In the seven major crises, not surprisingly HV did approach the VIX in several instances, but in the case of the 9/11 attack and the 2010 European sovereign debt crisis the VIX readings grossly overestimated future realized volatility.

One of my hypotheses about the time between the first VIX close above its 10-day moving average and the ultimate maximum VIX reading was that the longer the period between the initial VIX breakout and the maximum VIX, the higher the VIX spike would be. In this case the Long-Term Capital Management (LTCM) and 2008 crises support the hypothesis, but the data is spotty elsewhere. The current European debt crisis, Asian Currency Crisis of 1997 and 9/11 attack all reflect a very rapid escalation of the VIX to its crisis high. In the case of the May 2010 ‘Flash Crash’ and the Fukushima Nuclear Meltdown, the maximum VIX reading happened just one day after the initial VIX breakout. As many traders use the level of the VIX relative to its 10-day moving averages as a trading trigger, the data in this column could be of assistance to those looking to fine-tune entries or better understand the time component of the risk management equation.

Turing to the SPX drawdown data, the Asian Currency Crisis stands out as one instance where the VIX spike seems in retrospect to be out of proportion to the SPX peak to trough drawdown during the crisis. On the other side of the ledger, the drawdown during the Dotcom Crash appears to be consistent with a much higher VIX reading. Here the fact that it took some 2 ½ years for stocks to find a bottom meant that when the market finally bottomed, investors were somewhat desensitized and some of the fear and panic had already left the market, which is similar to what happened at the time of the March 2009 bottom. Note that the median VIX:SPX drawdown ratio for all twelve crises is 10.0, which is about 2 ½ times the movement in the VIX that one would expect during more normal market conditions.

The data for the SPX Low vs. 200-day Moving Average is similar to that of the SPX drawdown. For the most part, any drawdown of 10% or more is likely to take the index below its 200-day moving average. In the seven major crises profiled above, all but the Asian Currency Crisis dragged the index below its 200-day moving average; on the other hand, in all but one of the lesser crises the SPX never dropped below its 200-day moving average. Based on this data at least, one might be inclined to include the 200-day moving average breach as one aspect which helps to differentiate between major and minor crises.

As I see it, the last two columns – consecutive days of VIX closes over 30 and number of days in which the SPX has a 4% move – are central to the essence of the crisis volatility equation. Since the dawn of the VIX, the SPX has experienced a 2% move in about 80% of its calendar years, the VIX has spiked over 30 about 60% of the years, and the SPX has seen at least one 4% move in about 40% of those years. Those 4% moves are rare enough so that they almost always occur in the context of some sort of major crisis. In fact, one could argue that a 4% move in the SPX is a necessary condition for a financial crisis and/or a significant volatility event.

Fundamental, Technical and Psychological Factors in Crisis Volatility

Crises have many different causes. In the pre-VIX era, we saw a mix of geopolitical crises and stock market crashes, where the driving forces were largely fundamental ones. During the VIX era, I would argue that technical and psychological factors become increasingly important. The rise of quantitative trading has given birth to algorithmic trading, high-frequency trading and related approaches which place more emphasis on technical data than fundamental data. At the same time, retail investing has been revolutionized by a new class of online traders and the concomitant explosion in self-directed traders. This increased activity at the retail level has added a new layer of psychology to the market.

In terms of fundamental factors, one could easily argue that the top nine VIX spikes from the list of VIX era crises all arise from just two meta-crises, whose causes and imperfect resolution has created an interconnectedness in which subsequent crises are to a large extent just downstream manifestations of the ripple effect of the original crisis.

The first example of the meta-crisis effect was the 1997 Asian Currency Crisis, which migrated to Russia in the form of the 1998 Russian Ruble Crisis, which played a major role in the collapse of Long-Term Capital Management.

The second example of meta-crisis ripples begins with the Dotcom Crash and the efforts of Alan Greenspan to stimulate the economy with ultra-low interest rates. From here it is easy to draw a direct line of causation to the housing bubble, the collapse of Bear Stearns, the 2008 Financial Crisis and the recurring European Sovereign Debt Crisis. In each case, the remedial action for one crisis helped to sow the seeds for the next crisis.

In addition to the fundamental interconnectedness of these recent crises, it is also worth noting that the lower volatility crises were largely point or one-time-only events. There was, for instance, only one Hurricane Katrina, one turn of the clock for Y2K and one earthquake plus tsunami in Japan. As a result, the volatility associated with these events was compressed in time and accordingly the contagion potential was limited. By contrast, the major volatility events are more accurately thought of as systemic threats that ebbed and flowed over the course of an extended period, typically with multiple volatility spikes. In the same vein, the attempted resolution of these events generally included a complex government policy cocktail, whose effects were gradual and of largely indeterminate effectiveness.

Apart from the fundamental thread running through these crises, I also believe there is a psychological thread that sometimes spans multiple crises. Specifically, I am referring to the shadow that one crisis casts on future crises that follow it closely in time. I call this phenomenon ‘disaster imprinting’ and psychologists characterize something similar as availability bias. Simply stated, disaster imprinting refers to a phenomenon in which the threats of financial and psychological disaster are so severe that they leave a permanent or semi-permanent scar in one’s psyche. Another way to describe disaster imprinting might be to liken it to a low-level financial post-traumatic stress disorder. Following the 2008 Financial Crisis, most investors were prone to overestimating future risk, which is why the VIX was consistently much higher than realized volatility in 2009 and 2010.

While it is impossible to prove, my sense is that if the events of 2008 were not imprinted in the minds of investors, the current crisis atmosphere might be characterized by a much lower degree of volatility and anxiety.

Conclusion

As this goes to press, the current volatility storm is drawing energy from concerns about the European Sovereign Debt Crisis as well as fears of a slowdown in global economic activity. The rise in volatility has coincided with a swift and violent selloff in stocks that has seen six days in which the S&P 500 index has moved at least 4% either up or down – a rate that is unprecedented outside of the 2008 Financial Crisis.

Ultimately, the severity of a volatility storm is a function of both the magnitude and the duration of the crisis, as well as the risk of contagion to other geographies, sectors and institutions. Act I of the European Sovereign Debt Crisis, in which Greece played the starring role, can trace its origins back to December 2009. In the intervening period, it has spread across Europe and has sent shockwaves across the globe.

By historical standards the volatility aspect of the current crisis is more severe than at any time during World War II, the Cuban Missile Crisis and just about any crisis other than the Great Depression, Black Monday of 1987 and the 2008 Financial Crisis.

In the data and commentary above, I have attempted to establish some historical context for volatility during various crises extending back to 1929 and in the process give investors some metrics for evaluating current and future volatility spikes. In addition, it is my hope that concepts such as meta-crises and disaster imprinting can help to bolster the interpretive framework for investors who are seeking a deeper understanding of volatility storms and the crises from which they arise.

Related posts:

Disclosure(s): none

Monday, August 13, 2012

How Can the VIX Be 14 and Lower than VIN and VIF?

Many novice and advanced VIX followers are scratching their heads today, wondering why the VIX is down more than 5%, hovering around the 14.00 level, when the SPX is down 0.4% and all the major market averages are deeply in the red. More serious students of the VIX will also note that this drop in the VIX comes on a Monday, when the typical VIX “calendar reversion” is generally responsible for about a 1% pop in the volatility index.

The answer to most of these questions lies in yet another idiosyncrasy of the VIX: the roll. Quoting directly from the source, the CBOE Volatility Index (VIX) White Paper, we find these two important nuggets from pages 4 and 9, which I have presented here sequentially for easier consumption:

“The components of VIX are near- and next-term put and call options, usually in the first and second SPX contract months. ‘Near-term options must have at least one week to expiration; a requirement intended to minimize pricing anomalies that might occur close to expiration. When the near-term options have less than a week to expiration, VIX ‘rolls’ to the second and third SPX contract months. For example, on the second Friday in June, VIX would be calculated using SPX options expiring in June and July. On the following Monday, July would replace June as the ‘near-term’ and August would replace July as the ‘next-term.’”

“At the time of the VIX ‘roll,’ both the near-term and next-term options have more than 30 days to expiration. The same formula is used to calculate the 30-day weighted average, but the result is an extrapolation of σ2 1 and σ2 2; i.e., the sum of the weights is still 1, but the near-term weight is greater than 1 and the next-term weight is negative (e.g., 1.25 and – 0.25).” [Emphasis added]

When I first posted about VIN and VIF back in March 2011 (VIN, VIF and an Obsolete VIX), I was stunned to learn how few investors, including savvy and experienced VIX fanatics, were completely unaware of these indices. At the time, the CBOE did not even refer to VIN and VIF on their web site, but they have since added a splash page for these two indices, along with the following brief comments:

CBOE maintains indexes that track the level of implied volatility from single SPX maturities.

Ticker VIN (VINX on Bloomberg) – nearer term SPX expiration used in VIX calculation

Ticker VIF – farther term SPX expiration used in VIX calculation

Getting back to the roll, the SPX options contract months roll forward one month today, so that the nearer-term month (VIN) moves from August to September and the farther-term month (VIF) moves from September to October. More importantly, per the bolded text from the VIX white paper above, today’s VIX calculations sum more than 100% of the VIN and a negative number for VIF. This is the reason why the VIX is less than the two components used in its calculation: VIN and VIF.  In summary, the bigger the difference between the VIN and the VIF (and right now that difference is a very large 9.4%), the more likely the VIX is going to be substantially depressed following the VIX roll.  Also, as we move toward the expiration of VIX options on August 22nd, the distortions from the negative VIF component used in the VIX calculations should gradually diminish, as the VIF weighting moves toward zero and then becomes a positive number.

For those who are interested in delving into the nuances of the VIX calculations, the CBOE’s VIX White Paper is the best place to start; the links below might also provide additional insight.

Related posts:

Disclosure(s): long VIX at time of writing

Thursday, January 19, 2012

VIX Views

Yesterday, I learned that the people at S&P 500 Indices and the CBOE have collaborated on a new blog with the name of VIX Views.

The best news about VIX Views is the high quality of contributors and content. The most recent posts, all of which have appeared since January 7, include the following:

  • Matt Moran (CBOE) – Why Are There Different Prices for VIX Spot and VIX Futures?
  • Matt Moran (CBOE) – VXEEM Futures: 1,106 Trading Volume on the 3rd Day of Trading
  • Siddhartha Oberoi (S&P Indices) – VIX ETPs Demystified: December 2011
  • Frank Luo (S&P Indices) – An Introduction to VIX
  • Berlinda Lu (S&P Indices) – Diversification Properties of VIX Futures Indices
  • Berlinda Lu (S&P Indices) – Volatility Benchmarks in Europe

I encourage readers to take advantage of this resource and the valuable information stored in the archives, which date back to November 2011.

In thinking about VIX and More as a repository of information on the VIX, volatility and related subjects, I am reminded that I have tagged quite a few posts with the educational label. While I consider almost every post here to be educational, those with the educational label stand out above the crowd, particularly for those who may be relatively new to the VIX and/or are in search of material which does not assume a great deal of pre-existing knowledge.

Some of these posts with the educational label have been included in the links below. I have also included several posts in which I have highlighted resources on the VIX and volatility that I thought readers should be aware of.

Going forward, I have some thoughts about how to bring together all the material on this site in a manner that is easier to browse, but for now at least, Navigating VIX and More by the Labels will have to suffice.

Related posts:

Disclosure(s): the CBOE and Livevol are advertisers on VIX and More; I am one of the founders and owners of Expiring Monthly

Thursday, November 11, 2010

The Evolving VIX ETN Landscape

As of today, only four VIX exchange-traded products (ETNs and ETFs) are available for trading. All of these have been Barclays products and three of the four carry the iPath brand name. In descending order of volume, the VIX-based ETNs currently being traded are:

  • iPath S&P 500 VIX Short-Term Futures ETN (VXX)
  • iPath S&P 500 VIX Mid-Term Futures ETN (VXZ)
  • iPath Inverse S&P 500 VIX Short-Term Futures ETN (XXV)
  • Barclays ETN+ S&P VEQTOR ETN (VQT)
Five other companies (ProShares, Direxion, Citigroup, Jefferies and Bank of America) have VIX-based ETNs and ETFs (in the case of ProShares) in registration or have made announcements about forthcoming products, but I am unaware of any target launch dates.  In order to simplify matters a little, henceforth I will start to refer to these products as exchange-traded products or ETPs.

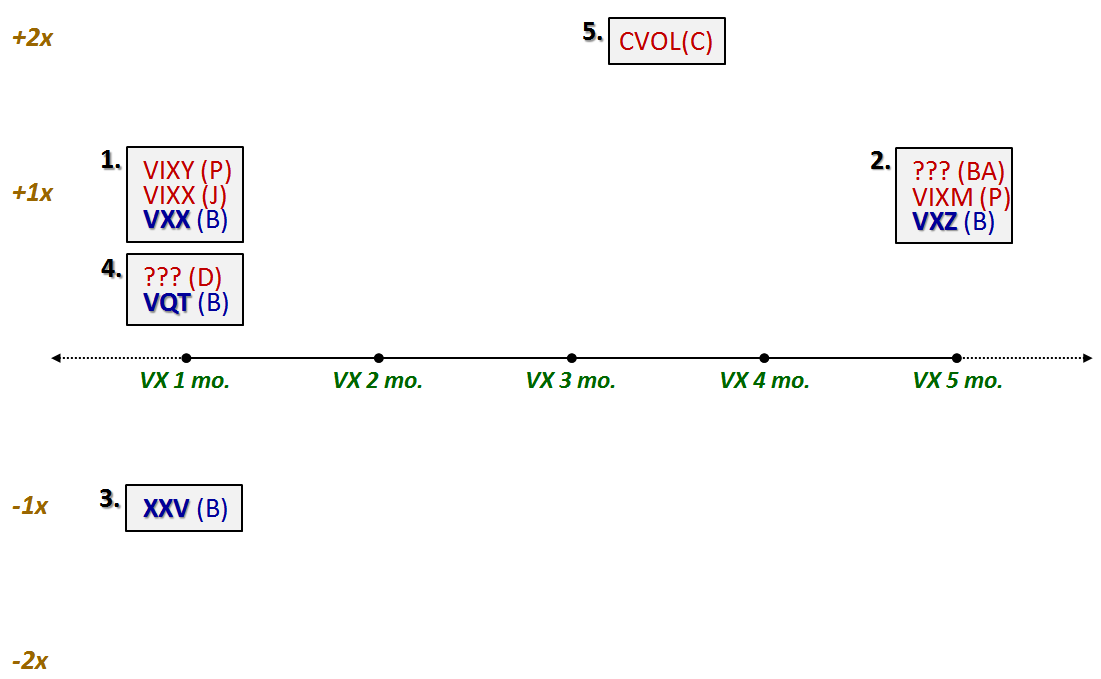
In order to attempt to simplify and catalog the growing universe of available and announced VIX-based ETPs, I have assembled the chart below. The chart uses the y-axis to plot the leverage used (all are standard +1x ETPs, with the exception of the +2x CVOL and the sole inverse product, the -1x XXV) and the x-axis to plot the target maturity. VX 1 mo. is short for VIX futures with a constant maturity of one month, etc.

I have identified each ETP by its ticker (I do not yet have tickers for the Direxion or Bank of America products) and have coded these with a one or two letter suffix to identify the issuer (P for ProShares, D for Direxion, C for Citigroup, J for Jefferies and BA for Bank of America.) ETPs that are currently traded are in bold blue; ETPs that have not yet been launched are in red font.

The final piece of information involves grouping the ETPs into five clusters which represent the five approaches currently being used for VIX-based ETPs. For all intents and purposes, the ETPs in each cluster are (or appear to be, at this juncture) equivalent in construction and should behave in a similar manner. Group #1 for instance, has been the dominant theme in the volatility ETP space to date. The focus here is on VIX futures with a constant maturity of 30 days. VXX was the first to market, but competitive offerings from Jefferies and ProShares are on the way. Group #2 uses a similar approach, but with a 5-month target maturity. Group #3 is the inverse of Group #1.

Group #4 represents what I consider to be a second generation of products, with a dynamic allocation of 2.5% to 40% (see Barclays VEQTOR ETN Begins Trading for details), which is why the group is shown here as having less than +1x leverage.

The newest VIX ETP approach comes from Citigroup, where their CVOL product not only targets a new portion of the VIX futures term structure (3-4 months), but adds a +2x leverage component and also includes a “variable weighted short position in the S&P 500 Total Return Index” as well.

Things continue to get more and more interesting in the VIX ETP space. I look forward to the launch of some of these newer products and to seeing how they perform.

It should go without saying that as the VIX ETP landscape continues to evolve, I will do my best to attempt to map it in a meaningful manner.

Related posts:


Disclosure(s): none

Monday, October 25, 2010

VIX and VXX: In the Beginning…

Last week in What Do You Want to Know About VXX? I asked readers for their thoughts on what to cover in what I anticipated would be a big kitchen sink post about the iPath S&P 500 VIX Short-Term Futures ETN (VXX.)

After reflecting upon the many thoughtful emails and comments I received, I realized that the scope of interest in and confusion about this product is sufficient to warrant a multi-part series. The more I thought about the broad spectrum of knowledge and lack of knowledge pertaining to VXX, the more I realized that it makes sense to start at the beginning to give investors of all experience levels as well as recent additions to the blog readership an opportunity to approach the subject with the same foundation of knowledge and context.

So…for the first time since launching this blog four years ago, I will start with the most basic question of all: what is the VIX?

The VIX, whose formal name is the CBOE Volatility Index, is a calculation made by the CBOE of market expectations of 30-day implied volatility for S&P 500 index options. The CBOE calculates and disseminates VIX values every 15 seconds during the index trading day, which runs from 9:30 a.m. to 4:15 p.m. Eastern Time. In other words, the VIX is calculated during the normal NYSE trading day, plus 15 minutes after the close of normal trading.

With any luck, the graphic I created below simplifies the explanation of how the VIX is calculated.

The intent of the graphic is to demonstrate that out of the universe of all traded stocks, the VIX is concerned only with the stocks which comprise the S&P 500 index, also known by its ticker symbol, SPX. The S&P 500 index is maintained by an index committee (more details here), with periodic changes to the index constituents. The VIX is calculated using near term SPX options (typically the first two months) and a wide range of strikes (see the CBOE’s VIX white paper for details on the calculation methodology) and essentially reflects the implied volatility of those options used in the calculations.

The result is the market’s estimate of implied volatility for the S&P 500 index for the next 30 days, stated in annualized terms. See Rule of 16 and VIX of 40 for a better sense of how standard deviations are factored into the VIX and how to interpret the VIX in terms of standard deviations.

In the next installment, I will make the jump from the VIX to VXX, but in order to do so, we will have to become familiar with VIX futures as well.

For those who are interested in some additional reading, the links below are an excellent place to start, as are all the VIX and More posts tagged with the “educational” label.

Related posts:


Disclosure(s): short VXX at time of writing

Friday, October 8, 2010

Robert Engle’s FT Lectures on Volatility

I am still not sure why Brenda Jubin’s Reading the Markets, remains criminally undiscovered, but for those who do not make visiting that blog a daily habit, I feel it my duty to draw attention to some of the excellent work she has been doing lately.

As far as I can tell, Brenda spends part of her free time reading every book ever written about investing and various tangential subjects. Even if this is only a slight exaggeration, her comprehensive review of the investment literature forms a sort of contemporaneous intellectual history of the markets – and for this reason makes it onto my daily reading list.

From time to time, the narrative at Reading the Markets veers in the direction of options and volatility. A particularly valuable contribution has been Brenda’s posting of her notes and graphics on a five-part lecture series given by Robert Engle in July 2007. One post is devoted to each lecture, with the links to her posts below:

Reading the Markets – Notes and Graphics:

Part of the motivation for posting the notes and the graphics is that while the FT Business School – NYU Stern School of Business splash page has captured the links to transcripts of each of the five addresses, the video links on that page are not functional.

With a little sleuthing, however, I was able to find the video links to each of the five lectures and below I have captured the video and transcript in what I hope is a more useful format:

FT Business School – NYU Stern School (original content):
For anyone seeking the key takeaways from this series, I would jump right to Brenda’s comments and graphics. For all the details, the FT-Stern content above is the place to go.

Also worth checking out is the NYU Stern Volatility Institute and its Volatility Laboratory.

Related posts:

Disclosure(s): none
Tuesday, September 21, 2010

The Education of a Trader

[The following first appeared in the May 2010 edition of Expiring Monthly: The Option Traders Journal, on the back page of the magazine, where the authors are encouraged to be tangential and irreverent. I thought I would share it because of the positive feedback I received from a number of readers and because I think this piece dovetails nicely with the collection of links below.]

Do you remember from your school days those students who when confronted with a complex issue, would acquire a look on their faces somewhere between consternation and dread, immediately thrust a waving hand up into the air and blurt out in a worried voice, “Do we have to know this for the test?” I can be fairly sure that none of these people ended up as successful traders.

One only has to look at the history of hiring patterns at Wall Street firms to get a sense of the evolution of thinking about how to develop a successful trader. For many years, the model for aspiring traders was considered to be a genteel Ivy League education. Over time, Wall Street firms began to favor graduates with a more humble socioeconomic pedigree who were considered hungry, hard working and highly motivated to prove something to the world. In more recent years, we have seen Wall Street seek out physicists and those with exceptional quantitative skills. Lately, a desire for poker skills has also come into play.

As I see it, all traders are ultimately self-taught. There are no required classes, readings, homework assignments or even a syllabus with recommendations. Tests are administered on a daily basis, frequently with multiple tests on the same day. Worst of all, everyone is graded on an unfavorable curve in which there are more Fs than As.

Against this backdrop, education counts, but skill and experience count even more. An insatiable curiosity helps, as does a willingness to explore unfamiliar territory. Great trades, insights and strategies present themselves in somewhat random fashion and, as Louis Pasteur observed, “Chance favors the prepared mind.”

But what kind of preparation is ideal? Malcolm Gladwell asserts that 10,000 hours of experience is a prerequisite for greatness in almost any field. In a normal career, that level of commitment usually translates to five years, but on Wall Street, 10,000 hours of experience can be crammed into 3–4 years. Of course, all hours are not created equal. A trader’s capacity to distinguish between random events and meaningful patterns is important to establish a solid trajectory of growth and development.

For my personal education process, unlearning was more important than learning. My formal schooling consisted of an undergraduate degree in political science and a traditional MBA program. After two decades of business strategy consulting experience deeply rooted in fundamental analysis, I was ill-equipped to excel in a short-term trading time frame. In order to embrace technical analysis, I first had to jettison my fundamental perspective on investments and build a new foundation based on technical analysis and market sentiment.

In my opinion, the best way to approach trading is to consider the educational process to be a lifelong endeavor, crossing as many multi-disciplinary boundaries as can be digested. In a way, I like to think of the foundation of trading success as building a large idea stew and developing an eye for spotting high potential new ideas. The trick is to have the right breadth and depth of knowledge so that when one stumbles on the next great strategy, it can be easily identified, captured and developed. Call it opportunistic research and development, if you will.

As luck would have it, some of the most successful trading strategies I employ are based on areas in which I had limited knowledge when I first encountered them. No matter how well things are going, I take the approach that I never have the luxury of being satisfied with the status quo and need to embrace the idea of getting out of my comfort zone. In trading and in life, it pays to constantly refresh the pipeline of new ideas and continue to tinker with them, because you never know what will be on tomorrow’s test.

Related posts:

[source: Expiring Monthly, May 2010]

Disclosure(s): I am one of the founders and owners of Expiring Monthly

Thursday, May 27, 2010

The VIX, Rule of 16 and Realized Volatility

Two days ago, in Rule of 16 and VIX of 40, I discussed the Rule of 16 in terms of translating the (annualized) VIX number into expectations for future daily realized volatility in the S&P 500 index.

That post drew several interesting comments, which unfortunately they now reside somewhere in Disqus limbo. In one of the comments, rafaminos offered the following thoughts:

It seems that VIX is on average higher that realized volatility (based on daily returns over 30 days). I also tried to shift VIX 30 days in advance and the conclusion is the same. Since the historical ratio of the two is 1.45 (VIX/realized volatility), should not we infer from this past relationship that the implied realized volatility is more like 30 (45/1.45), meaning a 2% change 1/3 of the time?

My reply appears to be somewhere in comment purgatory as well, but the essence of my response is as follows:

Over that last 20 years, I get a VIX that is about 1.40 times the SPX 20-day realized volatility. I attribute some of the discrepancy to the high demand for SPX puts as hedges, which tends to inflate the VIX relative to realized volatility (and immediately suggests some strategic implications vis-a-vis short SPX puts strategies.)

So...given that a VIX of 32 is about 1.4x SPX realized volatility and 32/1.4 = 22.9 and 32*1.4 = 44.8, based on the historical evidence, I would conclude that:

1) VIX of 32 – 1/3 of the time the SPX is expected to have a daily change of at least 2%, but...

2a) VIX of 32 – 1/3 of the time the SPX will (based on historical data) have a daily change of at least 1.4%
2b) VIX of 45 – 1/3 of the time the SPX will (based on historical data) have a daily change of at least 2%

For more on related subjects, readers are encouraged to check out:

Disclosure(s): short VIX at time of writing

Tuesday, May 25, 2010

Rule of 16 and VIX of 40

After a year or so of almost uninterrupted falling volatility, the last few weeks have seen a surge in the VIX and other measures of volatility. In fact the VIX more than tripled in a little over a month, jumping from an April 12 low of 15.23 to a May 21 high of 48.20.

One way to come to terms with the current 40ish level in the VIX is to think in terms of daily percentage changes in the underlying, the S&P 500 index. Technically, the VIX represents one standard deviation of the market’s estimation of changes in the price of the SPX during the next 30 days. The VIX number is the size of that standard deviation in annual percentage terms, but since volatility is a function of the square root of time, in order to translate that annual standard deviation number into a daily number, one has to divide by the square root of the number of trading days in a year. A year typically has about 252 trading days and the square root of 252 is 15.87, which options traders generally round up to 16 in their head. Hence the “Rule of 16.”

Using 16 makes it easy to do some quick math in one’s head. If the VIX is at 16, as it was a little over a month ago, one would expect that 68.2% of the time (one standard deviation), the daily change in the SPX would be 1% or less and 31.8% of the time it would be 1% or more. To simplify the math even more, options traders often make the mental conversion of 68.2% to two thirds. Since traders are generally more concerned about big moves than small ones, they tend to focus on the outlier portion of the standard deviation calculation, the one third of trading days which are more volatile than normal.

Using the rule of 16 and the 1/3 trading days time frame, the following translations should be committed to memory:

  • VIX of 16 – 1/3 of the time the SPX will have a daily change of at least 1%
  • VIX of 32 – 1/3 of the time the SPX will have a daily change of at least 2%
  • VIX of 48 – 1/3 of the time the SPX will have a daily change of at least 3%

Simple math allows us to do a linear interpolation. Today, with the VIX hovering around 40, options traders are expecting that the SPX will have daily change of 2.5% about 1/3 of the time.

Looking backward, as volatile as the market have been recently, only three days out of the past month have resulted in daily changes of 2.5% or more. In fact, for all of 2010, there have been only four days in which the SPX has been either up or down at least 2.5%.

In terms of conclusions, either market volatility is about to increase substantially from current levels or options traders have overestimated future volatility. As bearish as today has been, the SPX is “only” down 1.6% as I type this. If we have one or two more days in which stocks show average to slightly higher than usual volatility, expect the VIX to begin to move back down to a level that is a better reflection of those daily moves.

For more on related subjects, readers are encouraged to check out:

Disclosure(s): short VIX at time of writing

Saturday, February 27, 2010

Charting 101

Given the dismal response to the chart of the week contest, I thought a couple of suggestions and hints might be in order to help get the graphics flowing.

For starters, creating charts is easy. Making charts that tell a compelling story only requires a little bit of insight and effort. Sometimes the best way to make a interesting chart is just to look at a bunch of them until one of them jumps off the page and forces you to take notice.

A good place to start with charting is your favorite broker. For those who like to use a third party specialty chart tool, one of the best free charting sites is at FreeStockCharts.com, where you can create an attractive chart that is as simple or complex as you wish in one or two minutes.

For those wishing to subscribe to a charting service, my personal favorite is StockCharts.com, where you can maintain a stable of charts that are customized to your liking. Non-subscribers can create a fairly comprehensive view of almost any security, ratio, etc. using gallery charts. There are a number of attractive features that are also available for free. These include an extensive group of public chart lists that are the product of some of exceptionally talented technical analysis practitioners, a ticker cloud of the most popular current charts and a sharp charts voyeur that keeps tabs on charts being created by others.

Keep in mind that with the explosion of ETFs, it is possible to slice and dice the investment universe with almost infinite precision and variation. Also, a screen capture tool such as Screen Hunter can make it easy to capture any chart for posterity.

For those who are partial to fundamental data, there is the Federal Reserve Economic Database (FRED), where you are never more than two clicks away from creating your own customized chart of economic data. The Bureau of Economic Analysis, National Bureau of Economic Reserach and U.S. Census Bureau are three of many other excellent sources for government data.

If your interests run more toward concepts and ideas, Google Trends can churn out some fascinating charts in a matter of seconds.

Finally, many providers of specialized data publish their own charts. Two that I like to refer to on a regular basis are the CBOE VIX term structure and the ISEE call to put ratio. [If you intend use a chart created by a non-governmental third party, I always recommend asking for permission in advance.]

So…the one year free subscription to Expiring Monthly: The Option Traders Journal is still up for grabs. Where is the winning chart?

For more on related subjects, readers are encouraged to check out:

Disclosure(s): I am one of the founders and owners of Expiring Monthly

Tuesday, December 15, 2009

Adapting Annualized Volatility to Other Time Frames

In Calculating Centered and Non-centered Historical Volatility I attempted to walk through the steps and calculations necessary for determining of historical volatility (HV) using an Excel spreadsheet.

The second to last step in the calculation (before translating the final number into a percentage) is to annualize the standard deviation by multiplying it by the square root of the number of days in a year. In the example I chose, I used 252 trading days, reasoning that there are 365 days per year, 104 weekend days and approximately 9 holidays. One could also argue that while the markets are not open on weekends and holidays, there is market-moving news that makes the jump from Friday to Monday generally more volatility than a typical overnight period. By that line of reasoning, it could be appropriate to use 365 calendar days in the calculation. I am not aware of any options traders that use the square root of 365 in their calculations instead of 252, but note that such an approach would yield a historical volatility number about 20.4% higher (e.g., 18.81 instead of the 15.63 I arrived at in the example in Calculating Centered and Non-centered Historical Volatility.)

Most floor traders simplified the volatility calculation process by assuming 256 trading days in a year. With the square root of 256 an even 16, this greatly simplified the calculations that were done in one’s head.

Not everyone is interested in annualized volatility data. Traders who have options expiring in a week are more interested in determining historical volatility in weekly terms. In order to calculate weekly volatility instead of annualized volatility, simply substitute the square root of 52.14 (the number of weeks in a year) for the square root of 252. The multiplier to determine weekly volatility thus becomes 7.22. Using the example referenced above, the 15.63 per cent annualized volatility translates into 7.11 per cent weekly volatility. A similar approach could be used to calculate historical volatility over other periods, such as a month or perhaps even two years.

Sometimes called statistical volatility or realized volatility, the 15.63 historical volatility means that looking backward, approximately 68% of the time (one standard deviation), the underlying (S&P 500 index) moved 15.63% or less on an annualized basis. Similarly, given the same data set, approximately 68% of the time the underlying moved 7.11% or less on a weekly basis.

Before I wrap up the current discussion of historical volatility, I will use the next two or three posts to talk about how investors might want to use historical volatility data.

For more on historical volatility, readers are encouraged to check out:

Disclosure: none

Tuesday, December 8, 2009

Calculating Centered and Non-centered Historical Volatility

Yesterday in What Is Historical Volatility? I attempted to provide a brief overview of historical volatility (HV) and put it in a broader volatility context.

Today I will endeavor to address the most frequent question I get about historical volatility: exactly how is it calculated?

You would think the calculation would be a straightforward affair, but this is not necessarily the case. As best I can in plain English (and since I have not mastered Word’s equation editor), the steps for calculating historical volatility are as follows:

  1. Select a desired lookback period in trading days (lookback period)
  2. Gather closing prices for the full lookback period, plus one additional day (lookback +1)
  3. Calculate the daily close-to-close price changes in a security for each day in the lookback period (daily change)
  4. Determine the natural log of each daily percentage change (log of daily changes)
  5. Calculate the mean of all the natural logs of the closing prices for the lookback period (log lookback mean)
  6. For each day, subtract the lookback mean from the log of daily changes (daily difference)
  7. Square all the differences between the mean and the daily change (daily variance)
  8. Sum all the squares of the differences (sum of variances)
  9. Divide the sum of the squares of the variances by the lookback period (lookback variance)
  10. Take the square root of the lookback variance (historical volatility, expressed as a standard deviation)

Finally, to convert the standard deviation into an annual volatility percentage take the HV expressed as a standard deviation and multiply it by the square root of the number of trading days in a year (approximately 252) and then by 100 (historical volatility).

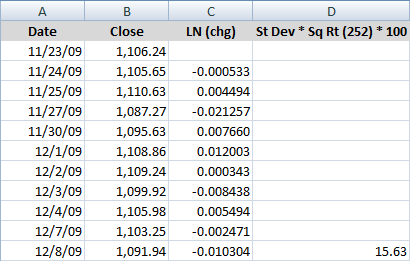
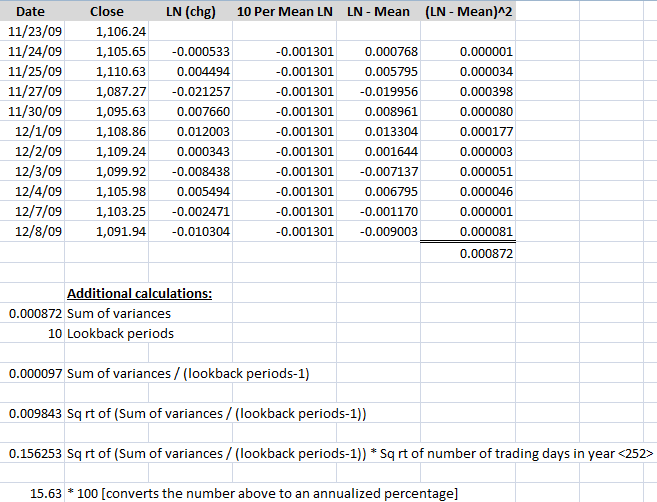
An Excel example will help to illustrate the steps and calculations. The table below uses closing data for the SPX for the last eleven trading sessions. The second row has a date of 11/24/09 in column A, a close of 1105.65 in column B and the natural log of the close for 11/24 divided by 11/23 in the column C [=LN (b3:b2)]. Column D is an average of the natural logs in column C [=average (c3:c12)], while column E simply subtracts column D from column C [=c3-d3]. Finally, Column F squares the results of column E [=e3^2] and cell F13 sums all the squares [=sum(f3:f12)].

The calculations below the main table start by repeating the value of F13 in A16 [=f13] and stating the number of lookback periods in A17. In A19, A16 is divided by A17 [=a16/a17]. A21 then takes the square root of the result from A19 [=a19^1/2]. A23 takes the result from A21 and multiplies it by the square root of 252 [=a21*sqrt(252)]. Last but not least, A25 converts to result from A23 to a percentage [=a23*100], yielding a 10-day historical volatility of 15.63.

To replicate the entire table, the formulas from row 3 can just be copied down to the bottom of the table, with one exception. That exception is column D, where the mean value – not the formula – is repeated throughout the table.

If this seems like a lot of calculations to arrive at historical volatility value, there is a much shorter and slightly different way – and one that I believe generates a better number for traders.

The above calculations reflect a centered approach in which daily price changes are characterized relative to a mean value for the entire period. Another way to look at the same problem is to assume that in the long run, the mean change in price approaches zero and is not meaningful. As a corollary, if the mean is not meaningful, there is no reason to subtract it from the daily changes, so all the calculations involving the mean can be dropped. This is the non-centered approach to calculating historical volatility and is sometimes known as “ditching the mean”.

The resulting table below is much more manageable and easier to follow. The first three columns (date, close and natural log of the daily price change) are identical to those above. The fourth column simply takes the standard deviation of the natural log of the daily price changes, multiplies it by the square root of the number of trading days in a year (252) and coverts it to an annualized volatility percentage by multiplying by 100. As a consequence, the formula in cell d12 below is simply =stdev(c3:c12)*sqrt(252)*100. This formula can now be copied to the rows below to calculate subsequent historical volatility values. Note that unlike the centered approach, there are no additional calculations required beyond those in the main table.

Here the non-centered approach also yields a 10-day historical volatility of 15.63.

For the next part in this series, I will expand upon what some of the formulas mean, how they can be modified, and why traders might prefer the non-centered historical volatility data to the centered historical volatility data.

For more on historical volatility, readers are encouraged to check out:

Disclosure: none

Monday, December 7, 2009

What Is Historical Volatility?

The volatility universe splits fairly neatly into two halves: historical volatility (HV) and implied volatility (IV). I tend to place slightly more emphasis on implied volatility because implied volatility looks to the future, is derived from options prices, and can provide some clues about the current sentiment of options investors. Of course, the CBOE Volatility Index, commonly known as the VIX, is an index that measures implied volatility in S&P 500 index options, so that may persuade me to favor IV over HV a little as well.

Compared to implied volatility, historical volatility seems like a relatively simple concept. It looks backward at price action and measures the degree of change in the price of a security. Things get a little more complicated, however, when one asks two seemingly innocuous questions:

  1. How long of a period?

  2. What method of measurement is used?

The issue of a lookback period is really not much of a complication, but it does lead to a proliferation of historical volatility numbers. As historical volatility looks only at trading days, it is important to note that the historical volatility calendar differs from the implied volatility calendar. As a result, the standard implied volatility time horizon of 30 (calendar) days (such as is used by the VIX) translates to about 21 trading days, assuming the usual NYSE nine holidays per year. Even with the different calendars, the most frequently used historical volatility measurement is HV 30, which translates to about 43 calendar days.

The appropriate lookback period to use for historical volatility calculations is ultimately a matter of personal taste. As noted above, most providers of HV data tend to standardize on HV 30, but I generally prefer HV 20 or HV 21, as this is a better approximation of a trading month. One can use shorter time frames, but investors should be wary of the amount of noise in calculations that look back less than 20 days. Still, I like to look at HV 10 to get a sense of the most recent volatility trend. Looking farther out, HV 50 or HV 60 are popular ways to capture almost an entire earnings cycle, while HV 90, HV 100, HV 180 and HV 200 are all excellent ways to capture the long-term volatility trend. In order to incorporate a full year of historical volatility, HV 250 is recommended. Some options traders like to look at two full years of historical volatility data with the likes of HV 500, but I rarely find much value looking back a second year unless – as is the case right now – the most recent year is filled with quite a few statistical outliers.

Any good options broker will have one of more historical volatility calculations built in, but HV data is also available from various options service providers such as Livevol or iVolatility.

Note that standard historical volatility data are the result of a calculation involving close-to-close prices, specifically end of day prices. As such, historical volatility does not capture the magnitude of any intraday price movements, which are better served by calculations such as an average true range.

Finally, while there are many ways to calculate historical volatility, by convention historical volatility is calculated by taking the standard deviation of the difference between the natural log of the daily changes in the price of the underlying and the mean value during the lookback period. This sounds a lot uglier than it turns out to be in Excel. Since this is the holiday season, however, tomorrow I will provide a recipe for the traditional historical volatility calculation as well as a modification that I find simpler and more useful.

For more on historical volatility, readers are encouraged to check out:

Disclosure: Livevol is an advertiser on VIX and More

Friday, October 23, 2009

Trading Resources: Print and Electronic Magazines

In keeping with the theme of thinking like a biotech firm and the trader development stage model, I thought it might be helpful to highlight some of the top trading magazines that help to keep new ideas flowing.

Five established monthly print magazines that traders might wish to check out include:

  • Technical Analysis of Stocks & Commodities – an excellent choice if you are interested in analyzing chart patterns, indicators and trading systems. This magazine is particularly useful if you wish to see the relevant TradeStation, eSignal, etc. code in addition to the analysis
  • Active Trader – has a strong technical analysis and trading strategy orientation. Expect to see lots of equity curves, including a regular Trading System Lab feature that uses the Wealth-Lab platform
  • Futures – a broad-based magazine that covers futures, options and forex, with features that emphasize trading strategies and include a healthy dose of options-related material
  • Tradersworld – competes in the same space as the three magazines above, but for whatever reason, has never made the same impression on me as the others
  • Stocks, Futures and Options Magazine – the only free magazine in this group, SFO focuses largely on macroeconomic trends and high-level issues related to trading

Two additional electronic magazines – both free – take a direct aim at the options market and offer more options and related comment than the print competition:

  • Futures and Options Trader – published monthly in PDF format by the Active Trader group, this is a solid resource for the beginning to intermediate options trader
  • Futures in Volatility – more of a newsletter than a magazine, this is a publication of the CBOE Futures Exchange (CFE) and targets volatility futures, specifically VIX futures. Included in each monthly issue is a commentary section authored by Larry McMillan

Next, I would be remiss in not pointing out two relatively new print/electronic hybrids, both free, that specialize in options content and are available quarterly:

  • Bernie Schaeffer’s SENTIMENT – published by Schaeffer’s Investment Research, SENTIMENT covers a wide range of options and market sentiment topics, with an appealing mix of features and resources. The magazine can be downloaded as a PDF or delivered to your analog mailbox
  • thinkMoney – a thinkorswim publication that is mailed to thinkorswim customers, but is available as a PDF to customers and non-customers at the thinkorswim web site. Some of the content is thinkorswim-specific, but there is information that is valuable to a general audience as well

Finally, I feel obligated to pay homage to two high profile casualties of the financial crisis:

  • Trader Monthly – the glossy lifestyle magazine that oozed trader bling and testosterone
  • Condé Nast Portfolio – the ambitious business-journalism-meets-hedge-fund-world publication that had its moments as a shining star, albeit briefly

Wednesday, August 26, 2009

An Introduction to Treasury Auctions

It remains to be seen whether the growing U.S. Department of the Treasury auctions will be a relatively quiet sideshow or eventually take the center stage in the ongoing financial crisis. As the number of potential disaster scenarios continues to shrink, one subject that I see receive surprisingly little play in the blogosphere is one of the few remaining potential disasters: the auction of U.S. debt.

The concern is that as the U.S. debt grows, so does the volume of Treasury debt for each auction. The big fear is that at some point the supply of U.S. debt may begin to outstrip the demand. At the moment, China and Japan account for about 2/3 of all foreign holdings of U.S. Treasuries; any plateau in the demand for U.S. debt from these two nations might necessitate higher interest rates to stimulate demand and could send potentially traumatic shock waves throughout the economy. This is the disaster scenario. So far, I am happy to report, demand for Treasuries has been robust and yields have remained at very low levels.

The U.S. Treasury auctions a mixture of Treasury Bills (with maturities from 4 weeks to 52 weeks), Treasury Notes (from 2 to 10 years) and 30-Year Treasury Bonds. The T-Bills are auctioned on what is largely a weekly cycle, with the typical pattern seeing the 13-week and 26-week T-Bills slotted for Mondays and the 4-week and 52-week T-Bills on Tuesdays. Given the frequency of these T-Bill auctions and the relatively low demand from foreign central banks, the T-Bill auctions are probably the least important auctions in terms of being able to gauge market sentiment and the strength of foreign demand.

The more important auctions are of the Treasury Notes, where the 10-Year Note has become the de-facto benchmark for U.S. long-term debt. Treasury Note auctions are best understood as occurring on a monthly cycle, with the 3-Year and 10-Year Notes typically auctioned on Tuesdays and Wednesdays during the second week of each month and the 2-Year, 5-Year and 7-Year Notes typically auctioned off on Tuesdays, Wednesdays and Thursdays of the last week of each month.

The 30-Year Bond and Treasury Inflation Protected Securities (TIPS) are a much smaller part of the Treasury refunding process and are subjects for another post.

The results of Treasury auctions are announced at 1:00 p.m. ET (see Announcement & Results Press Releases) and contain three particularly important pieces of information:

  1. Yield
  2. Bid-to-cover ratio
  3. Percentage of indirect bidders

In short, the yield determines the cost of the debt refunding and/or the price sensitivity of the bidders. The bid-to-cover ratio is simply the total dollar amount of the bids tendered by the total amount of the securities being auction and reflects demand relative to supply. Finally, the percentage of indirect bidders is used as a proxy for demand from foreign central banks, as indirect bids are bids of significant size that do not go through the primary dealer community.

Going forward, investors should keep an eye on the Treasury auctions, particularly on the demand for U.S. Treasury Notes. Should yields start rising, bid-to-cover ratios start falling and participation by indirect bidders begin to decline, then we may have the beginnings of a new kind of debt crisis on our hands.

For additional information on Treasury auctions, try:

For some VIX and More posts on TIPS, readers may wish to check out:

Monday, August 17, 2009

How to Trade the VIX

Based upon the search terms that are landing visitors on the blog this morning, it seems as if many readers are interested in how to trade the VIX. This question really boils down to two separate issues: strategies and trading vehicles.

Since I have talked about strategies repeatedly in this space in the past, I thought I would offer a quick summary of trading vehicles today.

First off, it is not possible to trade the VIX directly. Formally known as the CBOE Volatility Index, the VIX calculates market expectations of 30 day implied volatility for S&P 500 index options. The VIX (sometimes referred to as the cash or spot VIX) is a statistic that the CBOE calculates and disseminates every 15 seconds during the trading day. While widely disseminated, this statistic is not available for purchase.

Fortunately, there are a number of VIX derivatives that allow traders to take positions on the VIX without owning the underlying. In no particular order, they are:

  1. VIX options – these include standard options as well as VIX binary options

  2. VIX futures – standard VIX futures contracts have a contract size of 1000 times the VIX; the recently added mini-VIX futures have a contract size of 100 times the VIX

  3. VIX ETNs – currently consists of two exchange traded notes: the iPath S&P 500 VIX Short-Term Futures ETN (VXX) and the iPath S&P 500 VIX Mid-Term Futures ETN (VXZ). The former targets one month VIX futures and the latter targets five month VIX futures.

In addition to VIX products, one can always trade options on the SPX (or SPY). A long VIX position is very similar to a long SPX straddle (or strangle); a short VIX position is very similar to a short SPX straddle (or strangle.)

For some additional reading on these subjects, readers are encouraged to check out:

Friday, March 27, 2009

Learning About Options: The Exchanges (2)

When I first started drafting yesterday’s Learning About Options (1), I initially intended a brief overview of sources for those interested in teaching themselves about the subject of options. The more I thought about it, the more I decided that I really needed a multi-post series to properly address the subject and based on the enthusiastic response to the first post in this series, I am glad to have chosen that path.

In keeping with yesterday’s theme of free content from independent sources, today I wish to focus on the options exchanges. In the world of options exchanges, there are two large players at the top of the food chain. The Chicago Board Options Exchange (CBOE) is the undisputed leader in index options and a close second to the International Securities Exchange (ISE) when it comes to single-equity options volume.

The younger, all-electronic ISE has recently made a push to become more involved in education. The majority of the content for the ISE’s educational offerings utilize content from the Options Industry Council that I referenced in yesterday’s Learning About Options (1). This includes basic and advanced articles about options, a description of various options strategies, as well as several trading tools and online classes in options for beginner, intermediate and advanced traders.

In terms of non-OIC content, the ISE offers webinars and podcasts, but so far these have focused almost exclusively on foreign exchange trading, which I find more than a little disappointing. At this time, the ISE has posted over 350 videos in a YouTube ISE Options Education repository. Once again, forex is the dominant theme.

While the ISE has some material of interest, the CBOE has taken options education to an entirely different level, with a large amount of original content, covering a broad array of subjects and presented in just about every format imaginable. The CBOE even has a dedicated options education arm, The Options Institute, which offers a comprehensive set of tutorials, more detailed online courses, webcasts, seminars, “master sessions” with guest speakers and even customized programs. You can find these and most of the CBOE’s educational materials at the CBOE’s web site under the Learning Center tab.

Adjacent to the Learning Center tab are some options Strategies materials that are also worth checking out. In addition to information about the usual equity options strategies, the strategy tab includes information on LEAPS and index options that are rarely even acknowledged elsewhere on the web. More detailed explanations of advanced options strategies can be found in the archives of the Weekly Strategy Discussions.

The CBOE has also done some excellent work with top tier partners in the options space. The exchange has partnered with iVolatility.com to offer free IV index and options calculator tools, as well several premium options tools that come with free trials. For those who may be interested in virtual trading, the CBOE has two different approaches, based on partnerships with two of the top options brokers. The CBOE has worked with optionsXpress to deliver Virtual Trade Tool and with thinkorswim to offer paperMoney, each of which are virtual trading modules that are excellent ways for beginning traders to become familiar with the options trading process without putting real money at risk.

In terms of news, commentary and analysis, CBOE-TV continues to ramp up and has 3-4 new videos each trading day from the likes of Jon Najarian, Dan Sheridan and Angela Miles. This includes a great deal timely information that addresses options movers, economic data releases that are moving the market, etc.

Some of the newer features just rolled out this week include the Strategy of the Week program with Peter Lusk on CBOE-TV and a market commentary, which includes weekly articles from the staff of InvestorsObserver.

As you can see from some of the information I chose to highlight above, the CBOE offers best in class options education products and services, for the beginner to the advanced practitioner. If you are interested in learning about options, the CBOE is an invaluable educational resource.

Thursday, March 26, 2009

Learning About Options (1)

I have recently received several requests from readers who are interested in learning about options from scratch and are looking for suggestions on how to proceed.

First, I should preface my answer by saying that even if you never intend to trade options, it will probably be worth your while to take some time to understand how they work. At the very least, it is helpful to appreciate what is in the black box that generates various options indicators, such as the VIX and the put to call ratios.

Second, I intend on making this the first installment in a series of posts that cover the subject of learning about options. Today I will talk about two excellent general resources on the web; in later posts I will examine educational resources offered by the exchanges and several options brokers, recommend some books, discuss additional web sites and conclude with an overview of some of my favorite options blogs.

The subject of options is broad and deep. Fortunately, there are some excellent free resources on the web that allow someone who is interested in options to learn at their own pace and in small chunks of ideas and information.

Two excellent all-purpose resources for options beginners are The Options Guide and The Options Industry Council (OIC). I mention these two sites first, because their sole intent is to inform and educate, unlike some commercial sites that provide some free information and then try to sell you something with a subtle or sometimes not-too-subtle approach.

The Options Guide has a variety of short articles in their Options Basics section, as well as a handy Options Strategies reference, where you can search for specific types of options strategies that meet your needs, or click on an excellent visual menu of profit and loss graphs to get detailed information about a wide variety of strategies. There are even separate sections for index options and VIX options.

The Options Industry Council takes a comprehensive approach to education. While The Options Guide is a great starter kit and reference tool, I consider the OIC’s web site to be the gold standard. It is a great place to browse and get lost. If you want articles, DVDs, books, brochures, etc. on just about any options topic you are interested in, there is a good chance you will find it in the OIC’s online vault. The OIC has embraced a multimedia approach and as a result, offers online classes, as well as seminars and webcasts. You can see what material is available as a video webcast and also download a wide variety of podcasts.

The OIC also has a broad range of tools that includes a several options calculators, an options strategy screener and a position simulator. If that is not enough, you can even do some virtual trading through the OIC.

Considering that everything offered by The Options Guide and just about everything (books are an exception) offered by the Options Industry Council is free, investors who are interested in learning about options should put these two web sites at the top of their list when embarking on a self-study approach to learning about options.

Wednesday, February 11, 2009

Thinking About Volatility (First in a Series)

Lately I have been fielding a large number of questions about historical volatility, implied volatility and a variety of related subjects. For this reason, it seems like a good time to kick off what I envision as a series of educational posts on the subject.

First I would like to start out with my own definition of volatility and then throw out some thought starters.

Definition: Volatility is a measure of the degree of change in the price of a security

There are a number of ways to think about changes in the price of a security. For instance, changes in price may be described in terms of:

  • magnitude (amplitude) – how far?
  • frequency – how often?
  • duration – how long?
  • trend – unidirectional or choppy?
  • direction – up or down?

In terms of measurement, common ways to measure price changes include:

  • close to close
  • open to close (intra-bar; excludes gaps)
  • bar to bar maximum (e.g. Average True Range)

Of course each investor has their preferred unit of time, with each bar representing a minute, five minutes, one day or whatever.

By convention, most investors think of volatility in terms of changes in price, but I submit that volatility be measured in the following units:

  • points
  • percentage (of price)
  • standard deviations

Looking back at the definition, I sometimes like to think of volatility more broadly than I have formally defined it. Consider that volatility can be defined in terms of:

  • price
  • volume
  • trend (degree of trending vs. choppiness)

Finally, consider that once measured, volatility can be compared to a number of possible benchmarks. These include:

  • external aggregate (broad index)
  • relative to peers (sector index, sector ETF, other representative ETF)
  • relative to self (including historical volatility and prior implied volatility levels)

I will touch upon all these subjects and more in the coming days and weeks.

DISCLAIMER: "VIX®" is a trademark of Chicago Board Options Exchange, Incorporated. Chicago Board Options Exchange, Incorporated is not affiliated with this website or this website's owner's or operators. CBOE assumes no responsibility for the accuracy or completeness or any other aspect of any content posted on this website by its operator or any third party. All content on this site is provided for informational and entertainment purposes only and is not intended as advice to buy or sell any securities. Stocks are difficult to trade; options are even harder. When it comes to VIX derivatives, don't fall into the trap of thinking that just because you can ride a horse, you can ride an alligator. Please do your own homework and accept full responsibility for any investment decisions you make. No content on this site can be used for commercial purposes without the prior written permission of the author. Copyright © 2007-2023 Bill Luby. All rights reserved.
 
Web Analytics