Showing posts with label psychology. Show all posts

Thursday, March 29, 2012

Another Spike in VXX Volume

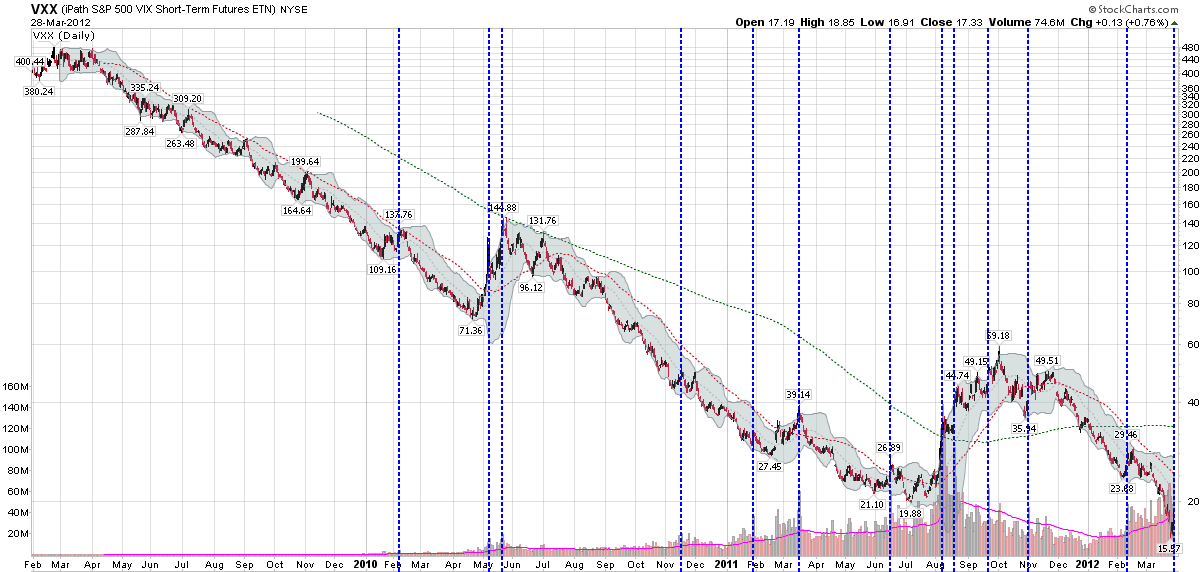
Looking the history of the volume spikes in the iPath S&P 500 VIX Short-Term Futures ETN (VXX) is a lot like looking at the history of market sentiment, contrarian thinking and psychology.

Since its launch in January 2009, VXX has been responsible for luring in unwary investors with its siren song promise of huge profits ahead of the next, inevitable, just-around-the-corner selloff in stocks. Unfortunately for VXX longs, the hoped for VIX spike usually turns out to be much more elusive than anticipated and investors who fail to tie themselves to their masts typically end up shipwrecked on the treacherous shore of complacency.

A glimpse at the biggest volume spikes in the history of VXX (see chart below) shows that almost all of these happen at near the top of a VIX spike and leave longs exposed to a sharp downturn. The notable exceptions are largely limited to last August, when a surge in VXX trading volume accompanied the first leg up of what turned out to be a multi-stage rally in the VIX and VXX.

If history is any guide, the current VXX volume spike (with 75 million shares traded yesterday, the only stock that traded more shares was BAC) is likely to turn out to be some combination of wishful thinking and an overreaction to yesterday’s mini-spike, when the VIX traded over 17.00 for the first time in thirteen sessions. Then again, history has not been a very good guide for the last few years and triskaidekaphobics in particular should always prepare for the worst…

Related posts:

[source(s): Stockcharts.com]

Disclosure(s): short VXX at time of writing

Wednesday, March 21, 2012

The Dangers of Anticipating a Market Reversal

Raise your hand if you are anticipating a bearish reversal in stocks in the near future. Great. Lots of hands here... Now let’s be honest, how many were also expecting a reversal a week ago? a month ago? ever since the calendar turned to 2012?

Market reversals are notoriously difficult to predict, which is part of the reason why many successful investors stick exclusively to trend following strategies. If one bets on a market reversal such as a correction during a bull market and it doesn’t happen, not only is there a loss associated with a short position, but there is also the opportunity cost of not having participated in the rally.

The worst part of trying to anticipate a market reversal, however, can be the psychological damage. If an investor thinks that a market is overbought or overvalued, then gets short and covers that short after the market continues to rise, they often subsequently have to wrestle with a mental block that makes it even harder to get long in a market that now appears to be even more overbought/overvalued.

So what is a savvy investor to do when he or she believes that stocks have risen too far too fast?

One approach is a stock replacement strategy. This approach consists of selling existing long holdings and replacing these with equivalent long call positions (1 contract for every 100 shares held.) A stock replacement strategy allows an investor to participate in any subsequent bullish moves, yet limits losses to the cost of the options purchased. While all stocks and other securities do not have options associated with them, there are always index options and options on a wide range of exchange-traded products (ETPs) available that are close approximations for the original holding.

For investors who think stocks are more likely to tread water than correct sharply, covered calls (or buy-write strategies) are an appropriate strategic choice. Here there are ETPs which can execute such strategies, the most popular of which is the PowerShares S&P 500 BuyWrite Portfolio ETF (PBP).

A third approach might be to rotate into less volatile holdings such as the popular PowerShares S&P 500 Low Volatility Portfolio ETN (SPLV).

Investors who are looking to hedge their existing long equity positions without rotating into options, covered calls or low volatility holdings might want to review my recent Dynamic VIX ETPs as Long-Term Hedges, which focuses on VQT and XVZ.

Quite a few talented investors have missed out on the 2012 rally and despite what you hear on CNBC or read in your favorite financial publication, there is no guarantee we will get a big pullback anytime soon. In the meantime, there are a number of approaches that will allow investors to benefit from any continued bull moves, while minimizing downside risk. In addition to some of the approaches outlined above, the links below should be a good source of information for explaining some alternative approaches as well as the nature of the recent market moves.

Related posts:

Disclosure(s): long PBP and XVZ at time of writing

Tuesday, March 13, 2012

A VIX of 15!?! Meet the New Reality

When the VIX recently slid below 20.00 for an extended period, I sensed a noticeable unease about the state of the market in many traders and investors. Clearly a sub-20 VIX was underestimating the risks in the current and future market environment, they thought. When the VIX dipped below 18.00 that unease intensified and now with the VIX hovering around the 15.00 range and I can sense that quite a few are ready to grab the nearest pitchfork and riot about the inhumanity of the wayward VIX.

I will be the first to admit that there are a number of perplexing geopolitical, macroeconomic and other factors that pose real threats to the economy and to stocks, but I also believe that investors have become so fixated on some of the past problems that availability bias and disaster imprinting has clouded their judgment to the extent that they cannot separate the current market environment from the ghosts of markets past.

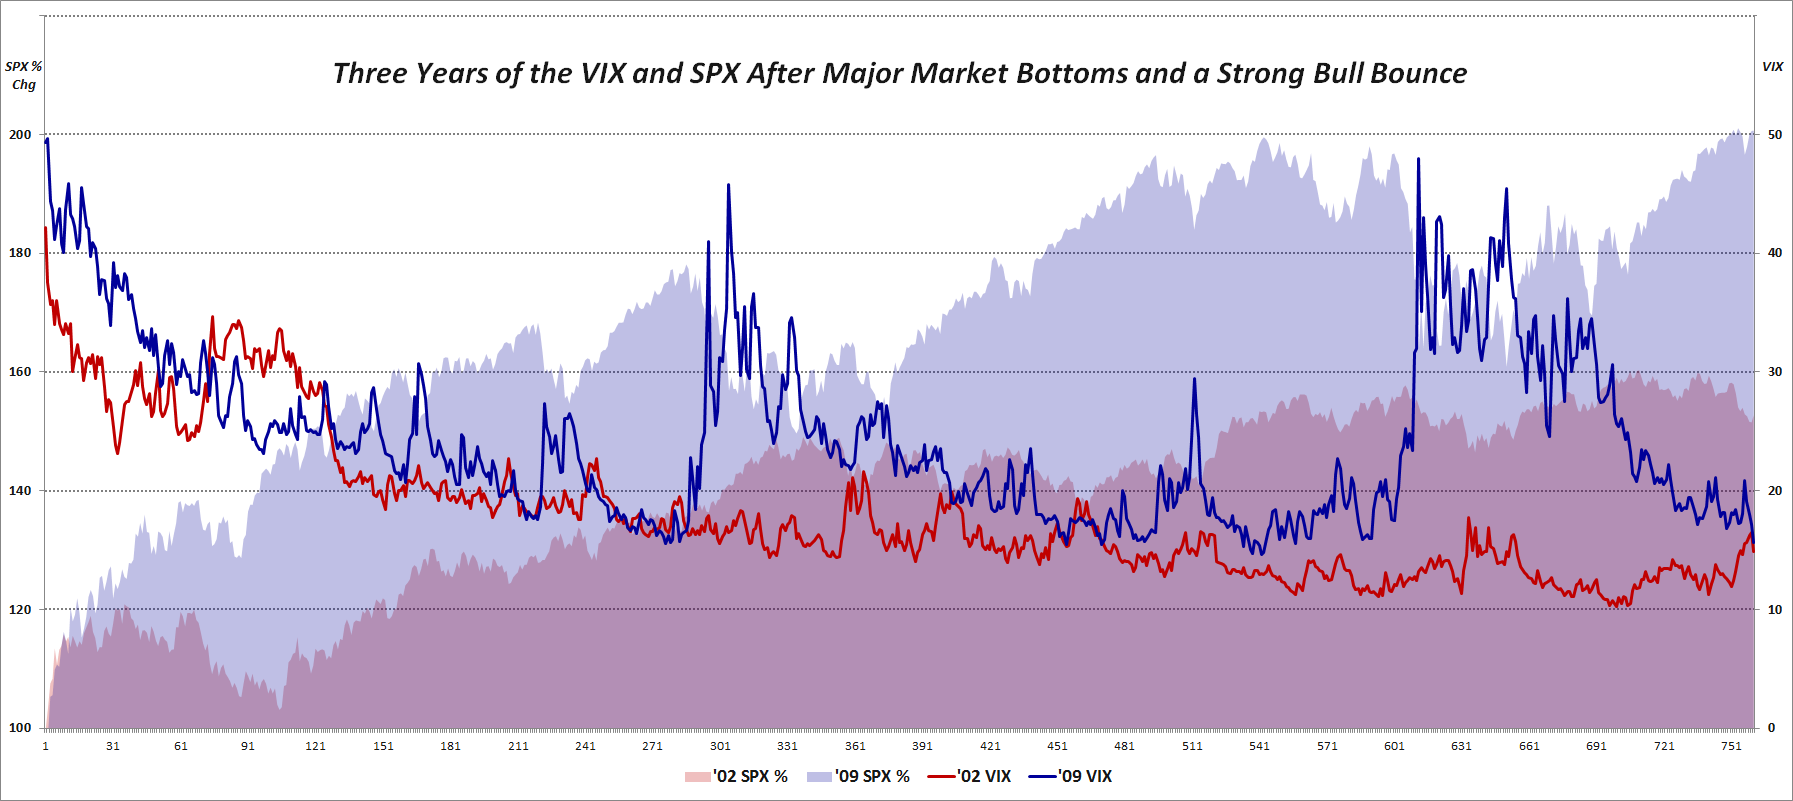
With this in mind, I created a chart to show what happened the last time we had a sharp market selloff and a subsequent bounce that lasted three years. The graphic below shows the percentage change in the SPX as well as the absolute VIX level in the three years following the October 2002 lows in the SPX as well as the three years following the March 2009 lows. Note that from 2002-2005, the SPX rallied about 53%; the current rally in the SPX from the March 2009 close is over 100%.

Turning to the VIX, it starts the sequence in the 42s in 2002 and in the 49s in 2009. Note that in both instances, the VIX had made it into the teens within one year of the beginning of the bull move. As the 2002 bull bounce continued, however, the VIX plummeted, spending a great deal of time in the 10-13 range, with a median value of 15.30 in the first three years of that bull market. The rally off of the 2009 bottom has been a different animal altogether, however, with forays down to the 15s being extremely rare (though it did happen on occasion in 2010 and 2011) and a median VIX of 22.84 during that same initial three years of the bull market.

Of course not all bull markets are the same (and there are many that will not concede that the current rally is a bone fide bull market) and every wall of worry is made of different types of stones, but at some point investors need to come to terms with the reality of a VIX of 15, particularly when we are looking at realized volatility that has been sub-10 for the last two months.

Related posts:

Disclosure(s): none

[sources: CBOE, Yahoo]

Tuesday, September 21, 2010

The Education of a Trader

[The following first appeared in the May 2010 edition of Expiring Monthly: The Option Traders Journal, on the back page of the magazine, where the authors are encouraged to be tangential and irreverent. I thought I would share it because of the positive feedback I received from a number of readers and because I think this piece dovetails nicely with the collection of links below.]

Do you remember from your school days those students who when confronted with a complex issue, would acquire a look on their faces somewhere between consternation and dread, immediately thrust a waving hand up into the air and blurt out in a worried voice, “Do we have to know this for the test?” I can be fairly sure that none of these people ended up as successful traders.

One only has to look at the history of hiring patterns at Wall Street firms to get a sense of the evolution of thinking about how to develop a successful trader. For many years, the model for aspiring traders was considered to be a genteel Ivy League education. Over time, Wall Street firms began to favor graduates with a more humble socioeconomic pedigree who were considered hungry, hard working and highly motivated to prove something to the world. In more recent years, we have seen Wall Street seek out physicists and those with exceptional quantitative skills. Lately, a desire for poker skills has also come into play.

As I see it, all traders are ultimately self-taught. There are no required classes, readings, homework assignments or even a syllabus with recommendations. Tests are administered on a daily basis, frequently with multiple tests on the same day. Worst of all, everyone is graded on an unfavorable curve in which there are more Fs than As.

Against this backdrop, education counts, but skill and experience count even more. An insatiable curiosity helps, as does a willingness to explore unfamiliar territory. Great trades, insights and strategies present themselves in somewhat random fashion and, as Louis Pasteur observed, “Chance favors the prepared mind.”

But what kind of preparation is ideal? Malcolm Gladwell asserts that 10,000 hours of experience is a prerequisite for greatness in almost any field. In a normal career, that level of commitment usually translates to five years, but on Wall Street, 10,000 hours of experience can be crammed into 3–4 years. Of course, all hours are not created equal. A trader’s capacity to distinguish between random events and meaningful patterns is important to establish a solid trajectory of growth and development.

For my personal education process, unlearning was more important than learning. My formal schooling consisted of an undergraduate degree in political science and a traditional MBA program. After two decades of business strategy consulting experience deeply rooted in fundamental analysis, I was ill-equipped to excel in a short-term trading time frame. In order to embrace technical analysis, I first had to jettison my fundamental perspective on investments and build a new foundation based on technical analysis and market sentiment.

In my opinion, the best way to approach trading is to consider the educational process to be a lifelong endeavor, crossing as many multi-disciplinary boundaries as can be digested. In a way, I like to think of the foundation of trading success as building a large idea stew and developing an eye for spotting high potential new ideas. The trick is to have the right breadth and depth of knowledge so that when one stumbles on the next great strategy, it can be easily identified, captured and developed. Call it opportunistic research and development, if you will.

As luck would have it, some of the most successful trading strategies I employ are based on areas in which I had limited knowledge when I first encountered them. No matter how well things are going, I take the approach that I never have the luxury of being satisfied with the status quo and need to embrace the idea of getting out of my comfort zone. In trading and in life, it pays to constantly refresh the pipeline of new ideas and continue to tinker with them, because you never know what will be on tomorrow’s test.

Related posts:

[source: Expiring Monthly, May 2010]

Disclosure(s): I am one of the founders and owners of Expiring Monthly

Monday, June 28, 2010

Great Metaphor for the Financial Markets

For the patience-impaired, this is one instance where the wait is worth it...


Disclosure(s): none

Thursday, May 13, 2010

Brett Steenbarger’s TraderFeed Archives

In the four years or so I have been using blogs as one of my core investment resources, only a handful of these blogs have consistently offered up high quality information and analysis. At the top of that list is probably Dr. Brett Steenbarger’s TraderFeed, which has specialized in trader psychology, where it has been the destination blog for this subject since its launch. Unfortunately, TraderFeed will no longer see any new posts, as Dr. Brett has made a career change which has resulted in the a cessation of new material on the blog. Fortunately, however, TraderFeed will live on as an archive of some 3700+ posts.

As far as I am concerned, what set TraderFeed apart was the interweaving of psychology, market sentiment, technical analysis and related subjects, deftly researched and written, all tied together with a fountain of original ideas. Back in the days when I used to periodically assemble my linkfest posts, it seemed almost impossible to cherry pick from the best of the blogosphere without including at least one post from Dr. Brett, as the links below can attest to.

The archives notwithstanding, the end of TraderFeed leaves a large hole in the blogging world. I have enjoyed others who have written extensively on trader psychology, including Denise Shull at Trader Psyches, but the departure of TraderFeed also provides me with an excuse to work more of my thinking about trader psychology into this blog. So whereas I still have many thousands of posts on the VIX and volatility kicking around in my head, I will also consider this development as an opportunity to explore some of the “…and More” side of this blog.

Finally, as luck would have it, Expiring Monthly had a feature interview with Brett Steenbarger just before the decision was made to put TraderFeed on hold. Look for Mark Wolfinger's conversation with Brett in the May edition of Expiring Monthly, which will be published on the Monday following the current options expiration cycle, May 24.

For more on related subjects, readers are encouraged to check out:

Disclosure(s): I am one of the founders and owners of Expiring Monthly

Friday, December 4, 2009

New Dr. Brett Series on Lessons for Developing Traders

If there is one blog on the web where I never seem to find the appropriate amount of time required to digest all the nuggets of wisdom it contains, that site is undoubtedly Brett Steenbarger’s TraderFeed. Filled with insights that range from quantitative analysis and system development to what is arguably the best collection of content on the web in the realm of trader psychology, TraderFeed continues to be – at least in my opinion – the top all-purpose investment blog on the web.

For this reason, when Brett mentioned in Lessons for Developing Traders: What Moves Markets that he is “going to write about topics that no one told me about when I was learning the ropes,” I thought that instead of waiting until the series is finished to highlight it I would flag it now for anyone who is not already on the Steenbarger bandwagon.

This new series also got me thinking to about the three things I wish I had been told (assuming I was smart enough to follow that advice) at the beginning of my trading career. The answers are personal ones, but I believe they capture insights that led to quantum advances in my trading:

  1. Standardize on one time horizon…and make it consistent with your trading approach and personality

  2. Make research and analysis of risk management at least as important as R&D on stocks, indicators and strategies

  3. Focus more time on developing expertise in managing (and exiting) existing positions than on discovering new high potential entries

For the record, a close fourth in this exercise was understanding the tenets of behavioral finance and the associated decision-making pitfalls that investors should learn to avoid. Those who wish to get a better sense of how I see the learning process for developing traders may wish to investigate my trader development stage model.

Readers, feel free to use the comments section to spell out the 3-4 things you wished someone had told you when you first started trading.

For more on these subjects, readers are encouraged to check out:

Disclosure: none

Thursday, November 5, 2009

Open Thread: How Has Your Trading Changed?

My recent foray into issues of investor psychology and behavioral finance assumes that traders have learned a number of lessons and/or changed the way they trade as the result of the events of the last year or two.

So...in what ways has your trading changed? What lessons have you learned? How are you different as an investor now than you were before the Lehman Brothers fiasco?

Wednesday, November 4, 2009

The VIX:VXV Ratio, Availability Bias and Disaster Imprinting

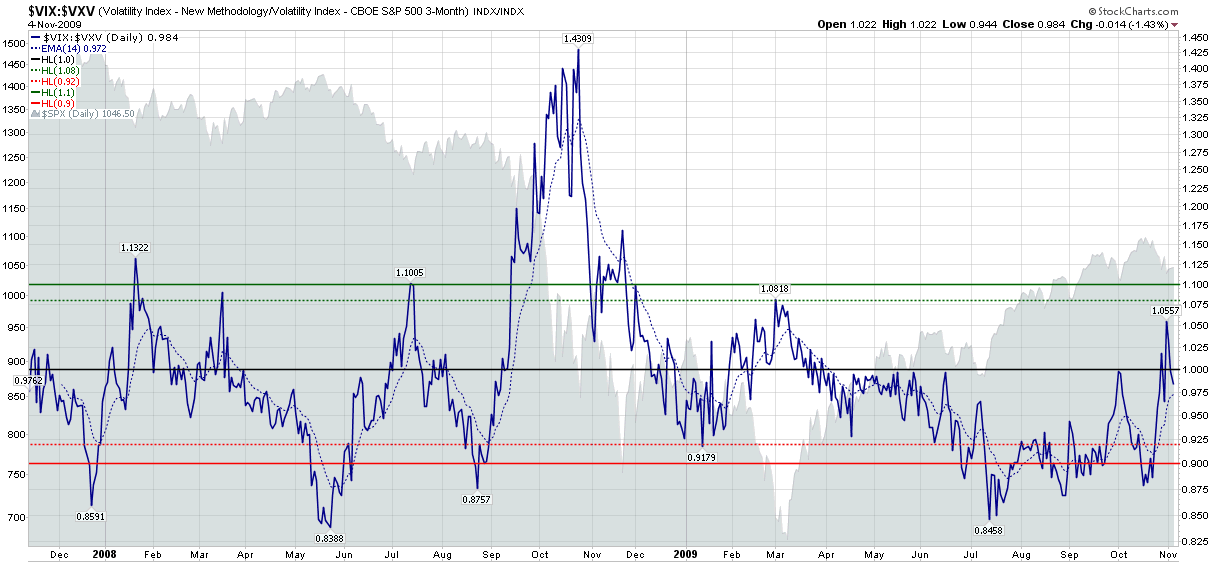
Once a popular subject in this space, the VIX:VXV ratio appeared to be a casualty of the financial turmoil and record volatility spikes in October 2008, when the ratio spiked to record levels an generated a buy signal that turned out to be nothing short of a disaster.

I was not yet ready to give up on the VIX:VXV ratio, so I was pleased to see that from November to January it generated some helpful long and short signals. In a promising development, on March 2nd the ratio generated a buy signal just before the markets bottomed. When the VIX:VXV ratio urged caution in June, I had even more reason to be hopeful. Then, once again, the ratio had another big miss, issuing a sell signal in mid-July just after the markets started rallying. To compound matters, instead of moving back toward the neutral zone (between 0.92 and 1.08), the ratio persisted with a bearish recommendation all the way to the October top.

I was just about to consign the VIX:VXV ratio to the “Sometimes Useful But Not Always Consistent” bin, but decided to reconsider when I started thinking about volatility levels in the context of availability bias and disaster imprinting, as well as The Gap Between the VIX and Realized Volatility and VIX Spike and VIX Futures Contango Means… As I see it, all these subjects are related. The realized volatility gap, persistent VIX futures contango and off-center VIX:VXV ratio (see chart below) are all symptoms of a market that is not functioning as it normally does, while availability bias and disaster imprinting are the main causes of this situation.

Further, the fact that the VIX futures term structure is now flat and the VIX:VXV ratio hit a new post-March 6th high of 1.056 last Friday suggests that the volatility picture may be starting to assume some of its pre-Lehman characteristics – if not exactly returning to a ‘normal’ state of affairs.

Personally, I still think the VIX is a little higher now than realized volatility will be a month from now, but a high VIX relative to realized volatility may turn out to be one of the more persistent effects of the global financial crisis, as each investor has their own personal half-life for how long availability bias and disaster imprinting will cast a shadow on their view of the investment landscape.

For additional posts on some of the above subjects, readers are encouraged to check out:

[source: StockCharts]

Disclosure: Short VIX at time of writing.

Tuesday, November 3, 2009

Availability Bias and Disaster Imprinting

After I dashed off The VIX Spike Conundrum, it occurred to me that there might be some aspects of behavioral finance that have contributed to what is now a full year of continued overestimating of future volatility. I detailed this phenomenon in The Gap Between the VIX and Realized Volatility and is also being reflected in up in a VIX:VXV ratio that has been stuck at unusually low levels from mid-July until last week.

In thinking about the various elements of behavioral finance that impair ‘rational’ decision-making and could contribute to excess implied volatility, one factor that immediately comes to mind is availability bias (nicely summarized in Wikipedia.) The global financial crisis and VIX spikes into the 80s were so vivid and memorable – and so thoroughly discussed in the media – that they are all too easy to recall one year later, even though arguably most of the risks associated with a VIX of 80 have since passed.

I do not think that availability bias is the only explanation for recent excess implied volatility. My working hypothesis – which I do not believe has been addressed by the behavioral finance crowd – is that another factor is as work. I call it “disaster imprinting” for lack of a better name. Disaster imprinting refers to a phenomenon in which the threats of financial and psychological disaster were so severe that they continue to leave a permanent or semi-permanent scar in one’s psyche. Another way to describe disaster imprinting might be to liken it to a low level financial post-traumatic stress disorder.

I will do some additional research to test the disaster imprinting theory, but for now I wanted to throw the idea out and see what others think. Has going to the brink of a global financial meltdown impaired our collective ability to assess future probabilities? If so, how long will this impairment last? As always, all comments are appreciated.

For additional posts on related subjects, readers are encouraged to check out:

Disclosure: Short VIX at time of writing.

Wednesday, October 21, 2009

Anchoring and a VIX of 20

I can’t quite decide whether to be delighted or puzzled that so many people seem to care that the CBOE Volatility Index (VIX) is approaching 20. In truth, I feel a little bit of each. When I started this blog, I decided to devote a fair amount of attention to this unusual statistic that very few people were aware of and most that did had stopped paying attention to out of boredom. Of course the VIX was at about 10 then, the markets were awash in liquidity, and following a volatility index felt about as useful as trying to estimate Usain Bolt’s times with a sundial.

Fast forward three years and many things have changed. I can certainly appreciate the role the VIX played in trying to help the masses quantify fear in the midst of the financial crisis. When the VIX hit 50, 60, 70 and 80, these new highs sent a message that the situation was getting worse – or that investors were willing to pay dearly to protect themselves from the many potential disaster scenarios looming on the horizon.

A funny thing happened when the markets started to recover. We started to hear a variety of opinions that the VIX was too low, that substantial risks still remained, etc. The “VIX is too low” argument has been heard for several months now, but it seems to be gathering steam as the VIX approaches 20.

More than 35 years ago, Amos Tversky and Daniel Kahneman wrote a seminal piece on anchoring called Judgment Under Uncertainty: Heuristics and Biases. In the words of the authors:

“In many situations, people make estimates by starting from an initial value that is adjusted to yield the final answer. The initial value, or starting point, may be suggested by the formulation of the problem, or it may be the result of a partial computation. In either case, adjustments are typically insufficient. That is, different starting points yield different estimates, which are biased toward the initial values. We call this phenomenon anchoring.”

This is the same line of thinking practiced by investors who watch GOOG hover around the 450 mark for week after week, thinking they will wait until the stock falls to 400 to buy it on the cheap. The problem is that when GOOG moves over 500, all that anchoring around the 450 has conditioned the brain to think that 500 is too expensive, no matter how much GOOG rallies from that level.

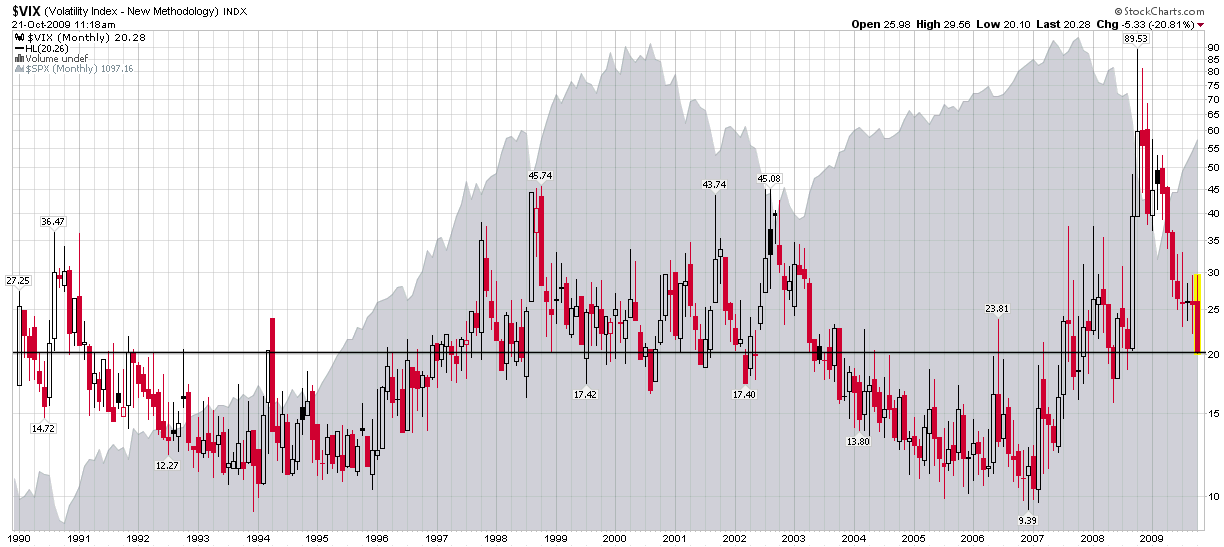
Turning to the VIX, not only have all those readings in the 30s, 40s and 50s been recently imprinted into the investor’s psyche, but so also has all the emotional turmoil associated with the financial crisis and stock market crash. Even if things are better, the argument goes, can they possibly be this much better so soon after the global financial system was teetering on the edge of a cliff? The short answer is that anchoring makes it difficult for many investors to adapt to new price ranges and a new set of circumstances as situations change. It is part of the reason why bulls cling to hope on the way down and perma-bears have difficulty changing their bias when the market bounces. Finally, it is why so many people seem to be incredulous that the VIX is almost down to 20.00 when the lifetime (20 year) moving average for the volatility index is 20.26. In terms of volatility, we are right at the VIX’s lifetime moving average, which means investors are pricing in an average amount of risk and uncertainty – in historical terms – at the moment.

Of course, if one were to be anchored in the last 12 months, the VIX would be at an all-time low. Conversely, if one were anchored in the period from 2004-2006, the VIX would be in the 99th percentile, almost at an all-time high.

So…pull up the anchor and set your sails for the new volatility environment.

[source: StockCharts]

Thursday, October 8, 2009

The Art of Doing (Almost) Nothing

Yesterday was a very strange day on the blog. For the first time in probably a year, I did not post at all on a trading day – and yet the blog set an all-time record for most hits in a single day.

Those seemingly incongruous two facts got me to thinking about my best day of trading. Ironically, on that day I did not make a single trade. Instead, I simply acted as a slightly bemused caretaker for several large positions that just happened to be moving in the right direction on the same day. As was the case with the blog, once again I did nothing and had my best results.

All this got brought me back to thinking about the trader development stage model and the importance of understanding how a trader spends his or her time. Is almost all of your time spent on researching “the next big thing” or uncovering penny stocks that are flying under the radar of the investment community? Do you obsess over every uptick and downtick of the stocks in your portfolio and check your portfolio balance even more often than you check for new email? If this sounds all too familiar, then I suspect you are mired in stage 1 of the trader stage development model and still have too much of a stock-centric view of trading.

A good trading day for me is one in which I make no trades. On those days I can devote almost my full attention to research and development. This means looking at things like new asset classes, new products, new exit rules, new strategies and new approaches to risk management. Next month my favorite strategies may stop working. While I have no idea which penny stocks may perform as well or better than my current approach, I already have a couple of promising strategies ready to be deployed that fit my personality, risk profile and strategic objectives.

So…how do you spend your trading day and what are the implications for long-terms investment success?

For related posts on this subject, readers are encouraged to check out:

Monday, October 5, 2009

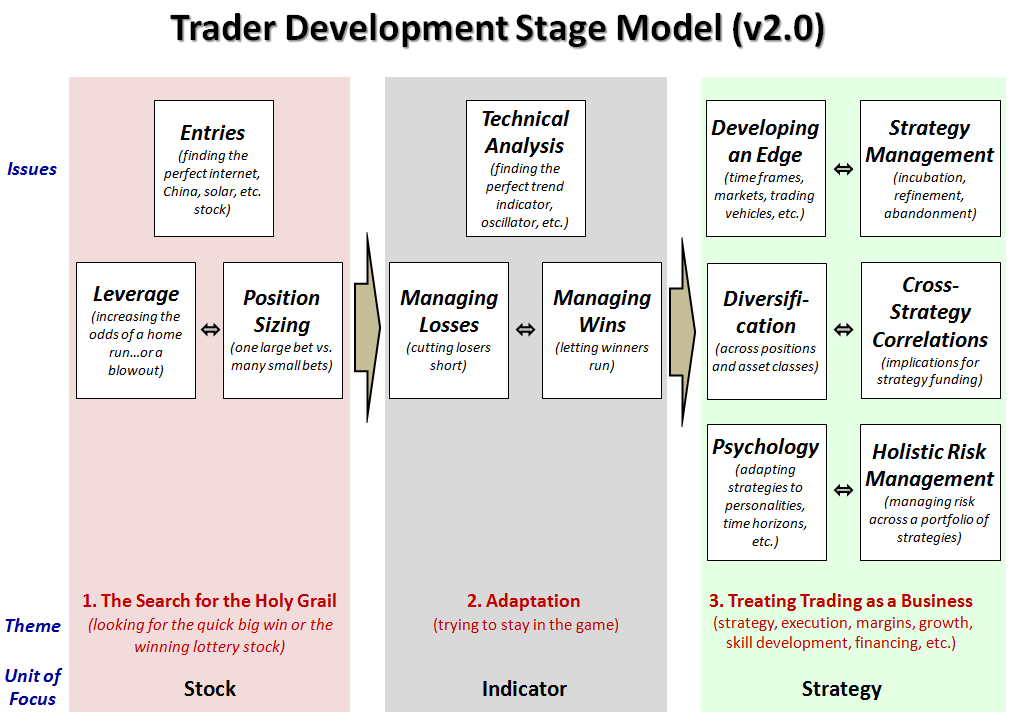
Trader Development Stage Model – Version 2.0

I was delighted to see the positive response to my draft trader development stage model, which I rolled out last Tuesday in a post with the unlikely title of Draft Trader Development Stage Model and put immediately to work in an option context in The Trader Development Stage Model and the Jump from Stocks to Options. Clearly this framework resonated with quite a few traders, from beginner to advanced.

With my penchant for not knowing when to leave something alone, I thought it might be helpful to expand upon the simplified version of the original trader stage development model and introduce a second version.

The graphic below adds only two new boxes (Technical Analysis and Strategy Management) to the original stage development model, but also adds some explanatory notes, labels for clarification (Issues, Theme and Unit of Focus) and further identifies each of the three stages with what I call Unit of Focus, but can also be interpreted as a Level of Abstraction or something similar.

As was the case the first time around, I am not going to spend too much time adding interpretive commentary other than to note that the two-way arrows represent tension between issues that are closely linked, sometimes because they compete with each other and other times because they are complementary. Also, while I never spelled it out the last time around, the background colors are meant to represent when the trader is likely losing money, breaking even and finally making a profit.

There is the potential to take this trader stage development model and get much more specific with it, use it as a diagnostic, etc. For now, the current level of detail is probably appropriate for most future applications I anticipate in this space.

As this is a mental model that is highly subjective, I would be glad to field to any feedback, criticisms, suggested enhancements, etc.

For more on the trader stage development model, readers are encouraged to check out:

Tuesday, September 29, 2009

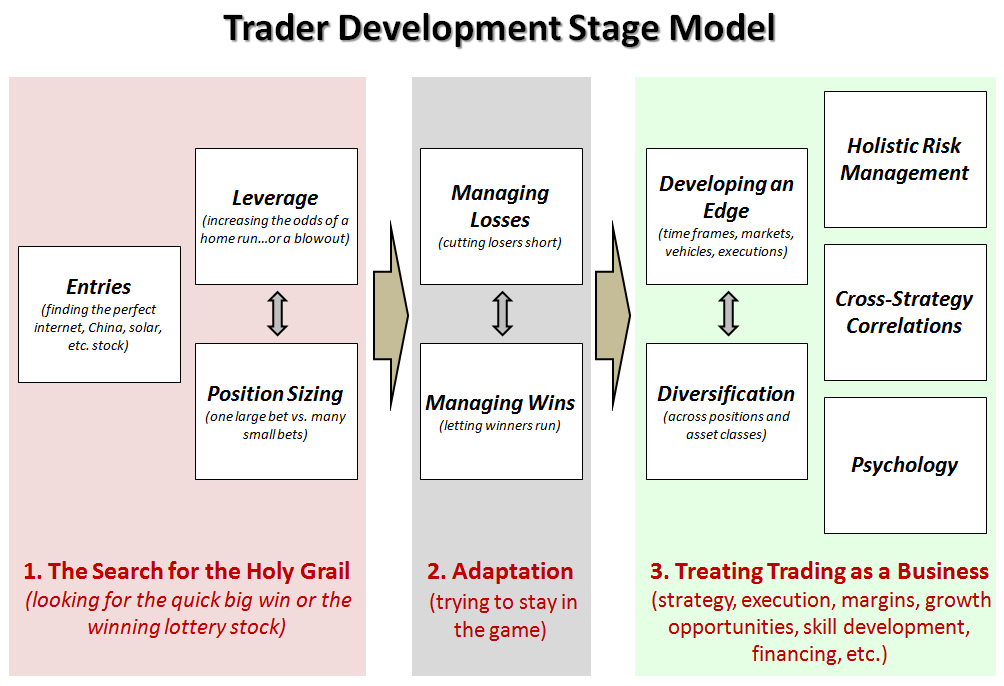
Draft Trader Development Stage Model

One of the under appreciated joys of blogging is the wide variety of people who you end up corresponding with across the globe – and whose paths would likely never have intersected my own had it not been for the blog.

Partly as a result of the blog, I have a better sense of what goes on in the heads of other traders, what issues they struggle with and how they do – or sometimes don't – overcome obstacles to success.

I have enough anecdotal evidence that suggests there is something of a typical development path that many retail traders follow as they grow and develop as traders. In an effort to start a dialogue about this and to give the blog a framework to refer back to in future posts, I thought I would post a draft of the mental model that is forming in my head.

Frankly, I am surprised I have not seen a similar graphic and if there is one out there, I would be interested to hear about it.

Keep in mind that as best I can, I have attempted to keep the model simple. Once the basics have been debated and reformed, then it is a lot easier to add in some of the complexity.

So…without further ado, I have appended below the first draft of the trader development stage model, which is hopefully relatively self-explanatory. Note that the vertical gray arrows are supposed to represent tension between related issues (leverage vs. position sizing, minimizing losers while maximizing winners, developing an edge vs. diversification.) Also, while I consider all the issues to be iterative, I suggest that the iteration process in the third stage is continuous.

As always, all feedback is appreciated.

Wednesday, September 16, 2009

Kafka, Surrealism and Trading

There are quite a few interesting stories breaking today, but since readers can find most of them somewhere else, I thought I might focus on a story many may have missed that I think is excellent fodder for short-term traders and long-term investors alike.

Science Daily has a thought-provoking piece out today with an intriguing title: Reading Kafka Improves Learning, Suggests Psychology Study. The article summarizes the findings of Travis Proulx and Steven J. Heine, whose Connections from Kafka: Exposure to Meaning Threats Improves Explicit Learning of Artificial Grammar is slated for publication in the September edition of Psychological Science.

Science Daily captures the essence of the research findings as follows:

“The idea is that when you're exposed to a meaning threat – something that fundamentally does not make sense – your brain is going to respond by looking for some other kind of structure within your environment,” said Travis Proulx, a postdoctoral researcher at UCSB and co-author of the article. “And, it turns out, that structure can be completely unrelated to the meaning threat.”

Proulx and Heine’s research demonstrate that subjects who were exposed to literature that was absurd, nonsensical or surrealistic performed much better when tested shortly thereafter for pattern recognition skills than control subjects who read similar material that was easy to comprehend.

So…how does this apply to trading? I am going to stretch the rather narrow conclusions drawn by Proulx and Heine and suggest that traders/investors need to get out of their comfort zones more often. They need to look at new asset classes they are unfamiliar with, new markets, new trading vehicles, new fundamental information, new chart patterns, etc. Perhaps they should even venture out from the comfortable realm of Mozart and Monet to Schoenberg and Dali.

Keep pushing the envelope and don’t worry if new pathways look chaotic at first. The more you get out of your comfort zone, the more that zone begins to widen and the better you will be at recognizing important patterns and opportunities across that zone.

Friday, August 28, 2009

The Other Side of Fear and Panic

Joshua Brown at The Reformed Broker has a nice piece out this morning (hat tip, Trader Mike) with the playful title of The Five Stages of Panic Buying. Brown illustrates each of the five stages with quotes from through the investment management world and in so doing has reconstructed something of a psychological history of the current bull market. Both bulls and bears are encouraged to click through to get a chuckle out of what has been going on in the head of investors for the past 5-6 months.

The underlying theme of all five stages is that on Wall Street, where annual bonuses are typically doled out based on performance relative to a benchmark, investment managers loathe the idea of falling behind that benchmark early in the year and having to play catch-up for the balance of the year. Particularly in a year when the market starts down then reverses sharply to the upside, one would expect that a large majority of investment managers would find themselves chasing performance, becoming more aggressive and taking on more risk in order to reel in the benchmark.

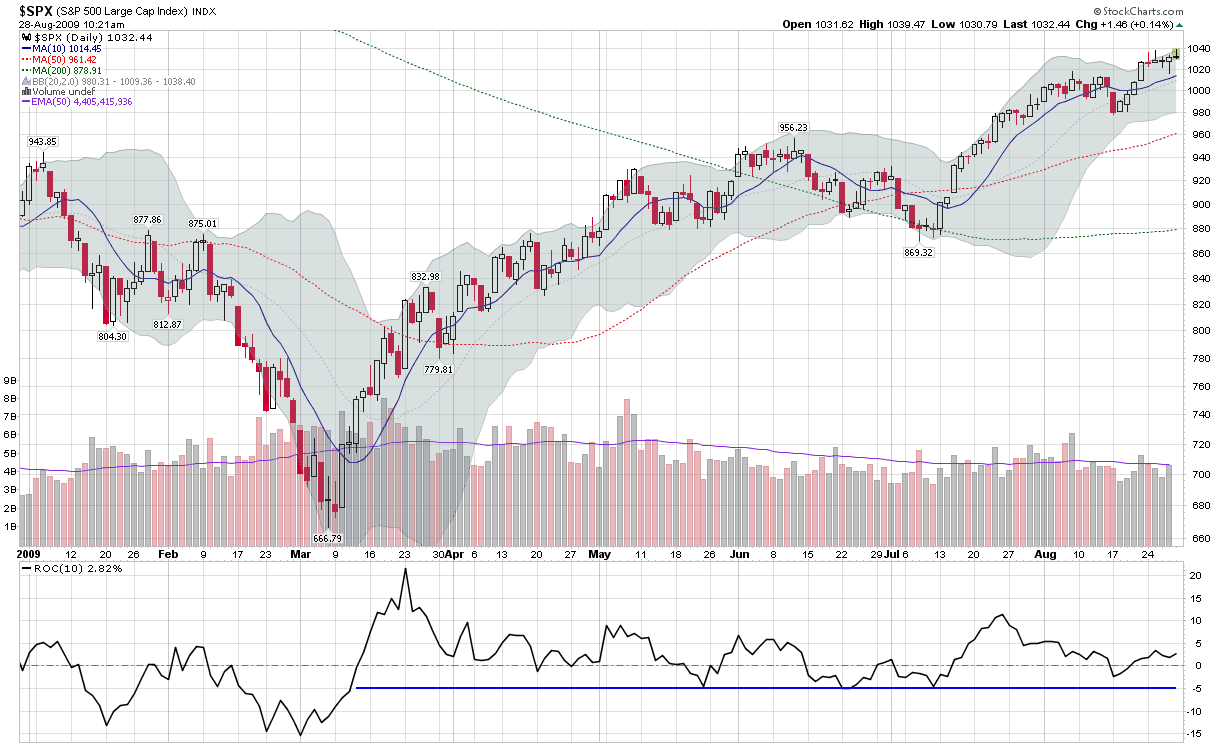
Of course, panic buying is not the flip side of panic selling. Panic buying favors the use of more derivatives, more leverage, more beta and less cash. It shows up on charts as aggressive buying on the dip, the failure of stocks to retrace earlier gains, etc. and is part of the reason why the 10 day rate of change (ROC) in the chart below has yet to fall below -5 (%) since the rally began.

What I find particularly interesting is that I believe panic buying is more likely to lead to crowded trades and ultimately to panic selling. There have not been many days in which we have seen big drops in the SPX and there has certainly been no extended weakness in stocks since the March bottom, but I suspect that when the market finally does turn, those same panic buyers will be quick to lock in gains in hopes of keeping pace with or finally overtaking the appropriate benchmark.

So…if we have many panic buyers who have been chasing performance with long positions of questionable underlying value, then the potential for some high volatility trading in the next month or so may be higher than recent stock market activity has led many to believe.

[graphic: StockCharts]

Tuesday, March 24, 2009

On Trading Rules and Guidelines

Last Friday’s post, Can Selling Options Make You a Better Trader? prompted quite a few emails and comments, including a request that I share some of my trading rules.

To be perfectly honest, I used to keep a list of trading rules handy to refer to at all times, but this is no longer the case. The rules are still valid, but after five years of full-time trading, I have retrained myself in the way I think about, react emotionally to and ultimately respond to the markets.

I do think, however, that the process of developing and codifying a set of trading rules and guidelines is one of the most important exercises that a new or inexperienced trader can undertake. Also, I firmly believe that veteran traders should constantly be evaluating their beliefs about the markets they trade and the guiding principles that provide the basis for various approaches to trading.

Before I decided to make trading a full-time business, I sat down and attempted to capture most of my beliefs about the markets. I originally started out with about 80 "axioms" (beliefs would probably be a more accurate term) and as I traded, I added to this list.

Originally I grouped my axioms/beliefs into the following categories:

  • Overriding Principles
  • Market Technical Analysis & Sentiment Indicators
  • Stock Selection - General (long-term, swing and day trading)
  • Stock Selection - Day Trading
  • Stock Selection - Shorts
  • Opening a Position
  • Taking Profits
  • Taking Losses
  • Pre-Market Activities
  • Intraday Activities
  • Post-Market Activities
  • Risk Control and Drawdown Rules

After a year or so of trading, I found that I had standardized on about 15 rules/guidelines that have changed only slightly since then.

As requested, here are ten overriding principles that have survived the past five years, through bull and bear markets:

  1. Always live to fight another day
  2. Entries must have a statistical edge
  3. Patience and discipline
  4. Be a jellyfish (swim with the current)
  5. Trade only liquid securities
  6. Focus on trying to capture the middle 80% of a move
  7. Know your exit points when you open a position (and stick to them!)
  8. When in doubt, reduce position size by 50%
  9. Limit losses to 2% of total equity for any single trade
  10. Start each day with a clean financial and emotional slate

The above list is relatively generic, but it helped provide me with a framework for organizing how I would approach trading as a business, what strategies I should adopt, how those strategies should be executed, and ultimately defining what success should look like.

Trading rules are vitally important – as is knowing when they should be broken. Even more important, I believe, is the process that one goes through in order to arrive at these rules and to make sure that as new market situations unfold and new blind spots are revealed, the rules and guidelines are enhanced to maximize the opportunity for the trader to continue to grow and develop.

Friday, March 20, 2009

Can Selling Options Make You a Better Trader?

I used to have a list of trading rules guidelines taped to my monitor. The list went through several iterations, but near the top were always reminders that a good trader needs “patience and discipline” to be successful. The list is no longer there, but by now the important ideas have been branded into my psyche.

On a related note, over the course of the past few years I have increasingly gravitated toward trading options. More often than not I find myself selling options, either with or without a directional bias, and enjoying time decay (theta) work in my favor to increase my portfolio value. Recently, it occurred to me that selling options has made me a better trader because it has cut down on the number of trades I make and enhanced my patience and discipline. How does this happen? Each morning I look at my portfolio and see what my portfolio’s aggregate theta is. This tells me how much money I will make from time decay alone if the market does nothing and I do not make any trades. As a rule, I try to structure my portfolio so that the aggregate theta is at least as large as my daily profit target. For this reason, I never rarely feel obligated to “make something happen” and force trades that should not be taken.

While there are many approaches to trading, I believe that every trader should be comfortable trading long positions and short positions, buying options and selling options. Better yet, traders should not have a built in bias toward long-only trading or only buying calls. Ideally, a trader should be directionally agnostic and equally comfortable with the full menu of possible trades.

Ultimately, a considerable amount of trading success comes down to the “know thyself” dictum. A trader that understands his or her personality type, comfort zones and preferences can do a better job of applying the appropriate psychological approach to trading. These skills are some of the most difficult for many traders to master. It is quite possible that selling options may provide a shortcut to developing some of those skills.

For more on applying psychology to improve your trading, the best resource on the web is undoubtedly Brett Steenbarger’s TraderFeed.

For more on theta and time decay, check out Theta, an excellent overview of the subject at Know Your Options, a promising new options blog authored by Tyler Craig.

Monday, March 9, 2009

Easy vs. Hard Bottoms

Today the major market indices have been fluctuating on both sides of Friday’s close, occasionally flirting with a short-covering rally only to make a hasty retreat and begin what looks like the beginnings of another bull whipping.

Last Thursday I stuck my neck out and said, “with the SPX at 687 as I type this, we are very close to an intermediate-term bottom.” Frankly, I envisioned a more impressive bounce than the current situation, which still has the SPX treading water at 687. A question that is worth pondering, however, is what type of bottom is most likely to stick. Sure, a 300 point jump in the DJIA is likely to attract some additional money on the long side, but it is also likely to further embolden many of the shorts. In the current market environment, I would call that type of V-shaped bottom an “easy bottom” and suggest that the shorts are not likely to let the current bear buffet end with one sharp move. The easy bottom is more likely to be yet another bull trap.

Compare an easy bottom with a hard-fought one. Instead of the 300 point jump that brings the markets more than a white knuckle distance away from the edge of a cliff, imagine a market in which every point becomes a matter of trench warfare, with some territory changing hands dozens of times between bulls and bears before bulls can finally lay claim to infinitesimal victories. These will be largely moral victories at first, but over the course of time as a war of attrition develops, many small gains will eventually add up to momentum. Said another way, I do not believe the bears will throw in the towel all at once, but will slowly lose interest as the pickings become slimmer.

So…as much as an SPX back over 700 might seem to give that devilish 666 bottom the best chance of holding, I believe that the hard bottom is more likely to hold than the easy bottom.

Wednesday, August 13, 2008

Sports, Emotions and Trading

When I wake up each morning, I take a drink from the blogosphere news fire hose in order to get caught up with what is going on in the world and to get a sense of how some learned minds are thinking about these and other developments. I find this process puts a lot of random ideas in front of me in a short period of time and often leads to some interesting juxtapositions that help stimulate my own thinking.
This morning had just one of those juxtapositions. First, in Olympics and Stocks Don’t Mix, Mark Hulbert cites the work of Edmans, Garcia, and Norli (“Sports Sentiment and Stock Returns”) which shows how World Cup soccer losses translate into significantly poorer performance in the local stock market the next day.

Hulbert weaves this research into his own observation:

“In my experience, few investors even recognize the role that their emotions play in their decision-making. When challenged, they are able to point to a litany of reasons, all well documented, for why their strategy is strongly based on a sound statistical foundation. But, most of the time, I still don't believe them.

That's because there are different types of reasons. On the one hand, there are the reasons that genuinely account for why we have decided to do something. And, on the other hand, there are the reasons that we turn to, after a decision has been made, to justify it to ourselves and others. Most of the investment reasons that I hear or read about are of the latter variety.“

Right after Mark Hulbert, I stumbled onto Brett Steenbarger’s A Dozen Thoughts on Trading Stress and Emotion. Frankly, I don’t recall ever having seen a short list that has so much for traders to chew on in the realm of “Know Thyself.”

There are many ways to look at the markets and how you interact with them, but one should never underestimate the emotional component on both sides of that equation.

DISCLAIMER: "VIX®" is a trademark of Chicago Board Options Exchange, Incorporated. Chicago Board Options Exchange, Incorporated is not affiliated with this website or this website's owner's or operators. CBOE assumes no responsibility for the accuracy or completeness or any other aspect of any content posted on this website by its operator or any third party. All content on this site is provided for informational and entertainment purposes only and is not intended as advice to buy or sell any securities. Stocks are difficult to trade; options are even harder. When it comes to VIX derivatives, don't fall into the trap of thinking that just because you can ride a horse, you can ride an alligator. Please do your own homework and accept full responsibility for any investment decisions you make. No content on this site can be used for commercial purposes without the prior written permission of the author. Copyright © 2007-2023 Bill Luby. All rights reserved.
 
Web Analytics