The Gap Between the VIX and Realized Volatility
Since making an all-time closing high of 80.86 on November 20th 2008, the CBOE Volatility Index (VIX) has been declining in the direction of its historical mean of 20.22. While the initial drop in the VIX took it rapidly from 80 to the 40-50 range, it took some time before investors began to gain confidence that the March lows in stocks were going to be the bottom. Once the consensus began to build around the likelihood of a bottom and a historic buying opportunity in stocks, the VIX began a steady descent that has taken it all the way down to the mid-20s.
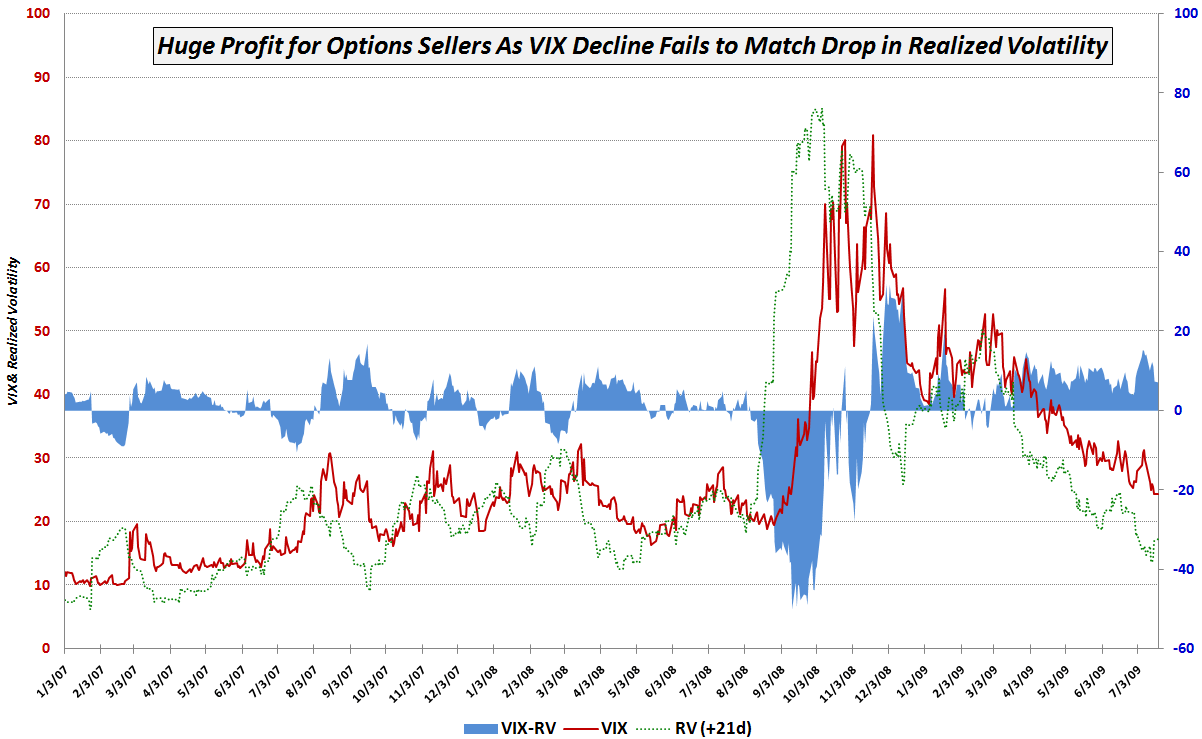
As the chart below demonstrates, as rapidly as the VIX (red line) has been able to fall, it has not managed to keep up with the decline in realized volatility. The chart records the closing VIX value for each day as well as the 21-day realized volatility (dotted green line) that results from calculating 21-day historical volatility 21 trading days into the future. These calculations allow an options buyer or seller to determine the extent to which the VIX (which looks forward 30 calendar days) accurately predicted the realized volatility that occurred during the next 21 trading days or approximately 30 calendar days. The differential (VIX-RV) is plotted as the blue area.
One of the key takeaways from the chart is that at least during the last 2 ½ years, the VIX frequently has been a poor estimator of future volatility. During the October 2008 portion of the financial crisis, the VIX often underestimated future volatility by 30-40 points. Since November, however, the VIX has been consistently overestimating future volatility. In fact, not since February 27th has the VIX expectation of future volatility turned out to be lower than realized volatility 21 days hence.
In other words, if you had been selling SPX options every day since the beginning of March, the dramatic decrease in implied volatility would have almost guaranteed that every day would have been a winning day.
[While I have generally avoided using the term “realized volatility” here, it is synonymous with historical volatility, statistical volatility and actual volatility. All these terms reflect the conventional way of calculating the volatility of a series of changes in price, which is essentially done by taking the natural log of the ratio of daily price changes relative to the mean value for the data series. To the extent that I can avoid confusion, I will try to standardize on using ‘historical volatility’ when looking backward from a specific date and ‘realized volatility’ when looking forward from a date in which there are more recent historical data from which to derive the calculations. For the record, there are actually several ways to calculate historical volatility and one of these days I will finally get around to a series of posts on historical volatility, starting with the calculations…]
For related posts on this subject, readers are encouraged to check out:
- Historical Volatility Continues to Plummet
- Extremes in the Spread Between the VIX and the 20 Day Historical Volatility in the SPX
- On Measuring Volatility


4 comments:
great post bill--it definitely spawns a lot of ideas. ie what are spy returns following an underestimation bias with an n-days or months looback vs an overestimation bias.
two thumbs up!
dv
Thanks, David.
I have the return data and should be posting some of that in a follow-up post soon (assuming I can keep track of all the follow-up posts I have promised and need to deliver on...)
Cheers,
-Bill
This is a bit off topic, but did anyone notice what happened with the VIX futures/options settlement this morning? The August settlement was 28.76. The trading of the corresponding SPX options series, struck me as extremely unnatural. For example, the SPX calls traded all the way up to a strike of 1650. At the moment, the highest strike for which there is a bid is 1200. Similarly, some of the out of the money puts traded at insane prices. And again, the current bids are not even close to the bids this morning.
I don't think that the brief drop in the market can explain this behavior. Before the market really started to recover and almost instantly after the open, the VIX dropped to more reasonable levels. Clearly, it's not coincidence that there was a brief surge in SPX option prices this morning.
I'll agree that realized vola has been lower than implied vola.
But to imply that it's been easy street selling spy options is a stretch. It's highly conditional on strike price,timing etc; as most propositions in trading usually are.
Post a Comment