SPX at Post-Lehman Fib Retracement Target of 1035-1037
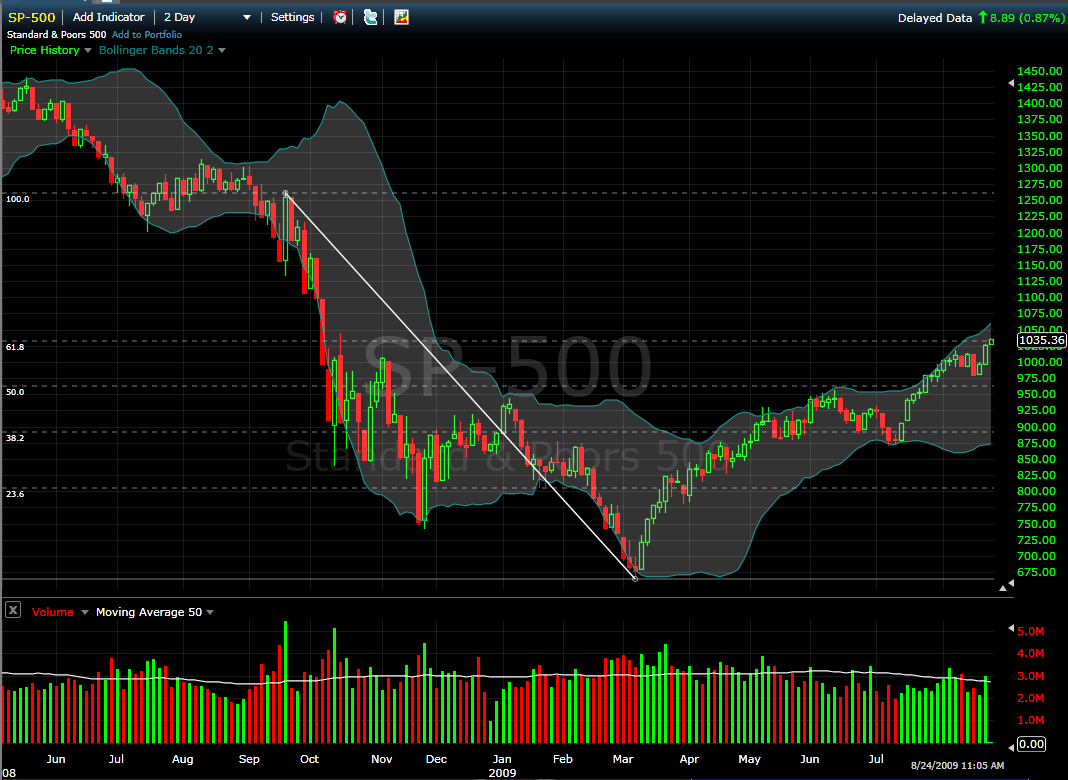
There have been several posts (see below) in this space that have addressed the issue of Fibonacci retracements in the S&P 500 index. In the dialogue, I have been a proponent of using a post-Lehman high in conjunction with the March low to arrive at a set of post-Lehman Fibonacci retracement numbers. Depending upon whether one uses just the real bodies of the candlestick (open and close) or includes the shadows (adds intraday highs and lows), the 61.8% retracement of the post-Lehman high falls in the range of 1035 to 1037.
A short while ago, the SPX established a new high for the year of 1035.82, which puts it right at the post-Lehman Fibonacci retracement target price, as shown in the chart below, which uses relatively unusual two-day candles.
I have been waiting patiently for two or more consecutive days of weakness and/or a 5% pullback from the highs to open up some aggressive short positions. With the Fibonacci retracement target hit, I am now more likely to start to scale into some short positions early, assuming we start to see some sort of meaningful weakness in stocks this millennium…
For some related posts on the SPX and Fibonacci retracements, try:
- Dueling Fibonaccis for the SPX
- SPX and Fibonacci Resistance at 966
- Open Thread: Do Fibonacci Retracements Work?

[source: FreeStockCharts.com]


4 comments:
My only issue with this is that the selection of the top seems a bit arbitrary - I've used the market high as my start for the fib and that called for a retracement at around 1016.
Hey Damian,
Not surprisingly, I have had this discussion several times and your point is certainly a valid one. As a result, I presented two alternative Fibonacci interpretations in Dueling Fibonaccis for the SPX.
In short, my contention is that the the macroeconomic picture changed so much post-Lehman that it is valid to think of a bifurcated TA landscape as well.
I have been ruminating about and writing about a "post-Lehman" world since at least early December and it has become so hard-wired into my thinking that I wanted the charts to reflect that cutoff point.
I do think that some Fibonacci analysis decisions are highly discretionary. Ultimately I decide how valid they are based upon how much the support and resistance lines seem to match market behavior. So far, I think the use of the end of September high has held up well and if today turns out to be a top with some staying power, I will stick to the post-Lehman approach. If not, I will have to roll back to an earlier top: Oct '07, May '08 or Aug '08.
Thanks for the comments.
Cheers,
-Bill
The S&P 500 December futures rallied from August 19th intraday low of 974 to yesterdays close of 1021.6 without a down day. The S&P futures closed above the top of their Bollinger bands for two consecutive days. It should be interesting to see how much longer the S&P futures can continue to trade above the top of their Bollinger bands and if they will fail to rally above the post-Lehman Fibanacci retracement target area of 1035-1037.
The contrarian reliability of a few peoples recommendations can be very accurate since they recommended put options very close to last Wednesdays lows. Some professional traders may have technical indicators that come close to the contrarian relability of these people.
Post a Comment