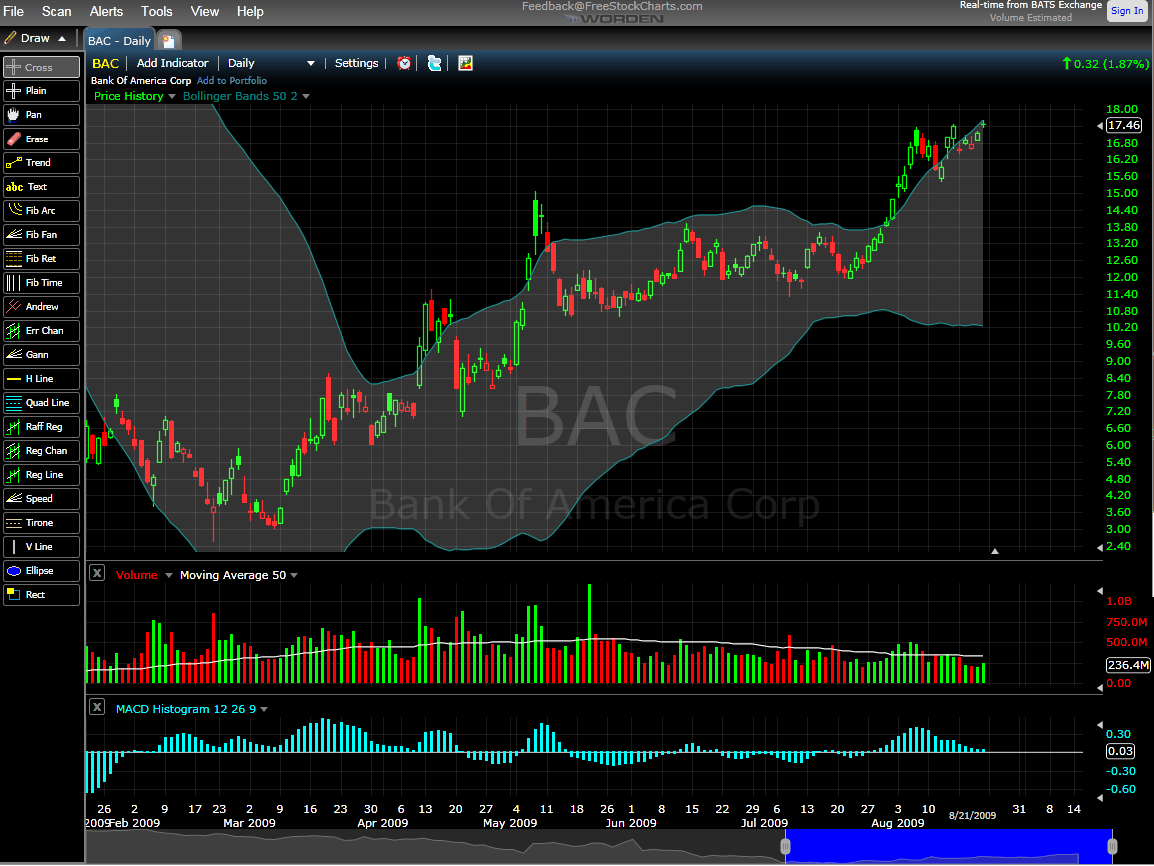
Chart of the Week: BAC Through the Eyes of FreeStockCharts.com
It has been almost six months since I have mentioned banks in the chart of the week, the so it seems as if the statute of limitations for beating dead horses has probably passed and I can talk about Bank of America (BAC) once again.
In the past few weeks, many traders have taken to using Bank of America as their market weather vane, reasoning that as Bank of America goes, so go the banks and as the banks go, so go stocks in general. For the most part, this rationale has held up and anyone who has used Bank of America to gauge the direction of the markets has likely done quite nicely. Of course, investors who were fortunate to have grabbed some BAC shares when the stock was trading below 4.00 have now seen their original investment turn into a five-bagger in just five months.
The chart below also marks the first time I have used a chart from FreeStocksCharts.com on the blog. This relatively new web site is a Worden Brothers venture – which means that it comes from the same people behind the popular TeleChart charting program. Another Worden Brothers product is StockFinder and if you are familiar with StockFinder, then you already know FreeStockCharts.com, which resembles an online incarnation of the former. In the graphic, I have captured some of the drawing tools (which include some fairly exotic tools), available at FreeStockCharts.com. There are also 52 customizable indicators (again, not just the basics), an alert function and other features of interest. In one of the great investing oxymorons, there is also a premium version of FreeStockCharts.com, with fees that are competitive with StockCharts.com.
As a StockCharts subsciber, it would take a great deal for me to switch to another charting program, but FreeStockCharts.com certainly looks like a compelling alternative at first blush. At the very least, it can provide a different color scheme and set of indicators for the blog…
For some related posts, try:
- StockCharts.com Charts on the Blog
- Chart of the Week: Bank of America Teeters
- Chart of the Week: Four Good (?) Banks
- Good Luck Getting a Mortgage Here…

[source: FreeStockCharts.com]


6 comments:
Hi,
Thanks for the info on freestockcharts.com. I am looking for a site [fine even if it is subscription based] that can give results if I search for something with criteria like "show me stocks where 3 day Moving average crossed below 10 day moving average, with average volume 250000".....
You can do that with FreeStockCharts.com permium addition ($14.99/mo if you pay annually).
Oxxo,
In addition to FSC.com, There are a number of sites that do this, including StockCharts.com and StockFetcher.com. At the very least, you should check these sites out.
Cheers,
-Bill
It only works if you are willing or able to run silverlight. It looked so promising, it's a shame it wasn't created with something everyone could use.
Another Silverlight option is www.zignals.com, an Irish start-up firm I work for. There you will find free stock charts, stock alerts, stock screener and multi-currency portfolio manager. A significant update is due at the end of September but you can currently set up MA crossover and volume alerts on a list of stocks for free.
Everything available on the site is free and will remain free, without the hidden charges of Freestockcharts.com.
The business model will launch later in the year.
Best wishes,
Declan
It's hard to believe that Microsoft (backers of Zignals) would make such an irresponsible comment and slander FreeStockCharts.com.
Post a Comment