Friday, July 30, 2010

LSC Long-Short Commodities ETF Struggling Mightily

Launched in June 2008, the ELEMENTS S&P Commodity Trends Indicator ETN (LSC) was an immediate hit with retail investors, attracting a considerable volume, offering diversification from an equity-heavy portfolio and even using a long-short approach to take advantage of both bullish and bearish trends in commodities. By the end of the 2008, the ETF was already up more than 6%.

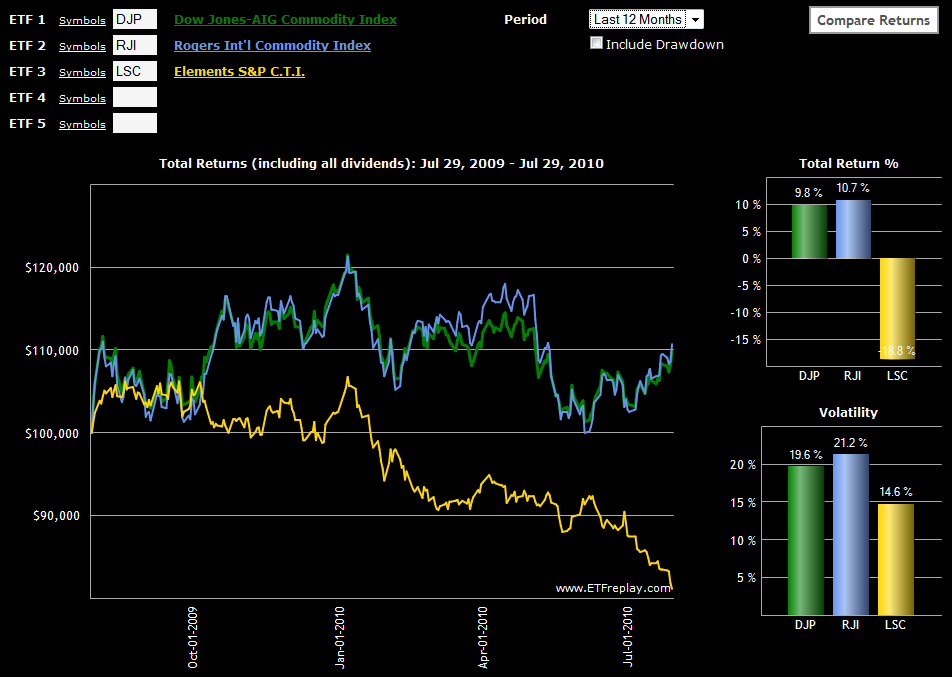
Unfortunately, since the end of 2008 the ETF has been steadily losing ground and is now down 44% from its 2008 high water mark. The graphic below, from ETFreplay.com, shows LSC’s performance relative to broadly diversified commodity ETFs, RJI and DJP over the course of the last year. While the graphic alone may make LSC appear to be an attractive short, I think it is important to note that the prospectus has historical data going back to 2001 which shows excellent long-term performance characteristics.


A look under the hood shows that LSC’s trend following approach uses a 7-month exponential moving average (EMA) to evaluate trends in the following 16 commodity futures contracts:

  • Wheat (CBOT: W)
  • Corn (CBOT: C)
  • Soybeans (CBOT: S)
  • Cotton (NYCE: CT)
  • Cocoa (CSCE: CC)
  • Sugar (CSCE: SB)
  • Coffee (CSCE: KC)
  • Live Cattle (CME: LC)
  • Lean Hogs (CME: LH)
  • Copper (COMEX: HG)
  • Gold (COMEX: GC)
  • Silver (COMEX: SI)
  • Heating Oil (NYMEX: HO)
  • Light Crude Oil (NYMEX: CL)
  • RBOB Gasoline (NYMEX: XB)
  • Natural Gas (NYMEX: NG)

Based on where the commodities are relative to the EMA, the ETF will go long or short, or have a neutral position. The one exception is crude oil, where the ETF is only allowed to be long or flat. The prospectus lays out the rationale for the short restriction on crude oil as follows:

Energy, due to the significant level of its continuous consumption, limited reserves, and oil cartel control is subject to rapid price increases in the event of perceived or actual shortages. For example, although a problem of this magnitude has not occurred historically, if the Index were capable of shorting the energy sector and a catastrophe occurred which caused Light Crude prices to surge dramatically while the energy Sector allocation was set to short, the Index would lose a significant portion of its value on the Light Crude position alone. Because no other sector is subject to the same continuous demand with supply and concentration risk, the energy sector is never positioned short in the Index.

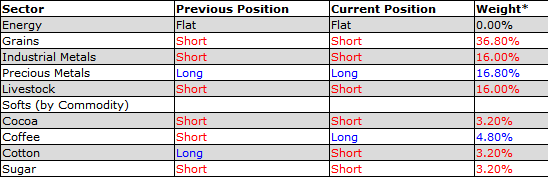
LSC evaluates all futures contracts at the end of each month and makes any new long-short decisions at that time. The current (July) positions of LSC are as follows:


Those interested in additional information on LSC should try:

Going forward, I think the “…and More” portion of this blog will begin to place increased emphasis on the commodity space, including ETFs, futures and options on commodities.

As an aside, there are two new ETF sites that have recently launched which offer a great deal of promise to ETF investors:

For more on related subjects, readers are encouraged to check out:

[sources: ETFreplay.com, ELEMENTS/Merrill Lynch]

Disclosure(s): short LSC at time of writing


Thursday, July 29, 2010

Direxion and S&P Bring Dynamic Volatility Hedging to ETFs with VEQTOR

As the ETF space continues to evolve and push into new territory, such as strategy-in-a-box ETFs and more actively managed ETFs (e.g., QAI, ALT, PQY, PQZ, GVT, PSR, RWG), it was only a matter of time before a volatility play was added to the pool of actively managed ETFs.

Credit Direxion with being the first to venture into the realm of actively managed ETFs with a strong volatility component. In a recent SEC filing, Direxion unveiled plans to launch an intriguing new ETF under the name of S&P 500 Dynamic VEQTOR Shares. This ETF will seek to track the S&P 500 Dynamic VEQTOR Index, which was launched by S&P back on November 18, 2009.

So far, so good.

Here is where it gets interesting. The VEQTOR index (and ETF) have three components: equity (S&P 500); volatility (S&P 500 Short-Term VIX Futures Index, aka VXX) and cash. Based upon several rules and formulas, the index attempts to derive – on a daily basis – the ideal target volatility allocation. This is accomplished by evaluating realized volatility and implied volatility, determining the implied volatility trend (using 5-day and 20-day IV moving averages) and arriving at a target index volatility allocation based on realized volatility and implied volatility data. Once the target volatility allocation has been determined (the range is from 2.5% to 40.0%), the balance of the index is populated with the S&P 500.

Just to make things more interesting, the VEQTOR index also has a stop loss provision which specifies that if aggregate losses during any five day business period are 2% or higher, the index will move into a 100% cash position.

When the VEQTOR ETF is launched, I will have a lot more to say about this fascinating product. In the meantime, those interested in additional information on the VEQTOR index and ETF should try:

For more on related subjects, readers are encouraged to check out:

Disclosure(s): neutral position on VXX via options at time of writing

Wednesday, July 28, 2010

SPX Range-Bound Chart

Further to yesterday’s Leveraged ETFs, Volatility and Range-Bound Markets as well as my take on The Elusive Trading Range from mid-June, I thought I would share a chart I included in last week’s subscriber newsletter.

The chart below captures daily bars of the SPX going back six months. It includes Fibonacci retracement levels based on the April SPX high of 1219 and the July 1st low of 1010. I have also added secondary support and resistance levels (black dotted lines) at 1065 and 1170 and have shaded the center of the Fibonacci zone (38.2% to 61.8%) in what looks like a salmon color (hey, it’s lunch time.) In addition to the SPX support and resistance lines, the study below the main chart is of the McClellan Summation Index (NYSI), a measure of market breadth, which shows more strength than has been reflected in just the recent price action.

My working hypothesis continues to be that we are in a trading zone that have been and will likely continue to be defined by some of the support and resistance levels on this chart. If this turns out to be the case, even with the VIX at what is now almost a three month low, straddles, strangles, butterflies and condors can still be attractive trades.

For more on related subjects, readers are encouraged to check out:


[source: StockCharts.com]

Disclosure(s): none

Tuesday, July 27, 2010

Leveraged ETFs, Volatility and Range-Bound Markets

I noticed that Direxion, the dean of triple ETFs, has added a handful of tools to their web site recently. These include:

While all five of these tools (plus several more that are specific to Bloomberg users) are helpful for understanding how leveraged ETFs work and what to expect from them, the one that I am drawn to is the volatility tool, a snapshot of which is appended below.

If you are one of those investors who see the potential for range-bound trading in stocks and the possibility of entering The Elusive Trading Range, then straddles, strangles, butterflies and condors on leveraged ETFs are one way to capture greater premium than betting on a lack of movement in an unleveraged underlying.

Unfortunately the Direxion volatility tool is limited to 10, 30, 90 and 180-day volatility look back periods. Even more disappointing is that the source data are stale. Right now the volatility numbers are calculated on the basis of the June 30th close. Using a good options broker or options data provider, one can build their own leveraged ETF watch list and get real-time implied volatility, etc., but kudos to Direxion for taking a small step to address some of the concerns that have been raised about leveraged ETFs in recent months.

For more on related subjects, readers are encouraged to check out:


[source: Direxion]

Disclosure(s): none

Monday, July 26, 2010

VXX Calls Attracting Interest

Since their launch just two months ago, options on the iPath S&P 500 VIX Short-Term Futures ETN (VXX) have attracted a robust following and have averaged about 20,000 contracts per day. During that period, approximately 2/3 of the VXX options transactions have involved calls.

Action in VXX options has heated up substantially in the past week, with record call volume last Tuesday and again today, as the Livevol chart below shows. Perhaps more importantly, call transactions as a percentage of all options transactions has spiked to a new all-time high of 78%, indicating that investors have become increasingly insistent that volatility is due for a rise.

So far at least, the VIX has refused to cooperate, closing today at 22.73, a 12-week low.

With VIX front month and second month futures settling at 25.55 and 28.75 today, respectively, the gap in the VIX futures used to calculate VXX has jumped to 3.20, reflecting a strong contango rip tide (the “headwind” metaphor has a vacation day today…) and substantial daily negative roll yield.

Looking at the chart, previous instances of VXX call spikes (green columns at bottom) have tended to coincide with tops in VXX. If the smart money is piling into long VXX calls this time around, it looks as if they are already underwater. With implied volatility just under 65, time decay is at least as much of a threat to long VXX calls as contango. The chart patterns have me wondering if there is a little desperation in the air that may be triggering some revenge trades in VXX.

As always, caveat emptor.

For more on related subjects, readers are encouraged to check out:


[source: Livevol Pro]

Disclosure(s): neutral position on VXX via options at time of writing; Livevol is an advertiser on VIX and More

Chart of the Week: Intrade and Control of the House of Representatives

With everyone else thinking about double dip recessions, European bank stress tests and the like, my thoughts have wandered to the next U.S. elections, which are barely three months away.

While there are a number of key questions that will be strongly influenced by the composition of Congress following the November elections, the fundamental question is which party will hold the majority of seats in the House of Representatives when voters have a chance to voice their opinions.

For those who are interested in a seat-by-seat, poll-by-poll perspective on the election, RealClearPolitics.com is a great place to start. Those like me who are more interested in assigning probabilities to the overall outcome may prefer to keep an eye on Intrade.com, the prediction market site.

One of the more active contracts at Intrade is based on whether the Republicans will wrest control of the House from the Democrats in November. The chart of the week below is structured to pay off on the basis of that outcome. The chart shows that the collective wisdom of the crowds put the odds (contract price roughly matches the odds of an event happening, just as the delta of an option roughly matches the probability of finishing in the money at expiration) of a Republican victory in the area of 15% at the time President Obama was sworn in back in January 2009. The odds moved over 50% for good about a month ago and currently stand at 55.1%.

With many political and economic issues of great importance facing the U.S. in the next year or two, the composition of the U.S. House of Representatives will have a great deal to say not just about fiscal policy, but about a broad range of influences across the financial landscape.

Of course, if you prefer to speculate on whether California will legalize marijuana, Rutgers will join Big 10 Conference or Rod Blagojevich will plead guilty or be found guilty of corruption, then Intrade is a good spot to do that too…

For more on related subjects, readers are encouraged to check out:


[source: Intrade.com]

Disclosure(s): none

Thursday, July 22, 2010

XXV and the New VIX ETN Landscape

While I was out of pocket for a few days, Barclays had the temerity to launch a new VIX ETN. Not only that, but this new volatility product is the first inverse VIX ETN to hit the market. It goes by the formal name of Barclays ETN+ Inverse S&P 500 VIX Short-Term Futures ETN and has a ticker of XXV.

Others have already weighed in on XXV, including excellent coverage of the potential of this ETF from Adam Warner at the Daily Options Report, particularly in To Err is Blog-Human and XXV Finale. Another interesting post comes from Volatility Futures & Options and attempts to reconstruct the historical performance of XXV in XXV – Inverse VXX ETF First Day of Trading. Not to be outdone, Ron Rowland of Invest with an Edge asks some pointed questions of the branding approach at Barclays in XXV: Barclays Abandons iPath Brand with Inverse Volatility ETN.

Frankly, there are a lot more questions than answers for XXV at this stage. My initial impression, however, is a positive one. Both VXX and XXV are ideally suited for the day trading crowd and are useful for swing trades of several days or so. As far as longer holding periods are concerned, I am partial to XXV over VXX, as XXV should benefit from the same term structure rebalancing anomalies that have plagued VXX and have resulted in negative roll yield. In the case of XXV, the daily portfolio balancing should be a net plus over the course of long-term holding periods.

Several more VIX ETNs are in the works. In the graphic below, I attempt to outline the VIX futures (with the VX prefix) and ETN landscape, along with the two SPX implied volatility indices. Note that the volatility indices (VIX and VXV) both have a constant duration, as do the VIX ETNs: VXX; VXZ; and XXV. The duration of the VIX futures, however, decreases one day at a time (and jumps forward on weekends and holidays), which means that their time horizon continues to decline over the course of each VIX options (and futures) expiration cycle, which are represented by the large green arrows in the graphic. The bottom line is that when you have constant duration products, such as the VIX ETNs, which are priced off of declining duration products (VIX futures), then there will always be friction from the result of the portfolio rebalancing used to maintain a constant duration. The exact impact of the rebalancing depends upon whether the VIX futures are in contango or backwardation and the slope of the term structure. As a rule of thumb, the ETNs with the shortest duration (to the left in the chart below) will be impacted the most by contango and backwardation, while the ETNs with the longest duration (to the right) will be affected to a smaller degree by roll yield.

Finally, it is important to note that more VIX ETNs are on the way. The Jefferies S&P 500 VIX Short-Term Futures ETF (VIXX) targets a constant 30-day duration and has a great deal in common with VXX, while Bank of America’s Investable Volatility Index ETN (no ticker designated, to my knowledge) appears to be targeting VIX options (a first for this product category) with an average maturity of five months. CBOE has some skeleton information on their Investable Volatility Index (VOL), but I look forward to more digging up more details on the forthcoming ETN and sharing them when I do.

For more on related subjects, readers are encouraged to check out:


Disclosure(s): long XXV and short VXX at time of writing

Wednesday, July 21, 2010

Expiring Monthly July Issue Recap

Personal and technical issues have conspired to keep this blog quiet for a few days, but that is about to change.

Before I get back to regular posting, I wanted to inform Expiring Monthly readers and potential new subscribers that Monday marked the publication of the July issue of Expiring Monthly: The Option Traders Journal.

The July issue is rich in volatility content. Among my favorite volatility-centric articles are a piece from Adam Warner on the VIX term structure and contango, a thought-provoking discussion of how retail traders influence options volatility by Jared Woodard, and Mark Wolfinger’s review of Euan Sinclair’s excellent book, Volatility Trading. My main contribution this month comes in the form of an article on VIX call backspreads in “An (Almost) Free VIX Disaster Protection Play.” I also detail some of my thinking and analysis of VIX futures contango as it applies to VXX in the “Ask the Experts” Q&A section.

In this month’s feature article, Mark Sebastian addresses the not-so-simple question of whether options are a zero-sum game. Mark also interviews renowned author Charles Cottle.

I have attached a copy of the Table of Contents for the July issue below for those who may be interested in what this magazine is all about. Subscription information and additional details about the magazine are available at http://www.expiringmonthly.com/.

For more on related subjects, readers are encouraged to check out:


[source: Expiring Monthly]

Disclosure(s): I am one of the founders and owners of Expiring Monthly

Thursday, July 15, 2010

VVUS as an Option Pricing Case Study

Trading in Vivus (VVUS) is halted this morning, as the biotechnology company’s new weight-loss pill, Qnexa, is being reviewed by a panel of experts at the FDA.

In many respects biotechnology stocks – particularly those which do not yet have products that are commercially available – are options dressed up as stocks. More than other sectors, a biotechnology stock is a company that is a portfolio of options on all the projects (drugs) that are in the research and development stage, plus commercial products which can be valued with more traditional discounted cash flow models and the like.

Options on biotech stocks without any commercial products are therefore a lot like options on options. For those biotechs where the value of the pipeline is skewed largely in the direction of a single drug, the option on the option of a single drug can result in extreme uncertainty and implied volatility, as highlighted in VVUS Implied Volatility Tops 700.

With the FDA panel decision due out today, investors have been valuing VVUS stock on the basis of a probability-weighted set of outcomes that could easily double or halve the stock price when the stock opens for trading again.

As the time of the FDA panel decision has approached, it has been interesting to watch the price of VVUS options. For the most part, the prospects for the company and the probabilities associated with the FDA panel decision have changed very little. The charts below show there was very little change in the price of VVUS options from Tuesday at 10:34 a.m. ET, when VVUS was trading at 11.93 (top graphic) to the end of yesterday’s session, when VVUS closed at 12.11 (bottom graphic). Notice, however, that while the price of the various options held steady, the implied volatility spiked even higher in order to support the same options values as time decayed and the July options expiration neared. A good example is the July 11 calls, which showed a bid-ask of 3.40 – 3.60 in each instance, yet the implied volatility had to rise from 717 to 885 in order to maintain the same option price almost two full sessions later.

With VVUS, we have an interesting glimpse of the options pricing model at work. With the underlying, option price, strike price and interest rate unchanged, what we see with VVUS is almost a pure interplay between implied volatility and time. Assuming VVUS opens up for trading on expiration day tomorrow, I will be watching the collapsing volatility and gyrating stock price as the pricing model transitions back to a more common interplay of implied volatility vs. the price of the underlying.

For more on related subjects, readers are encouraged to check out:


VVUS options on Tuesday, 7/13/10 at 10:34 a.m. ET, with the underlying at 11.90


VVUS options after market close on Wednesday, 7/14/10, with the underlying at 12.11


[source: Livevol Pro]

Disclosure(s): long VVUS at time of writing; Livevol is an advertiser on VIX and More

Tuesday, July 13, 2010

VVUS Implied Volatility Tops 700

From time to time I have highlighted extremely high implied volatility in individual securities such as FAS, IOC, EWZ and the banks that were subject to the stress tests (see links below.)

With the recent action in Vivus (VVUS), however, it may be time to reconsider just how extreme implied volatility can get. Vivus has a new weight-loss pill, Qnexa, that is under review by the FDA, with an FDA panel decision expected Thursday. For those who are interested in the details, Business Week provides a handy summary of the situation in Vivus’s Diet Pill Qnexa Faces FDA Scrutiny on Safety.

In the chart below, the red line is the aggregate implied volatility of July options in VVUS, as calculated by Livevol Pro. The yellow line is August aggregate IV and the green line is September aggregate IV.

Once the FDA decision has been announced, I will be back to analyze the impact of the news on the various Vivus options and their implied volatility.

With IV this high, VVUS is probably more appropriate for spectators than investors right now. This is a lottery ticket – and an expensive one. Not a place for ‘risk capital’ in my book, but perhaps an appropriate use of ‘entertainment capital’ if anyone one has some of that sitting around.

...unless you can find an aribitrage opportunity like Ophir Gottlieb of Livevol did yesterday in Vivus (VVUS) -- Biotech's Gigantic Vol Yields Arbs on the Table Right Now.

For more on related subjects, readers are encouraged to check out:


[source: Livevol Pro]

Disclosure(s): long VVUS at time of writing; Livevol is an advertiser on VIX and More

Monday, July 12, 2010

Unusual Volatility Index Divergence

Since I have not seen this mentioned elsewhere, I thought I should point out that there was an interesting and very unusual divergence in the major U.S. volatility indices today. As the chart below shows, both VXO and RVX posted substantial gains, up 5.7% and 4.5% respectively. The other three major volatility indices declined, with VXN down 1.9%, VIX down 2.2% and VXD down 3.6%.

With no obvious gaps in any of the charts nor a single index outlier, there are no obvious signs of bad data at work. While correlations among these five indices run in the 97% - 99% range and divergences are largely accounted for by different market capitalizations, the fact that the two gainers were the large cap VXO and the small cap RVX makes today's numbers particularly difficult to explain.

Frankly, I am a loss for a good way to account for the discrepancy. The drop in the VIX futures and VIX ETNs (VXX and VXZ) suggests to me that perhaps VXO and RVX were hit with a similar technical glitch, but I have not seen any public statement to support this.

Anyone care to venture an explanation?

For more on related subjects, readers are encouraged to check out:


[source: Yahoo.com]

Disclosure(s): neutral position via options in VIX at time of writing

Sunday, July 11, 2010

Chart of the Week: The Risk Trade

Lately I have been talking about the flight-to-safety trade in posts such as Revisiting the Flight-to-Safety Trade. In thinking about various flight-to-safety low risk havens I tend to focus on U.S. Treasuries, the dollar (UUP) and gold (GLD).

Turn the flight-to-safety trade upside down and essentially what we are looking at is the risk trade. There are many ways to think about the risk trade (growth vs. value, emerging markets vs. developed markets, consumer discretionary vs. consumer staples, etc.) but for a broad and simplified perspective on the risk trade I like to focus on market capitalization. Specifically, I like to follow the ratio of the small cap Russell 2000 index (RUT) to the mega cap S&P 100 index (OEX).

This week’s chart of the week below shows the RUT relative to the OEX (black line) since May 2008, with a gray area chart of the S&P 500 index added for context. Also included in the chart are Bollinger Bands that use customized settings of 30 days and 1.5 standard deviations (for more information on using something other than the default 20 days and 2.0 standard deviations, see the links below.) The result is a chart that tells me when the RUT:OEX ratio is high in absolute terms or relative to recent values.

If stocks are in the process of moving into an trading range (i.e., as suggested in The Elusive Trading Range), then investors should be thinking about transitioning from indicators that measure trend strength to indicators such as oscillators that measure how much various asset classes are overbought oversold.

When it comes to stocks, an important part of understanding momentum and reversal opportunities in either trending or trendless markets it to look at various proxies for the risk trade. For me at least, a good place to start is the RUT:OEX ratio and lately that ratio has done a solid job of identifying overbought and oversold conditions in stocks.

For more on related subjects, readers are encouraged to check out:

[source: StockCharts.com]
 

Disclosure(s): none

Friday, July 9, 2010

VIX Futures Contango Bubble

Truth be told, there is no such thing as a “contango bubble,” but I like how the two words look juxtaposed and it is Friday…

Bubble or not, the VIX futures are stretched to an extreme that I do not ever recall seeing and to the extent that the grapevine is whispering to Adam Warner of the Daily Options Report that the differential between the first month and third month VIX futures is at its highest level ever. (Note to self, why doesn’t the grapevine ever whisper to me?)

The chart below, courtesy of FutureSource.com, shows the difference between the VIX third month futures and front month futures (VX V0 – VX N0 in current VIX futures parlance) going back about six months. Personally, I tend to get excited when the third month VIX futures rises more than 2.00 higher than the front month, as this frequently suggests that the VXX negative roll yield contango play is starting to set up.

Some 17 months after its launch, I probably still get more questions about VXX than any other subject. As much confusion as there is about VXX, I think it is probably time to come out with an extended look at this volatility product in the next week or two.

For more on related subjects, readers are encouraged to check out:


[source: FutureSource.com]

Disclosure(s): short VXX at time of writing


Thursday, July 8, 2010

Charting Jobless Claims

Concern about the employment situation have resulted in considerable churning – both in the financial markets and in the minds of investors – about the various labor market data. The recent nonfarm payrolls report raised more questions than it answered and the weekly jobless claims numbers often suffer from a low signal to noise ratio that makes it dangerous to get too excited about one week of data.

In an effort to put the nonfarm payrolls data into some historical perspective, last week I assembled Chart of the Week: Nonfarm Payrolls and Backsliding to highlight the nonlinear aspect of much of this monthly data. Rather than wait until the end of this week, I thought it might be helpful to do something similar for the initial and continuing jobless claims data.

The chart below captures the jobless claims data going back to 1967. Since these are absolute numbers, it is important to note that the current universe of workers covered by unemployment insurance is almost three times as large as it was in 1967. Still, the trends have a great deal of informational value. Note, for instance, that the data are on two axes and the initial jobless claims (solid red line) seems to have settled into a holding pattern that is near the highs from the 1990-91 and 2001-03 recessionary periods.

For more on related subjects, readers are encouraged to check out:


[source: Bureau of Labor Statistics]

Disclosure(s): none

Wednesday, July 7, 2010

Spain Rallies

With all the excitement over the performance of Spain’s soccer team in the World Cup, it has been easy to overlook the performance of the Spanish ETF, EWP. From a low of 29.85 almost a month ago, EWP has now rallied 22.1%, even as the country’s credit default swaps have remained elevated.

As the chart below shows, a close above 37 could signal a new breakout and perhaps a significant uptrend.

More importantly, Spain is the tipping point in the European sovereign debt crisis as I see it. In a nutshell, as goes Spain, so goes Europe.

For more on related subjects, readers are encouraged to check out:


[source: FreeStockCharts.com]

Disclosure(s): long EWP at time of writing

Monday, July 5, 2010

Chart of the Week: Record Low Yields for the 2-Year U.S. Treasury Note

As noted a week ago in Revisiting the Flight-to-Safety Trade, there are a handful of ways in which to keep an eye on the pulse of investor anxiety. These include U.S. Treasuries (including the various ETFs, such as TLT, IEF and SHV), the dollar (UUP), and gold (GLD). In terms of volatility, the preferred vehicles are the VIX, VIX futures and VXX.

For the last two weeks or so, stocks have been under considerable pressure, yet the action in the dollar, gold and volatility have been relatively mild and far short of panic. One has to look at U.S. Treasuries to see signs of extreme anxiety in the charts. This week’s chart of the week below shows weekly bars of the yield on the 2-Year U.S. Treasury Note going back four years. The yield on the 2-Year Note reflects an amalgamation of several factors, including the Fed’s easy money policy, potential deflationary speculative plays and demand which results from the flight-to-safety trade when investors are fearful of owning stocks, commodities and other investment vehicles. While it is difficult to disaggregate the component influences on the yield, it is safe to say that the record low yields seen last week include an important flight-to-safety component and are an excellent proxy for investor fear and anxiety.

For some of my thinking on why the VIX was unusually sluggish last week, see Impromptu VIX Talk, where Adam Warner (Daily Options Report) and I confirm that once again we have independently arrived at the same conclusions regarding volatility. [For those conspiracy theorists who wonder why we have never been seen in the same room, perhaps Adam's capture of our IM banter will quell thoughts of the ghost blogger typing away on the grassy knoll.]

For more on related subjects, readers are encouraged to check out:


[source: StockCharts.com]

Disclosure(s): short VIX and VXX at time of writing

Friday, July 2, 2010

Trends in Economic Data Relative to Expectations

Before the long weekend, I thought I would post a chart I use in which I track the performance of key economic data releases relative to consensus expectations.

The data are sorted into five groups and include economic reports such as the ones highlighted below:

  • Manufacturing/General – GDP, ISM, Industrial Production, Capacity Utilization, Durable Goods, Factory Orders, Regional Fed Indices, Productivity, etc.
  • Housing/Construction – Building Permits, Housing Starts, Existing Home Sales, New Home Sales, Pending Home Sales, S&P/Case-Shiller Home Prices, Construction Spending, etc.
  • Employment – Employment Report, Jobless Claims, etc.
  • Consumer – Retail Sales, Consumer Confidence, Consumer Sentiment, Personal Income, Personal Spending, etc.
  • Prices/Inflation – Producer Price Index, Consumer Price Index, etc.

For each report, I evaluate whether the data exceeds or falls short of consensus expectations. I then aggregate the data over time to see the extent to which certain segments of the economy are trending higher or lower relative to expectations.

The chart below summarizes the trends in these five categories since the beginning of the year. In terms of performance relative to expectations, manufacturing (solid black line) has performed best, though the trend has turned down for the last two months or so. Not surprisingly, the worst performing area – by a considerable margin – has been employment (solid red line), where the trend relative to expectations has been consistently negative since the middle of April.

For more on related subjects, readers are encouraged to check out:


Disclosure(s): none

Nonfarm Payrolls and Backsliding

This morning’s nonfarm payrolls report confirms that the job creation portion of the economy which was strong in March through May has turned negative again, resulting in a net loss of 125,000 jobs in June. On the positive side, the private sector added 83,000 jobs during the month, while the loss of 225,000 temporary census workers was the sole reason for the negative headline number.

There were, however, some ominous signs in the nonfarm payroll data. These included a decline in the average hourly workweek (down 0.1 to 34.1 hours) as well as a decline of $0.02 in average hourly earnings to $22.53.

In addition to capturing the last 11 ½ years of payroll (blue and red columns) and unemployment rate (red and black line) data, the chart below is intended to highlight the perils of overreacting to the last data point. Note that particularly in the early stages of a recovery (i.e., the red box covering June 2002 – August 2003), the data tend to be choppy and any trends short-lived. I expect that the same dynamics are at work in the current environment. Employment is not the only area of concern at the moment. Housing is also suffering from some backsliding this month, as pull forward demand triggered by the government tax incentives is now giving way to several months of slow residual demand.

I am still anticipating a slow growth scenario for the balance of 2010, with economic expansion – and the accompanying data – moving forward in a fashion that will probably resemble the path taken by someone trying to drive a manual transmission vehicle for the first time.

For more on related subjects, readers are encouraged to check out:


[source: Bureau of Labor Statistics]

Disclosure(s): none

DISCLAIMER: "VIX®" is a trademark of Chicago Board Options Exchange, Incorporated. Chicago Board Options Exchange, Incorporated is not affiliated with this website or this website's owner's or operators. CBOE assumes no responsibility for the accuracy or completeness or any other aspect of any content posted on this website by its operator or any third party. All content on this site is provided for informational and entertainment purposes only and is not intended as advice to buy or sell any securities. Stocks are difficult to trade; options are even harder. When it comes to VIX derivatives, don't fall into the trap of thinking that just because you can ride a horse, you can ride an alligator. Please do your own homework and accept full responsibility for any investment decisions you make. No content on this site can be used for commercial purposes without the prior written permission of the author. Copyright © 2007-2023 Bill Luby. All rights reserved.
 
Web Analytics