Showing posts with label RJI. Show all posts

Friday, July 30, 2010

LSC Long-Short Commodities ETF Struggling Mightily

Launched in June 2008, the ELEMENTS S&P Commodity Trends Indicator ETN (LSC) was an immediate hit with retail investors, attracting a considerable volume, offering diversification from an equity-heavy portfolio and even using a long-short approach to take advantage of both bullish and bearish trends in commodities. By the end of the 2008, the ETF was already up more than 6%.

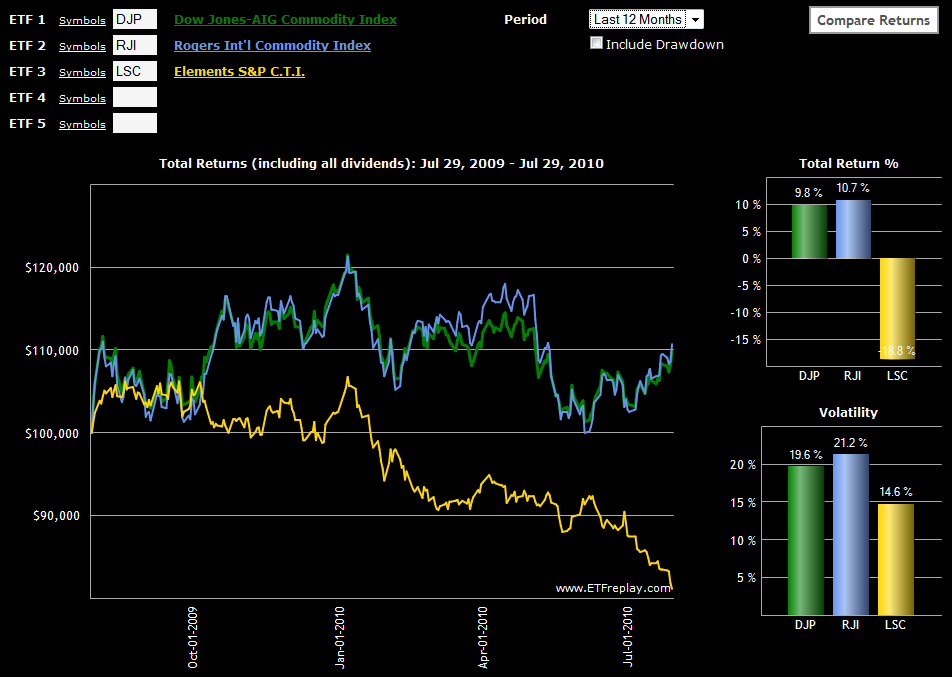
Unfortunately, since the end of 2008 the ETF has been steadily losing ground and is now down 44% from its 2008 high water mark. The graphic below, from ETFreplay.com, shows LSC’s performance relative to broadly diversified commodity ETFs, RJI and DJP over the course of the last year. While the graphic alone may make LSC appear to be an attractive short, I think it is important to note that the prospectus has historical data going back to 2001 which shows excellent long-term performance characteristics.

A look under the hood shows that LSC’s trend following approach uses a 7-month exponential moving average (EMA) to evaluate trends in the following 16 commodity futures contracts:

  • Wheat (CBOT: W)
  • Corn (CBOT: C)
  • Soybeans (CBOT: S)
  • Cotton (NYCE: CT)
  • Cocoa (CSCE: CC)
  • Sugar (CSCE: SB)
  • Coffee (CSCE: KC)
  • Live Cattle (CME: LC)
  • Lean Hogs (CME: LH)
  • Copper (COMEX: HG)
  • Gold (COMEX: GC)
  • Silver (COMEX: SI)
  • Heating Oil (NYMEX: HO)
  • Light Crude Oil (NYMEX: CL)
  • RBOB Gasoline (NYMEX: XB)
  • Natural Gas (NYMEX: NG)

Based on where the commodities are relative to the EMA, the ETF will go long or short, or have a neutral position. The one exception is crude oil, where the ETF is only allowed to be long or flat. The prospectus lays out the rationale for the short restriction on crude oil as follows:

Energy, due to the significant level of its continuous consumption, limited reserves, and oil cartel control is subject to rapid price increases in the event of perceived or actual shortages. For example, although a problem of this magnitude has not occurred historically, if the Index were capable of shorting the energy sector and a catastrophe occurred which caused Light Crude prices to surge dramatically while the energy Sector allocation was set to short, the Index would lose a significant portion of its value on the Light Crude position alone. Because no other sector is subject to the same continuous demand with supply and concentration risk, the energy sector is never positioned short in the Index.

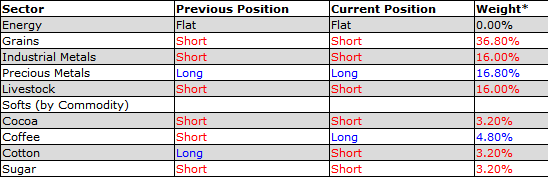
LSC evaluates all futures contracts at the end of each month and makes any new long-short decisions at that time. The current (July) positions of LSC are as follows:

Those interested in additional information on LSC should try:

Going forward, I think the “…and More” portion of this blog will begin to place increased emphasis on the commodity space, including ETFs, futures and options on commodities.

As an aside, there are two new ETF sites that have recently launched which offer a great deal of promise to ETF investors:

For more on related subjects, readers are encouraged to check out:

[sources: ETFreplay.com, ELEMENTS/Merrill Lynch]

Disclosure(s): short LSC at time of writing


Sunday, March 28, 2010

Chart of the Week: Impact of Falling Euro on Stocks and Commodities

Given all the general economic problems facing Europe and the sovereign debt issues related to Greece and the PIIGS (Portugal, Italy, Ireland, Greece and Spain), it is not surprising that the euro has come under so much selling pressure as of late.

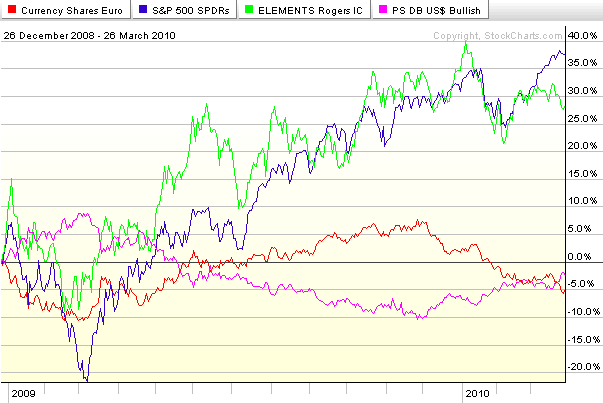
Considering that the dollar index is comprised of a weighted basket of foreign currencies of which the euro comprises 57.6%, it is not too much of a stretch to think of the dollar as an inverse euro – as their almost mirror image in the chart below suggests. So given that recent weakness in the euro is accounting for most of the dollar’s resurgence and the dollar has a strong influence on the prices of commodities and stocks, it is meaningful to consider how the fluctuations in the euro have translated into changes in stocks and commodities.

This week’s chart of the week looks at ETFs for the euro (FXE), dollar (UUP), stocks (SPY) and commodities (RJI) for the last 15 months. Following the bottom of the stock market in March 2009, the euro (red line) rallied in concert with the S&P 500 index (blue line) and commodities (green line) through December 2009. As the euro began to weaken, however, both stocks and commodities initially continued their bullish climb, before selling off in January and the beginning of February. Since the early February lows, stocks (SPY) have managed to rally in spite of a weakening euro and firming dollar (purple line). Commodities, which tend to react more strongly to currency fluctuations, have struggled much more with euro weakness and dollar strength. Should the euro continue to fall, it is reasonable to expect stocks to continue to outperform commodities and of course euro weakness to directly lift the dollar to new heights.

For more on related subjects, readers are encouraged to check out:


[source: StockCharts.com]

Disclosure(s): none

Sunday, May 24, 2009

Chart of the Week: Commodities and the Dollar

One of the market-moving stories of the week was a decision by Standard & Poor’s to lower their outlook for AAA-rated sovereign debt of the United Kingdom from stable to negative. This action caused ripples in the currency markets, with the dollar coming under pressure after investors such as Bill Gross of PIMCO expressed concerns about the mounting U.S. deficit and potential future risk to the AAA credit rating for U.S. debt.

By the end of the week the dollar was at a four month low against the euro and commodities were up sharply, partly because commodities are seen as an effective hedge against inflation.

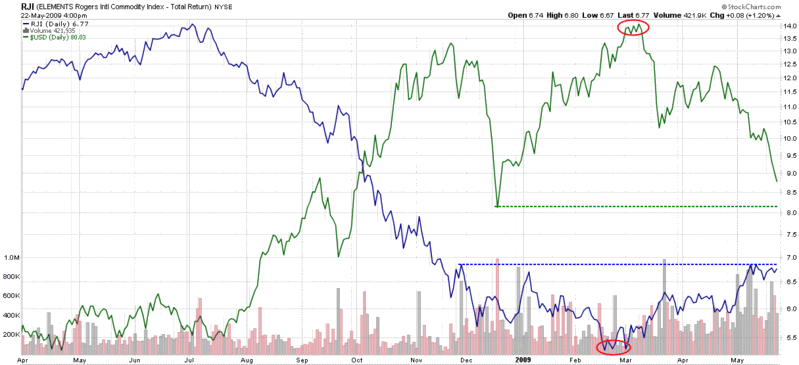
In the chart of the week below, I have captured a chart of the Rogers International Commodity Total Return Index ETF (RJI) versus the U.S. dollar. The chart shows that commodities formed a bottom in mid-February and have recently attracted buying in higher volumes.

Shortly after commodities bottomed, the dollar peaked and has experienced several sharp moves down. The drop in the dollar has helped to lift prices of dollar-denominated commodities and pushed money toward commodities as a potential inflationary hedge. During the course of the past three months, commodities have had two up trending periods, each of which was followed by a consolidation period. With the dollar breaking down and in danger of testing the December support level, commodities could be preparing for another upward leg soon.

[source: StockCharts]

Friday, July 18, 2008

Are Commodities Reversing or Consolidating?

It has been a dramatic week in the markets, with the long oil and short financials trade reversing hard and a number of the relationships that have been intact for the past nine months being thrown into disarray.

As I have been maintaining since early in the year, speculative money is likely to be flowing into either commodities or equities, but not both. That basic premise has not changed, but what has been called into question is whether the second half of 2008 will be more friendly to commodities or equities.

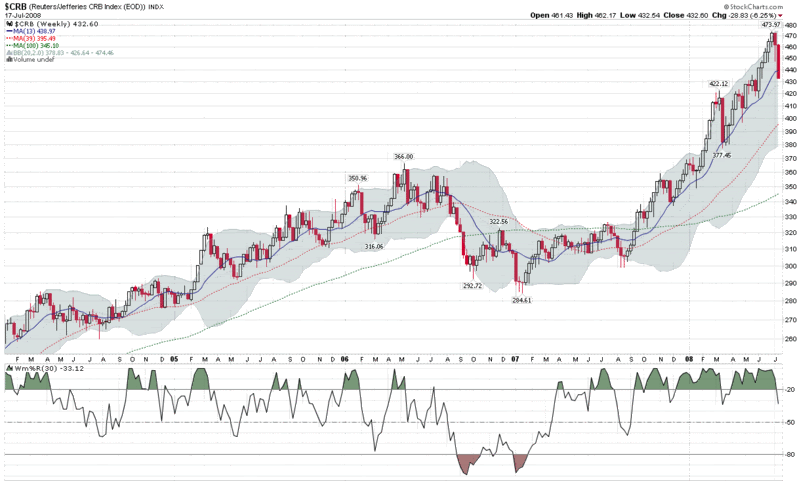
I believe the answer to the commodities or equities conundrum is that it is still too early to tell, but commodities still have to be considered the preferred asset class. Two charts below tell a good deal of the story. The first graphic is a weekly chart of the Reuters/Jefferies CRB index, which is heavily weighted toward energy. It shows that the recent pullback in commodities is consistent with previous pullbacks and consolidation periods. Neither the magnitude nor the duration of the recent reversal in the bullish commodities trend suggests that the bull market in commodities is winding down.

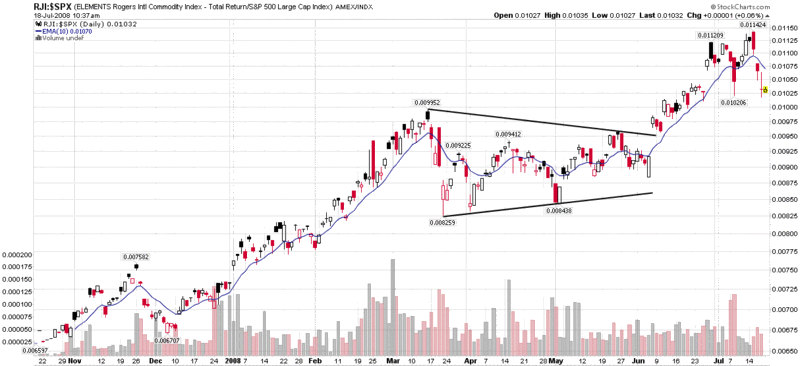
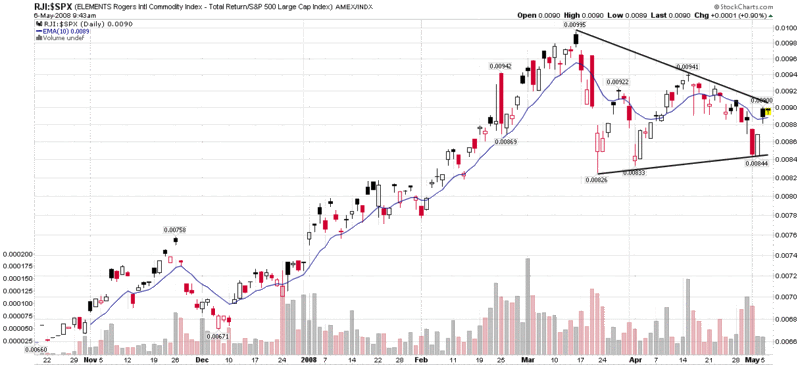
The second chart last appeared on this blog two months ago. It reflects the ratio of the commodities basket in the Rogers International Commodity Total Return Index (RJI) to the SPX. [RJI is an ETF linked to the Rogers International Commodities Index that has a broad weighting, with less emphasis on energy than most commodity indices] The ratio chart also shows much more of a consolidation ongoing in the present market environment than a reversal.

Of course, one more week of soaring financials and plummeting oil prices will dramatically change the tone of the chart, but for now at least, consider the commodities trend to still be intact (and susceptible to buying on the dips), which means the case for a reversal in equities is still a weak one at this stage of the game.


Tuesday, May 6, 2008

The Commodities vs. Equities Battle Continues…

If the markets seem a more than little indecisive at the moment, one of the reasons is that ongoing sector rotation has muddied the waters with respect to what is hot and what is not. A lot of the sector rotation churning, on the other hand, is merely asset class trickle down, as investors try to decide at a much higher level whether they want to make a substantial commitment to equities and the possibility of a resumption in the recent bull market – or whether the hard assets of commodities are a more attractive option in light of natural resource shortages and concerns about inflation.

The commodities vs. equities battle has been tilting in the direction of commodities in recent months, but since the March lows the consensus has unraveled. In the chart below, the ratio is of the Rogers International Commodity Total Return Index (RJI) to the SPX. [RJI is an ETF linked to the Rogers International Commodities Index that has a broad weighting, with less emphasis on energy than most commodity indices] The ratio chart shows indecision over the past six weeks, with the symmetrical triangle pattern awaiting resolution. I am not sure which side will win the commodities vs. equities skirmish, but when we can declare a victor in this battle, we should know a great deal about the future of the markets over the next few months.

For a longer term perspective on this subject, see my Equities or Commodities? post of a month ago.

Wednesday, February 20, 2008

Speculation in Commodities vs. Technology

During the course of the five year bull market that appears to have ended last October, the technology and commodities sectors have been two areas where a considerable amount of speculative money has flowed in search of extraordinary returns.

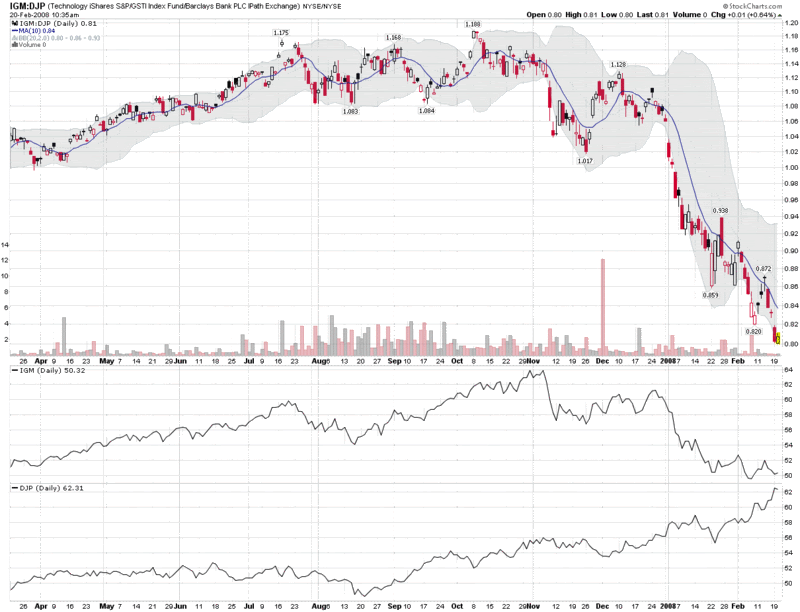
Since October, money has flowed out of technology, as indicated by the action in IGM, a popular technology ETF. Conversely, speculative money has been flowing in large quantities into commodities, as the action in gold, agriculture, oil, natural gas and other commodities can attest to. While there are a number of commodities indices and ETFs out there, many of them (notably the CRB Index, but also the GSCI) have such a heavy weighting in oil and gas as to make them de facto energy indices and not a good proxy for a broader representation of industrial metals, precious metals, agricultural commodities and the like. For this reason, I have chosen to highlight the iPath Dow Jones AIG Commmodity Index (DJP) as my broad-based commodities benchmark (the Rogers International Commodity Index, ticker RJI, is also broadly diversified, but is only it its fifth month of operation.)

Looking at a ratio of the IGM and DJP ETFs or stacking them on top of each other, as I have done below, you can see the flow of speculative money out of technology and in to commodities. For those seeking a strong upward trend in the current downturn, commodities represent an excellent opportunity. Conversely, when speculative money starts flowing out of commodities and back in to technology, expect to see the NASDAQ and other broad indices stage a more sustained move to the upside.

DISCLAIMER: "VIX®" is a trademark of Chicago Board Options Exchange, Incorporated. Chicago Board Options Exchange, Incorporated is not affiliated with this website or this website's owner's or operators. CBOE assumes no responsibility for the accuracy or completeness or any other aspect of any content posted on this website by its operator or any third party. All content on this site is provided for informational and entertainment purposes only and is not intended as advice to buy or sell any securities. Stocks are difficult to trade; options are even harder. When it comes to VIX derivatives, don't fall into the trap of thinking that just because you can ride a horse, you can ride an alligator. Please do your own homework and accept full responsibility for any investment decisions you make. No content on this site can be used for commercial purposes without the prior written permission of the author. Copyright © 2007-2023 Bill Luby. All rights reserved.
 
Web Analytics