Showing posts with label currencies. Show all posts

Saturday, December 31, 2016

The Year in VIX and Volatility (2016)

The consensus called for a big uptick in volatility in 2016 and while there was a lot of drama, the VIX spikes were relatively manageable and short-lived.  The VIX opened the year at 22.48 and ended the year at just 14.04.  For the full year, the median VIX was 14.31, while SPX historical volatility for the full year ended up at a mere 13.12.

That being said, there were five distinct VIX spikes in the graphic below, listed according to chronology:
  • Fears related to slowing growth in China (January)
  • A plunge in crude oil prices to $26.05/bbl. for WTIC, as investors grappled with the possibility that Cushing storage facilities would be exhausted (February)
  • The surprise Brexit vote result in favor of the U.K. leaving the E.U. (June)
  • A cocktail of nearly simultaneous shocks from Fed President Rosengren (suddenly sounding hawkish), Jeff Gundlach (interest rates have bottomed) and the European Central Bank (no additional stimulus) puts pressure on stocks (September)
  • Increasing uncertainty leading up to the U.S. election (November) 

In all five instances, the VIX moved up sharply, but in defiance of historical precedent, the volatility index moved down almost as sharply as it moved up.  In fact, some of the biggest extremes for the year came in the form of volatility crushes, where the VIX had an unprecedented series of sharp downward one-day move.  Checking the record books, the only previous year that the VIX posted three top 20 one-day declines was 2007 – and clearly investors were in denial that year.  This year the Trump election caused the sixth largest one-day drop in the history of the VIX, whereas the Thursday before and Tuesday after the Brexit vote triggered the eighteenth and tenth largest one-day VIX declines.

On the other side of the ledger, some of the upward moves in the VIX made the record books as well.  The day following the Brexit vote saw a 49.3% VIX spike – the fifth highest one-day spike on record.  What was even more surprising was the Rosengren/Gundlach/ECB cocktail noted above triggered a 39.9% spike (eleventh highest in history) in what seemed to be a relatively calm market environment in September.  It turns out the VIX was just getting warmed up for greater things, including a record nine consecutive up days leading up to the November election.

Even with these extremes, the highs and lows in the VIX were rather middling, with the VIX peaking at 32.09 on January 20th and hitting an annual low of 10.93 on December 21st.

The graphic below captures these and other highlights from 2016:


[source(s): StockCharts.com, VIX and More]

Included in the non-VIX highlights are a 5000+ year low in interest rates in Europe and Japan (where negative interest rates prevailed) as well as a thirteen-year low in the price of crude oil.  On the geopolitical front, political craziness of one kind or another abounded in Brazil, South Korea, Turkey, Italy, Colombia and South Africa, among other locations.  Terrorism also left its footprint again in 2016 and Zika also created considerable political and social turmoil.  In the financial realm, European banks had a very difficult year and begin 2017 on shaky footing.

While the year ended on a relatively quiet not, I suspect 2017 will have much more in the way of new surprises, including swans of many dark hues.  Next week I will resume the VIX and More fear poll and find out what the consensus is for volatility and its causes in the coming year.

Finally, since 2011, I have been maintaining a proprietary Macro Risk Index that measures volatility and risk across a broad range of asset classes, including U.S. equities, foreign equities, commodities, currencies and bonds.  In 2016, the Macro Risk Index was trending down most of the year, punctuated by significant spikes in February (crude oil) and again in June (European currencies). 

How did 2016 measure up to expectations?  I sum up the year in My Low Volatility Prediction for 2016: Both Idiocy and Genius.  Also worth investigating are a pair of Barron’s articles from one year ago laying out two opposing perspectives on volatility in 2016.  For the case for rising volatility and what to do about it, try Jared Woodard’s Prepare for Rising Volatility in 2016.  I provide the contrarian point of view in The Case Against High Stock-Market Volatility in 2016.

Have a happy, healthy and profitable 2017!

Related posts:


For those who may be interested, you can always follow me on Twitter at @VIXandMore

Disclosure(s): the CBOE is an advertiser on VIX and More

Sunday, November 20, 2016

Post-Election Risk Trending Up in Treasuries and the Euro, Down in U.S. Stocks

You can always tell when the crowd gets long the VIX and ends up on the wrong side of the trade.  “The VIX is broken!” becomes an oft-repeated refrain, as does “The markets are rigged!” and the usual list of exhortations from those who are in denial.  The current line of thinking is that the world must be much more dangerous, risky and uncertain as a result of a Trump victory, yet the VIX is actually down 31.4% since the election – ipso facto the VIX is broken.

While I have more than a small soft spot in my heart for the VIX, I will be the first to point that taking an Americentric, equity-centric view of the investment landscape is dangerous and naïve.  More often than not, the issues that end up having a strong influence on the VIX are born on foreign soil and/or in other asset classes.  Just look at the recent history in China, Greece, Italy, currencies and commodities to name a few.

When it comes to looking at implied volatility indices as a risk proxy, I prefer to survey the landscape across asset classes, geographies and sectors, which is why I have developed tools such as a proprietary Macro Risk Index (more on this shortly) that look at risk across asset classes, geographies and sectors.

In the graphic below, I have isolated a handful of volatility indices that cut across asset classes and geographies to show how these have moved in the eight days following the election.  Note that Treasuries (TYVIX) and the euro (EVZ) have been trending steadily higher since the election as uncertainty related to the future of inflation and interest rates in the U.S. has risen, while the relationship that the Trump Administration will have with our NATO allies and the European Union is also somewhat murkier. 

Gold implied volatility (GVZ) initially moved sharply higher following the election, but has since receded, as gold prices fell swiftly after the election, but have since stabilized.  Meanwhile, emerging markets saw dramatic selling immediately following the election, but have bounced during the course of the past week as fears and implied volatility (VXEEM) have subsided.  Last but not least, the moves in crude oil and crude oil implied volatility (OVX) have been the least remarkable of the group


[source(s):  CBOE, VIX and More]

In aggregate, the picture is a mixed one in terms of implied volatility, risk and uncertainty.  As is often the case, risk has become elevated in certain asset classes, such as Treasuries and the euro.  In other areas, such as U.S. equities – and their VIXian barometer – there are winners and losers, with the result that a net bullish outlook has moved equity implied volatility lower.  This is not to say that a Trump Administration – whose cabinet members and policy priorities are largely unknown at this juncture – will not increase risk in some areas.  More risk is certainly on the horizon and if history is any guide, an Americentric, equity-centric view of the investment world is likely to be slow in identifying those risks.

Related posts:


For those who may be interested, you can always follow me on Twitter at @VIXandMore


Disclosure(s): the CBOE is an advertiser on VIX and More

Tuesday, January 5, 2016

The Year in VIX and Volatility (2015)

Every year one of my most-read posts is my annotated overview of the year in VIX and volatility.  Now that I have been doing this for the past eight years, the aggregated view of volatility from 2008 to the present makes for a fascinating concise history not just of volatility, but more broadly of the financial markets and of economic activity in general.

The graphic below captures most of the highlights from 2015 and from a volatility perspective, it was a year for the record books.  During August we saw the largest one-week VIX spike (+113%) that resulted from unprecedented back-to-back days of VIX spikes of more than 45%!  The cumulative jump in the VIX pushed the VIX to a high of 53.29 – the only time outside of the 2008-09 financial crisis since the launch of the VIX in 1993 that the VIX has topped 50.


[source(s): VIX and More]

While most investors pointed to China as the proximate cause of the record VIX spike(s), a VIX and More fear poll one week after the big VIX spike also highlighted “market structural integrity (HFT, flash crash, exchange issues, etc.)” as almost on par with China concerns, with “market technical factors (breach of support, end of trend, etc.)” not that far behind.

The balance of the year saw a wide variety of events that moved the markets, including the Fed’s first rate hike in nine years; crude oil plummeting to $34/bbl.; shock waves in the high-yield bond market due to low oil prices; chilling terrorist attacks in Paris and in California; Puerto Rico announcing it will default on some of its debt; turmoil in the currency markets when the Swiss National Bank ended the peg of the Swiss franc to the euro; a dramatic boom-bust cycle in Chinese A-shares – and a flurry of ineffective interventions on the part of the Chinese government to restore stability; a proxy war between Saudi Arabia and Iran in Yemen; and the European Central Bank committing to $1.2 trillion of quantitative easing.

As noted previously, even with all of the volatility, Every Single VIX ETP (Long and Short) Lost Money in 2015.

Finally, since 2011, I have been maintaining a proprietary Macro Risk Index that measures volatility and risk across a broad range of asset classes, including U.S. equities, foreign equities, commodities, currencies and bonds.  In 2015, the Macro Risk Index was consistently higher than it has been during any year since the 2011 inception.

What does high volatility in 2015 mean for 2016?  During the past two weeks, Barron’s published two opposing (but not necessarily inconsistent) perspectives on volatility in 2016.  For the case for rising volatility and what to do about it, try Jared Woodard’s Prepare for Rising Volatility in 2016.  I provide the contrarian point of view in The Case Against High Stock-Market Volatility in 2016.


Related posts:


Disclosure(s): net short VIX at time of writing

Wednesday, September 2, 2015

China Growth and Market Structural Integrity Top List of Fear Poll Concerns

After a hiatus of almost a year (the October 2014 pullback, to be exact), I have reprised the VIX and More Fear Poll in an attempt to get some insight into which issues have been responsible for bring fear back into the investing equation and in so triggering the highest VIX spike (53.29) outside of the 2008-09 financial crisis and the #5 and #6 one-day VIX spikes ever on consecutive days.

In the chart below, I have summarized the top ten responses from almost 400 voters, covering 40 countries over the past two days.  The question:  “Which of the following makes you most fearful anxious or uncertain about the stock market?”

VIX and More Fear Poll results 090215

[source(s): VIX and More]

I should note that Tuesday’s responses had “Market structural integrity (high-frequency trading, flash crashes, exchange stability, etc.)” as the #1 concern, but a late flurry of votes today for “China – weak economic growth” put China concerns over the top. Combining Chinese growth concerns with concerns about a bubble in Chinese stocks and/or housing makes it a landslide in favor of all things China. Without too much of a stretch, one could also lump in the likes of currency problems, deflation, low crude oil prices and falling commodities prices in general into a broader China-related bucket and suddenly the China + ripple effect accounts for about 50% of the votes.

As always, I love to see how the American view of the world contrasts with those non-U.S. respondents. This time around, the area most overemphasized by Americans relative to the rest of the world is, in classic Americentric myopia fashion…”U.S. – weak economic growth,” which 8.7% more Americans label as their #1 concern than their non-U.S. counterparts. Conversely, the biggest blind spot for Americans – at least relative to the concerns of the rest of the world – is commodities prices, which Americans underweight by 5.1%. A close second in the American myopia sweepstakes is Chinese bubbles in stocks and/or housing. I do not find the commodities oversight to be surprising, but certainly the relatively low concern about Chinese bubbles is unexpected.

For those who have not seen some of the earlier incarnations of this poll, these dataeback to 2012 and chronicle a U.S. public that was so obsessed with the fiscal cliff that they did not fully appreciate the gravity of the European sovereign debt crisis.

Related posts:

Disclosure(s): none

Sunday, January 25, 2015

The Year in VIX and Volatility (2014)

This is the seventh year in a row I have offered a retrospective look at the year in VIX and Volatility, which is my attempt to cram some of the highlights of the year in volatility onto one eye chart graphic with a (somewhat) manageable number of annotations.

In aggregate, 2014 was a very quiet year for the VIX, with a mean close of just 14.19 for the year, which is the lowest the VIX has been since 2006 and third lowest since 1995. On the other hand, as I recently documented, VIX spikes were common last year, with 2014 registering the third highest number of 20% VIX spikes since the beginning of VIX data, in 1990. In short, the VIX was susceptible to large spikes, but these were typically followed by strong mean-reverting declines. For example, the peak VIX of 31.06 on October 15 was the highest VIX reading since 2011, yet just six weeks later the VIX was back in the 11s.

When asked in October what they perceived as the biggest threat to stocks, respondents to the VIX and More fear poll pointed to the end of quantitative easing and the removal of the Fed safety net as their top concern, with Ebola narrowly edging out the much more nebulous “market technical factors” for the second slot. As best as I am able to determine, it was the panic associated with fears of an Ebola epidemic that took an already elevated VIX and pushed it up into the 30s.

At various times during the year, Ukraine/Russia, crude oil, ISIS/ISIL, Israel/Gaza, the Fed and the European Central Bank all managed to increase anxiety and perceptions of risk among investors. Also, the narrow miss in the vote for Scottish independence created turmoil in the United Kingdom and across the euro zone, but managed to avoid morphing into another nationalist crisis. Early in the year, there was a currency crisis in emerging markets that was triggered by (unfounded, in retrospect) concerns about higher interest rates in the U.S. Throughout the year there were concerns about valuations and excesses momentum trading in the likes of biotechnology, social media, internet and solar stocks. To some extent, these concerns peaked in April (see The Correction as Seen in the ETP Landscape for additional details), only to return periodically throughout the balance of the year.

The Year in VIX and Volatility 2014

[source(s): StockCharts.com, VIX and More]

Last year at this time, the prevailing worries were focused on whether or not Fed Chair Janet Yellen was leaning toward a more hawkish stance, the inevitable march to higher interest rates in the U.S., the weakening of emerging markets currencies and the potential fallout from the Fed’s tapering of bond purchases. In retrospect, investors were largely worrying about the wrong things.

The first few weeks of 2015 have seen Greece, Saudi Arabia and Ukraine back in the spotlight, with the Swiss National Bank and European Central Bank dominating news on the central banking front. If the past is any guide, the big issue for 2015 has yet to rear its ugly head, whether it turns out to be a gray, charcoal or black swan.

Related posts:

Disclosure(s): none

Sunday, December 20, 2009

Chart of the Week: Dollar Approaching Resistance on Weekly Chart?

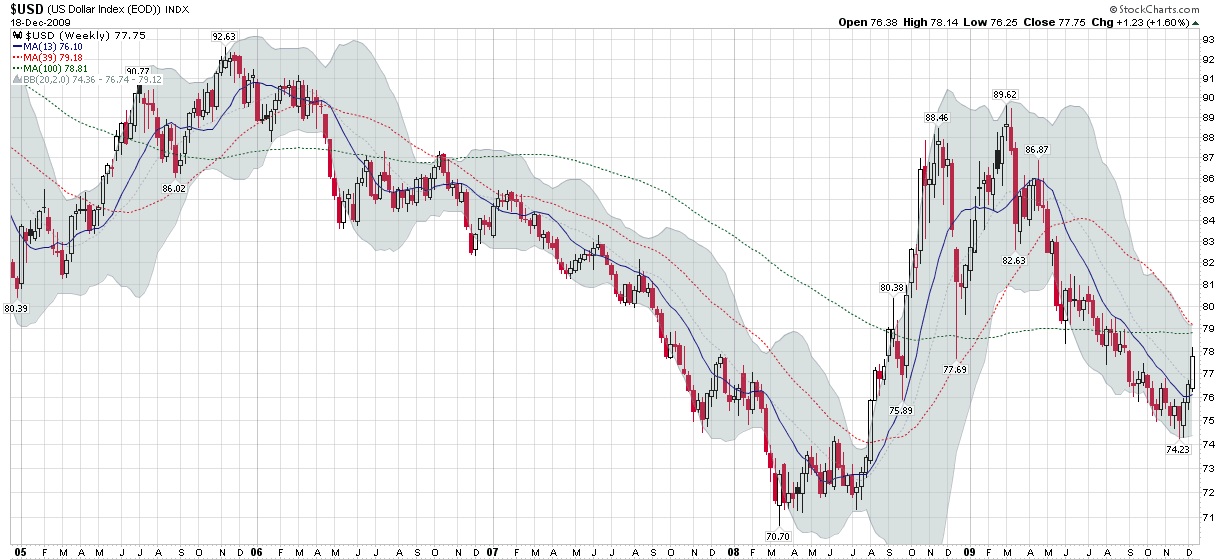
Try as I may to find something other than the dollar to highlight in chart of the week, I find the dollar’s story to be too compelling to overlook. Also, to the extent that this weekly chart is supposed to reflect an issue that I have been contemplating at some length as of late, I see the dollar as one of the key elements of the 2010 investment puzzle.

In order to get a better sense of the dollar, this week’s chart of the week looks at five years of weekly bars in the dollar index, which compares the dollar to a weighted average of a basket of foreign currencies that includes the euro, Japanese yen, British pound, Canadian dollar, Swedish krona and Swiss franc. Of these currencies, the euro has by far the largest weighting in the basket at approximately 57.6%. For this reason, concerns about Dubai, Greece and Spain have not only significantly weakened the euro, but because of the euro’s weighting, have had a strong bullish effect on the dollar index.

The chart below shows that the 79 level in the dollar index represents resistance in the form of converging 39 and 100 week moving averages. On startling feature in the chart is the 100 week moving average, which has held steadfast in the high 78s for 16 straight months, even as the dollar index has fluctuated wildly during the financial crisis. Should the dollar close above 79 and take out both moving averages, I would have to consider it back on a bullish trajectory. For now, however, I am content to count the recent move as a technical bounce that has resulted from a series of threats to the European economy and its currency.

For more on related subjects, readers are encouraged to check out:

[source: StockCharts]

Disclosure: none

Sunday, May 24, 2009

Chart of the Week: Commodities and the Dollar

One of the market-moving stories of the week was a decision by Standard & Poor’s to lower their outlook for AAA-rated sovereign debt of the United Kingdom from stable to negative. This action caused ripples in the currency markets, with the dollar coming under pressure after investors such as Bill Gross of PIMCO expressed concerns about the mounting U.S. deficit and potential future risk to the AAA credit rating for U.S. debt.

By the end of the week the dollar was at a four month low against the euro and commodities were up sharply, partly because commodities are seen as an effective hedge against inflation.

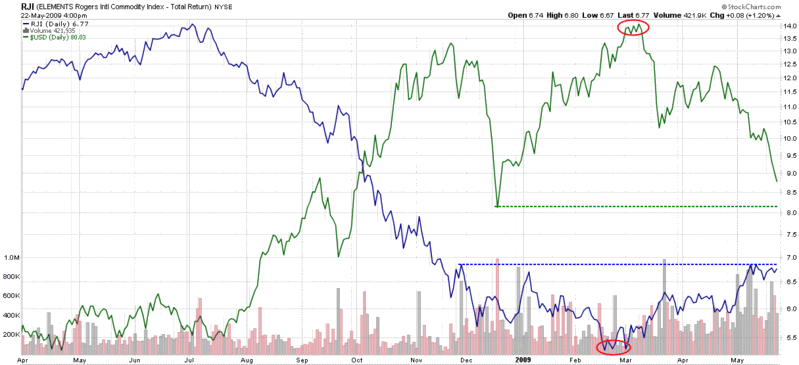
In the chart of the week below, I have captured a chart of the Rogers International Commodity Total Return Index ETF (RJI) versus the U.S. dollar. The chart shows that commodities formed a bottom in mid-February and have recently attracted buying in higher volumes.

Shortly after commodities bottomed, the dollar peaked and has experienced several sharp moves down. The drop in the dollar has helped to lift prices of dollar-denominated commodities and pushed money toward commodities as a potential inflationary hedge. During the course of the past three months, commodities have had two up trending periods, each of which was followed by a consolidation period. With the dollar breaking down and in danger of testing the December support level, commodities could be preparing for another upward leg soon.

[source: StockCharts]

Saturday, December 13, 2008

Chart of the Week: U.S. Dollar Reverses Down

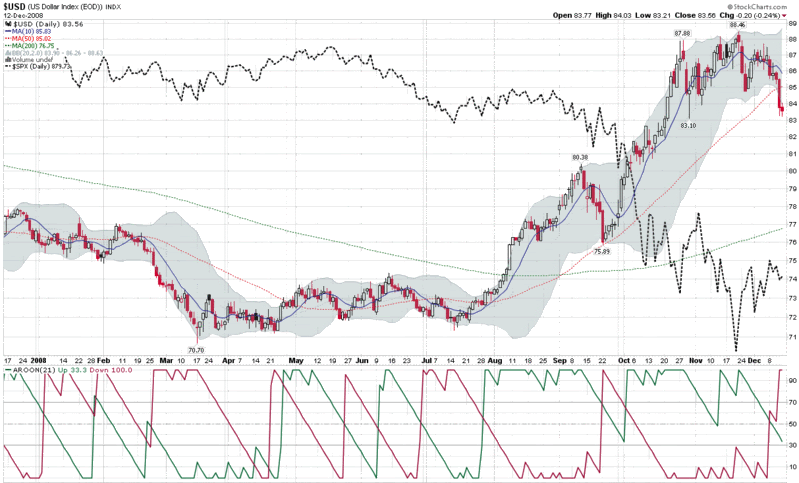
There were many strong candidates for the chart of the week, but this week’s honor goes to the U.S. Dollar, which saw its largest one week drop in percentage terms in at least 25 years.

As the chart below shows, the dollar has been negatively correlated to stocks for the past five months or so. Historically, a falling dollar has generally not been positive for stocks. It will, however, provide some support for exporters and enhance demand for commodities that are quoted in dollars across the globe.

For the most part, the strength of the dollar usually reflects traders’ opinions about the strength of the U.S. economy relative to economies associated with the other major currencies. When the dollar was rising, therefore, it was not necessarily a vote of confidence in the U.S. economy as much as it reflected a concern that other nations may be in an even more difficult situation. Now with the mushrooming U.S. debt on top of an already severe economic crisis, the prospects for the U.S. economy relative to that of some of other global economies is being reevaluated from one of the strongest to perhaps only slightly better than average.

The dollar appreciated approximately 23% from July to November. This week the dollar moved below its 50 day moving average for the first time since the July bullish move again. Trend indicators such as the Aroon are starting to reflect a reversal in trend; expect trend-following systems to be short the dollar as the new trend becomes more pronounced.

Do not be surprised to see half of the 23% gain disappear in the next few months.

[source: StockCharts, VIX and More]

Wednesday, November 26, 2008

ProShares Rolls Out Commodity and Currency 2x and -2x ETFs

Just 12 days ago I came out with what I thought was a bold statement in Prediction: Direxion Triple ETFs Will Revolutionize Day Trading. I was going to do a follow-up to show how volume has skyrocketed in these ETFs, but Bespoke beat me to it in today’s 3x ETFs on Fire. Bespoke includes some excellent graphics that capture the extreme volatility in these ETFs as well as the snowballing volume trend.

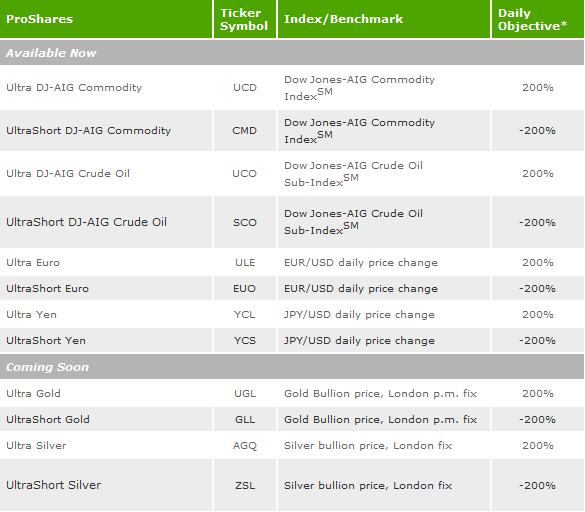
Not to be outdone by Direxion, ProShares is now rushing to market a new group of 2x and -2x ETFs focused on commodities and currencies.

Personally, I continue to transition more and more of my trading from stocks to ETFs. I think the ETF trend is here to stay.

[source: ProShares]

Friday, August 15, 2008

The Dollar Is UUP

I know there are many stock pickers out there who never thought they would put on commodity positions until a spate of commodity-related ETFs began appearing. Perhaps the next frontier for these former “equities only” investors is currencies.

Clearly currencies aren’t for everyone and in some respects they are the ultimate zero-sum game, but if anyone doubted their importance, just look how the markets have changed since the dollar reversed its course and started moving up a month ago.

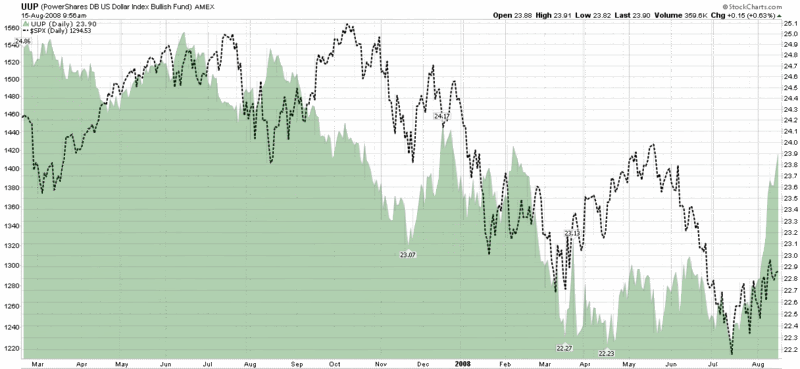
The chart below shows the UUP ETF, the dollar ETF whose formal name is the PowerShares DB US Dollar Bullish Fund. This ETF is based on the Deutsche Bank Long US Dollar Index Futures Index, where futures contracts are designed to replicate the performance of being long or short the US Dollar against the euro, Japanese yen, British pound, Canadian dollar, Swedish krona and Swiss franc. For more details, a good place to start is the UUP fact sheet.

It is important to note that while the dollar has made a substantial move over the course of the past month and is now breaking out of a three year downward channel, the dollar’s move is more the result of increasing concerns about foreign economies than it is about strength in the U.S. economy. The bottom line: the U.S. economic outlook has not improved over the past month; instead, things have taken on an even gloomier tone overseas.

Finally, I would be remiss in not pointing out that on balance, U.S. equities tend to react favorably to a rising dollar. The chart of the UUP shows the dollar’s rally off of the July low buffeting the S&P 500 index.

DISCLAIMER: "VIX®" is a trademark of Chicago Board Options Exchange, Incorporated. Chicago Board Options Exchange, Incorporated is not affiliated with this website or this website's owner's or operators. CBOE assumes no responsibility for the accuracy or completeness or any other aspect of any content posted on this website by its operator or any third party. All content on this site is provided for informational and entertainment purposes only and is not intended as advice to buy or sell any securities. Stocks are difficult to trade; options are even harder. When it comes to VIX derivatives, don't fall into the trap of thinking that just because you can ride a horse, you can ride an alligator. Please do your own homework and accept full responsibility for any investment decisions you make. No content on this site can be used for commercial purposes without the prior written permission of the author. Copyright © 2007-2023 Bill Luby. All rights reserved.
 
Web Analytics