Showing posts with label OVX. Show all posts

Tuesday, May 2, 2017

Euro Zone VSTOXX ETNs Land on U.S. Beaches!

Think the market is too complacent about this weekend’s election in France?  Worried that the euro area is going to crumble under the weight of Italy’s struggles?  Convinced that Greece, Portugal or Spain are just one more kicked can away from a disaster?

As of tomorrow, investors in the U.S. will have another way to translate these ideas into actionable trades with tomorrow’s launch of two new exchange-traded notes (ETNs) – EVIX (long euro zone volatility) and EXIV (inverse euro zone volatility) – from VelocityShares and UBS that put a European face on existing U.S. VIX-based products such as VIIX and perennial favorite XIV.

Based on the VSTOXX, the VIX-like volatility index for the EURO STOXX 50 Index of 50 blue-chip stocks from 11 euro zone countries, EVIX and EXIV should be familiar to those who are knowledgeable about VXX and VIIX on the long volatility side as well as XIV and SVXY on the short volatility side.  EVIX and EXIV are based on VSTOXX futures and have a target maturity of 30 days – a maturity that is maintained by rolling a portion of the portfolio each day and therefore subjecting both products to the vagaries of contango and backwardation.  In the event these are terms you are not familiar with, I strongly recommend that you click on the links above and educate yourself.  Believe it or not, this is the ninth year I have been talking about the VIX futures term structure, negative roll yield, contango and backwardation.  (Those who have been paying attention since the early days of VXX and VXZ have no doubt profited mightily from this knowledge.)

The beauty of EVIX and EXIV is that these products create so much flexibility for investors who maintain a global, cross-asset class view of volatility.  In the run-up to the first round of the French election, for example, VSTOXX spiked dramatically and pushed the VSTOXX:VIX ratio below 1.00, creating some interesting arbitrage opportunities and/or pairs trades in the process.  Now investors can trade euro zone volatility against U.S. volatility, use targeted hedges for risk that is specific to the euro zone or speculate more easily about the direction of volatility in the euro zone.

I encourage everyone to study the EVIX and EXIV prospectus closely.

This is a huge development in the volatility space and if options on EVIX and EXIV follow later this week, as expected, the volatility trading landscape will be much richer and more diverse. 

Now if we can only get liquid volatility products for gold volatility (GVZ) and crude oil volatility (OVX), I won’t even have to set out a stocking next to the chimney this Christmas.

While I’m at it, why are there no options on XIV?  This is such a popular high-beta product that it deserves options so traders can express a broader range of opinions on volatility.  Readers, it never hurts to nudge the CBOE on these issues.  An outpouring of popular sentiment can make a difference.

As the risk of charging off into full rant mode, I feel compelled to say that I hope volatility investors know a good thing when they see it.  It is a shame that VXST futures did not attract enough attention to hang around and that VMAX and VMIN are not trading with higher volumes.  One of the best volatility products ever created, ZIV, nearly died of neglect before investors finally paid it some attention.

As I see it, EVIX and EXIV as well as VMAX and VMIN are test cases for the future of the breadth of volatility products.  If you would like a diverse tapestry of volatility products in the future, it would not hurt to “buy local” volatility ETPs rather than sticking to the handful of already successful products.  If you don’t vote with your feet, you had better be happy playing in a small and rather limited sandbox.  I am fond of saying, “In volatility, there is opportunity!” – but that opportunity is a function of the richness of the various volatility product platforms.

Last but not least, I know Eurozone and eurozone are the preferred spellings, but I am sticking to the two-word “euro zone” with as much stubbornness as I can muster.  What can I say, I am short convention…

Further Reading:

For those who may be interested, you can always follow me on Twitter at @VIXandMore

Disclosure(s): net short VXX and VMAX; net long XIV and ZIV at time of writing.  The CBOE is an advertiser on VIX and More.

Sunday, November 20, 2016

Post-Election Risk Trending Up in Treasuries and the Euro, Down in U.S. Stocks

You can always tell when the crowd gets long the VIX and ends up on the wrong side of the trade.  “The VIX is broken!” becomes an oft-repeated refrain, as does “The markets are rigged!” and the usual list of exhortations from those who are in denial.  The current line of thinking is that the world must be much more dangerous, risky and uncertain as a result of a Trump victory, yet the VIX is actually down 31.4% since the election – ipso facto the VIX is broken.

While I have more than a small soft spot in my heart for the VIX, I will be the first to point that taking an Americentric, equity-centric view of the investment landscape is dangerous and naïve.  More often than not, the issues that end up having a strong influence on the VIX are born on foreign soil and/or in other asset classes.  Just look at the recent history in China, Greece, Italy, currencies and commodities to name a few.

When it comes to looking at implied volatility indices as a risk proxy, I prefer to survey the landscape across asset classes, geographies and sectors, which is why I have developed tools such as a proprietary Macro Risk Index (more on this shortly) that look at risk across asset classes, geographies and sectors.

In the graphic below, I have isolated a handful of volatility indices that cut across asset classes and geographies to show how these have moved in the eight days following the election.  Note that Treasuries (TYVIX) and the euro (EVZ) have been trending steadily higher since the election as uncertainty related to the future of inflation and interest rates in the U.S. has risen, while the relationship that the Trump Administration will have with our NATO allies and the European Union is also somewhat murkier. 

Gold implied volatility (GVZ) initially moved sharply higher following the election, but has since receded, as gold prices fell swiftly after the election, but have since stabilized.  Meanwhile, emerging markets saw dramatic selling immediately following the election, but have bounced during the course of the past week as fears and implied volatility (VXEEM) have subsided.  Last but not least, the moves in crude oil and crude oil implied volatility (OVX) have been the least remarkable of the group


[source(s):  CBOE, VIX and More]

In aggregate, the picture is a mixed one in terms of implied volatility, risk and uncertainty.  As is often the case, risk has become elevated in certain asset classes, such as Treasuries and the euro.  In other areas, such as U.S. equities – and their VIXian barometer – there are winners and losers, with the result that a net bullish outlook has moved equity implied volatility lower.  This is not to say that a Trump Administration – whose cabinet members and policy priorities are largely unknown at this juncture – will not increase risk in some areas.  More risk is certainly on the horizon and if history is any guide, an Americentric, equity-centric view of the investment world is likely to be slow in identifying those risks.

Related posts:


For those who may be interested, you can always follow me on Twitter at @VIXandMore


Disclosure(s): the CBOE is an advertiser on VIX and More

Tuesday, July 16, 2013

Guest Columnist at The Striking Price for Barron’s: How to Spot Risk Early

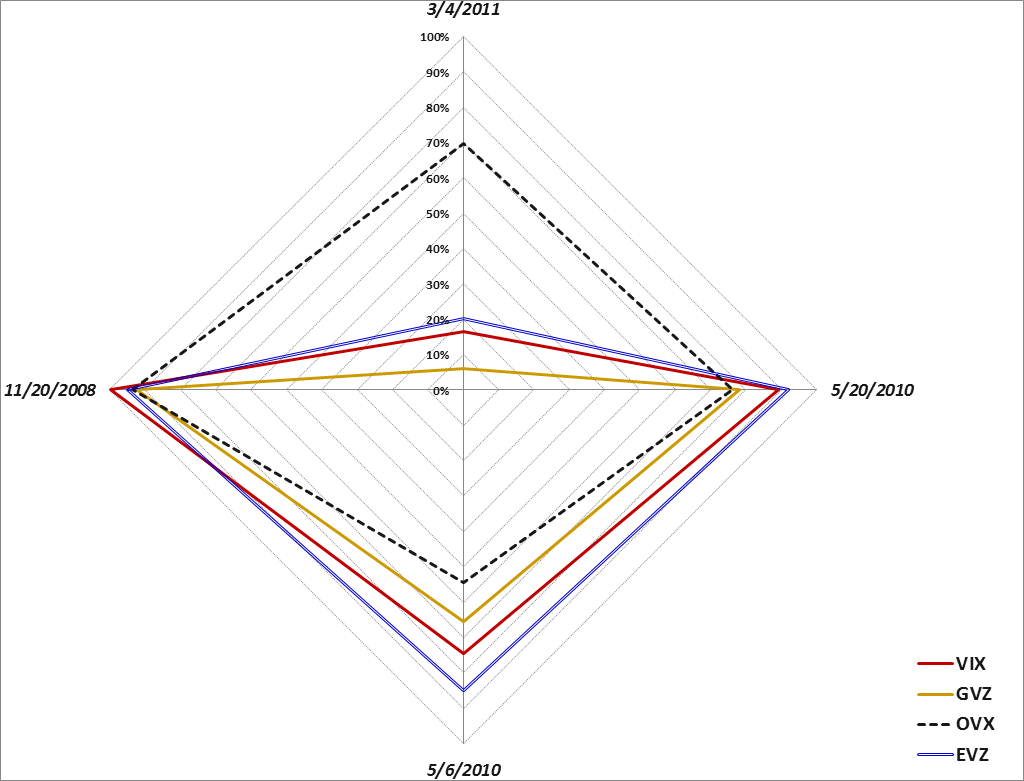
Today’s guest column, How to Spot Risk Early, at The Striking Price on behalf of Steven Sears at Barron’s, is the eleventh time I have had the opportunity to write a column for Barron’s. Today’s column picks up on a theme I addressed in a March 2011 article in Expiring Monthly which was titled, Evaluating Volatility Across Asset Classes. In that 2011 article, I introduce the concept of a volatility compass as a framework for evaluating the different types of volatility spikes that were seen in the 2008 financial crisis, the euro zone crisis as of May 2010, the Arab Spring in March 2011, and the May 6, 2010 flash crash.

[Volatility compass showing different levels of volatility across asset classes during four recent spikes in volatility. Source(s):VIX and More]

In the 2011 article I provide an overview of my thinking as follows:

“It is my belief that a better understanding of the volatility picture across asset classes will yield a better grasp of volatility events and help to identify a number of favorable trading setups.”

Later on I conclude the article with the following thoughts:

“For those who have studied sector rotation strategies and methods for trading geography-based ETFs, some of the analytical techniques used in those two disciplines can be carried over to an analysis of cross asset class volatility.

Ultimately, the study of volatility has both a science and art component to it, but a cross asset class approach provides a more broad-based holistic view of the volatility landscape and adds a little more science to the mix.

At some point, volatility becomes the study largely of contagion and falling dominoes. I can say without hesitation that a multi-disciplinary approach is essential to understanding contagion and dominoes and that a cross asset class analytical framework supplemented by tools such as the volatility compass is an effective way to approach that subject.”

In today’s Barron’s article, I expand upon the idea of four types of volatility indices and address volatility indices that provide a snapshot of geographical uncertainty and risk as well as broader measures of uncertainty and risk across asset classes such as U.S. Treasury Notes and currencies.

I will have more on this subject in the future, but for those interested in researching some of these subjects, I have highlighted some previous posts on different ways of thinking about uncertainty, risk and volatility below.

Related posts:

A full list of my Barron’s contributions:

Disclosure(s): none

Friday, December 30, 2011

CBOE To Launch Futures on Emerging Markets Volatility (VXEEM)

One of the predictions I made for 2011 was that the trend toward what I have labeled “atomic volatility” (a lessening of the scope of the underlying for options contracts and/or the duration of those contracts) would accelerate.

Back in March 2011, the CBOE helped to usher in the atomic volatility era when they rolled out volatility indices using the VIX methodology for six sector and geography ETFs:

  • iShares MSCI Emerging Markets Index Fund (VXEEM)
  • iShares Trust FTSE China 25 Index Fund  (VXFXI)
  • iShares MSCI Brazil Index Fund  (VXEWZ)
  • Market Vectors Gold Miners Fund (VXGDX)
  • iShares Silver Trust (VXSLV)
  • Energy Select Sector SPDR (VXXLE)

Later in March, the CBOE rolled out futures based on the gold volatility index (GVZ), which was launched back in August 2008, at the same time as the euro volatility index (EVZ) and several weeks after the launch of the OVX, known affectionately as “the Oil VIX.” [Those who are interested in the sequencing of the launch of various volatility measures should refer to The Evolution of the Volatility Index Family Tree.]

Now the CBOE is taking the next step with VXEEM, the volatility index that is based on the popular emerging markets ETF (EEM), and offering futures on that index. The launch of these futures contracts is set for January 9th and will initially include contracts with expirations in February, March, April and May. Note that the expiration cycles for these contracts are the same as those for the VIX futures and options, meaning that they will expire on Wednesdays (February 15, March 21, April 18 and May 16) and can last be traded on the Tuesday immediately following the expiration. For more information, check out the CBOE’s VXEEM splash page and information circular.

One of the reasons I think products based on EEM and VXEEM have a good chance of being successful is that emerging markets are typically a highly volatile area – much more so than the basket of stocks included in the S&P 500 index on which the VIX is based. Right now, for instance, EEM has a 60-day historical volatility that is more than 50% higher than that of the SPX. All this means that short-term traders should find VXEEM products (futures as well as options and ETPs, assuming they are in the pipeline) to be the types of high-octane trading vehicles that are well-suited to some of their favorite strategies, much like leveraged ETPs and VIX-based products.

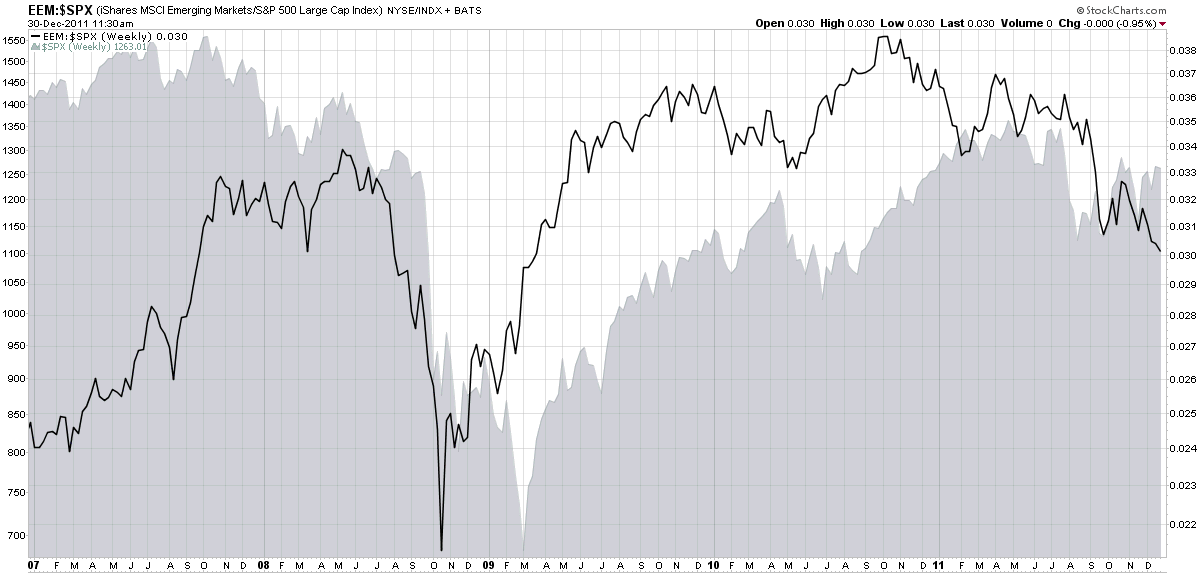
Additionally, as the chart below reminds us, emerging markets sometimes move in cycles that are distinct from U.S. stocks. Note that the ratio of EEM to SPX has varied wildly over the course of the past five years and has had different bottoms and tops than the SPX has. Whether this phenomenon will continue into the future (influenced strongly by China) remains to be seen, but the role of emerging markets relative to developed markets should be watched closely in 2012.

Related posts:

[source(s): StockCharts.com]

Disclosure(s): none

Wednesday, March 24, 2010

CME to Use VIX Methodology for New Crude Oil, Corn, Soybean and Gold Volatility Indices

Earlier this month, the Chicago Mercantile Exchange (CME) announced they are collaborating with the Chicago Board Options Exchange (CBOE) to bring to market four new volatility indices which are scheduled to be launched in the third quarter of 2010.

The CBOE will use the VIX methodology to calculate volatility indices for four commodities: crude oil; corn; soybeans; and gold.

Commenting on this new collaborative effort between the CBOE and the CME, CBOE Executive Vice President Richard G. DuFour noted, “VIX has become the accepted standard for measuring market volatility, and the new products that will result from this agreement illustrate the broad utility of this methodology.”

Personally, I find it difficult to disagree with DuFour’s assessment and am excited by the prospect of volatility indices being extended to the CME and commodities. Of course the CBOE has already rolled out two commodity-related volatility indices with the CBOE Crude Oil Volatility Index, also known as the “Oil VIX” (OVX) and the CBOE Gold Volatility Index, also known as the “Gold VIX” (GVX). Should the joint CME/CBOE volatility indices gain broad acceptance, I would not be surprised to see additional commodity-related volatility indices to follow.

For more on related subjects, readers are encouraged to check out:

Disclosure(s): none

Sunday, July 12, 2009

Chart of the Week: Crude Oil and Volatility

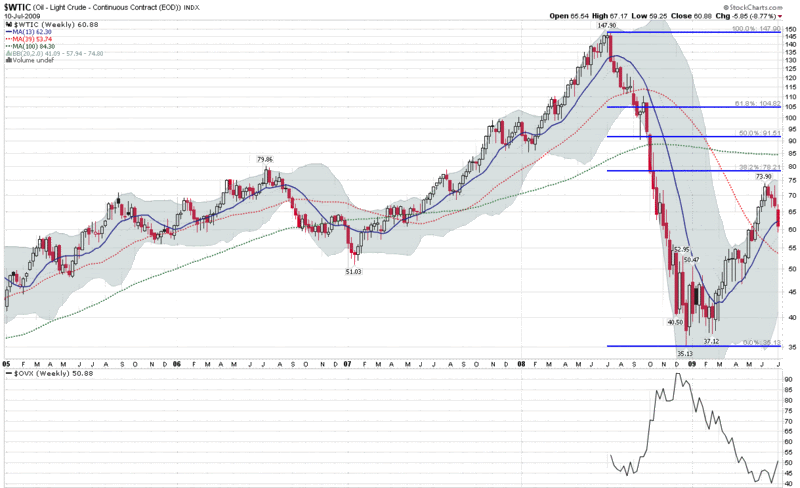
While stocks have gyrated wildly during the course of the past year, fluctuations in the price of crude oil have been even more dramatic. Crude oil hit a high of 147.90 one year ago yesterday, on July 11, 2008, yet fell 76.2% to reach a low of 35.13 just five months later.

The chart of the week, below, captures the weekly changes in the price of West Texas Intermediate crude oil since the beginning of 2005. Note that the 39 week moving average (solid red line), which encompasses three quarters, aligns very closely to the classic 200 day moving average that is frequently found in charts of daily bars. Crude oil made a bottom 29 weeks ago and as a result, the 39 week (and 200 day) moving average should begin to rise during the course of the next 2-3 weeks, providing technical support for this commodity.

Note also that the Oil VIX (OVX), which was launched one year ago this coming Wednesday reflects the volatility in crude oil prices during this period. While the VIX never reached 90 during the market turmoil, the OVX hit 103.54 in November and currently sits at 50.88, some 75% higher than the VIX.

[source: StockCharts]

Tuesday, September 23, 2008

Gold and Gold Volatility

With the unfolding of the latest chapters in the financial crisis, gold has received considerable attention as a safe haven investment. The rush into gold was greatly exacerbated when investors began to lose confidence in money market funds following the ‘breaking of the buck’ at Reserve Primary Fund last Tuesday.

One week later, there is still a great deal of fear and anxiety in the financial markets and gold is trading at its highest level in almost two months.

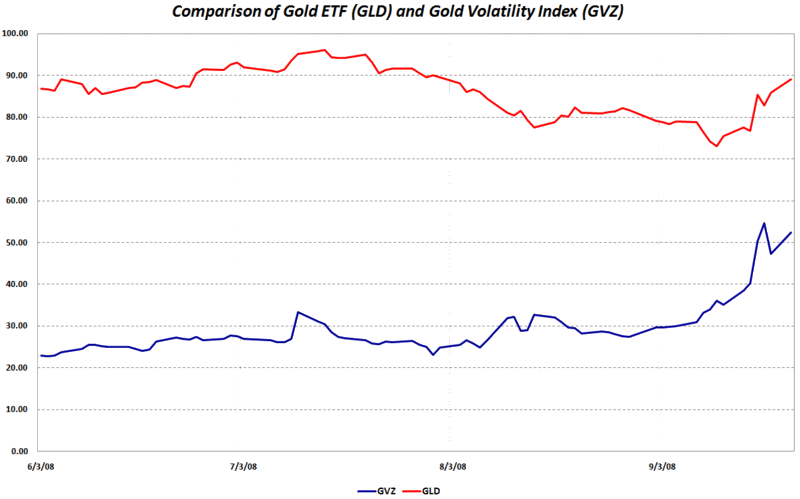
In the chart below, I have plotted the movements of GLD, the most popular gold ETF, along with GVZ, the CBOE’s gold volatility index (or Gold VIX) which was launched back on August 1st and is based on GLD.

As is the case with OVX (CBOE oil volatility index), there has generally been a positive correlation between the price of gold and gold volatility index. Note that in early August, the correlation between GLD and GVZ switched from positive to negative, as gold volatility began to rise even as gold prices declined. On about September 11th, however, the correlation between GLD and GVZ swung back to a strong positive one, where it has held for the past two weeks. It may just be a coincidence that this switch in correlation occurred just before a week of extreme financial panic, but I wanted to at least plant that seed and note that I will be following these and other related subjects as I evaluate some of the new volatility indices in this space going forward.

[source: VIX and More]

Thursday, August 28, 2008

Gustav and the Oil Volatility Index (OVX)

Since first becoming a tropical depression on the morning of August 25th, Gustav became a tropical storm, then a hurricane, and is now back to being a tropical storm – at least for the time being. Most models have Gustav reaching hurricane strength again later today, perhaps as soon as the next National Hurricane Center (NHC) update, which is only a half hour away.

If anyone is interested in watching a movie of the evolution of Gustav and the evolution of the five day forecast cone, I can highly recommend the Gustav graphics archive at the NHC web site.
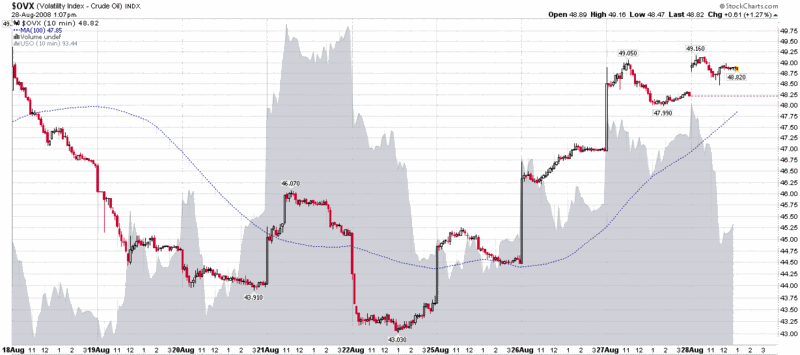
At least as interesting as the changing fortunes of Gustav and predictions for Gustav’s future has been the market’s reaction to crude oil and natural gas prices. In the graph below, courtesy of StockCharts.com, I have captured the change in crude oil prices (via the USO crude oil ETF) as well as the change in the new ‘Oil VIX’ (OVX) that was recently launched by the CBOE. Note how volatility (the candlesticks) has generally followed the underlying up and down, though it has remained elevated as oil prices (the gray area chart) trended down this morning.

Those who are looking at options plays on oil and gas are likely to see long positions facing an uphill battle against time decay in the current highly speculative environment. As a result, spreads and short volatility plays should look more attractive as alternatives.

Tuesday, August 12, 2008

Crude Oil Volatility Slides with Crude Prices

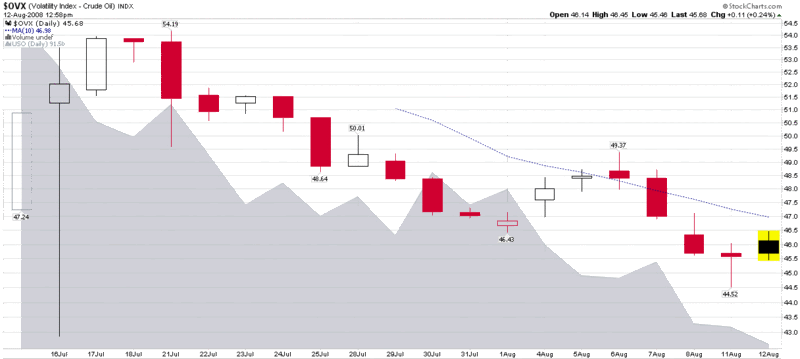
Based on the large number of Google searches that have recently been landing on the blog, there is considerable interest in the CBOE’s new “Oil VIX” or crude oil volatility index (ticker OVX), which was launched exactly four weeks ago today.

While it is still too early to pluck much in the way of useful conclusions from the OVX, I have included a chart of the new volatility index below. So far what may surprise most newcomers to crude oil volatility is that the OVX has fallen in concert with crude oil prices (as measured by the USO crude oil ETF). My analysis of USO options suggests that crude oil implied volatility and the price of the underlying are likely to be largely uncorrelated going forward, which is in sharp contrast to the strong negative correlation between equities and their corresponding volatility indices, such as the VIX, the VXN, and the RVX.

Monday, August 4, 2008

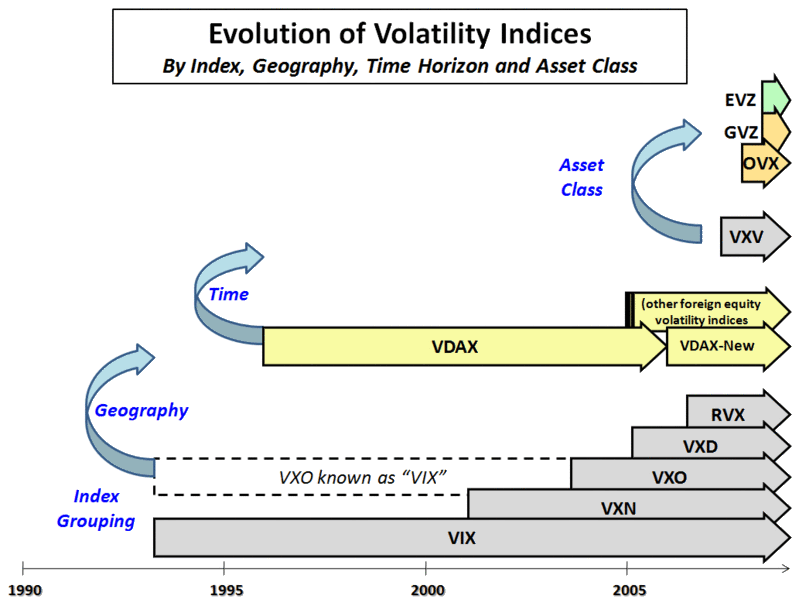
The Evolution of the Volatility Index Family Tree

In the beginning, there was the VIX. Eventually, the reach of the VIX was deemed too narrow and the volatility index universe was expanded to include the VXN, VXO, and a host of other volatility indices based on various U.S. equity indices. First an American phenomenon, volatility indices soon began sprouting up overseas, notably in the form of the German VDAX, but more recently reaching Asian shores with the April launch of the India VIX.

Having expanded geographically, volatility indices also recently began to expand the time horizon in which they evaluated volatility with the launch of the VXV, the 93 day version of the VIX.

In the last three weeks, the CBOE has started moving past equity-based volatility indices into commodity and currency volatility indices. The OVX (“Oil VIX”) was the first such effort. Last Friday the CBOE launched two new volatility indices:

  • GVZ – CBOE Gold Volatility Index (“Gold VIX”), based on the GLD ETF

  • EVZ – CBOE EuroCurrency Volatility Index (“Euro VIX”), based on the FXE ETF

The graphic below summarizes some of the highlights across the volatility index evolutionary timeline.

It remains to be seen whether the VIX branding and labeling will stick to oil, gold and the euro. Five years ago, the VIX label was transported from the S&P 100 (OEX) to the S&P 500 (SPX), but until the past few months there has been only one VIX. With the recent arrival of the India VIX, Oil VIX, Gold VIX, and Euro VIX, there is ample room for confusion about what exactly “VIX” means. On the other hand, “VIX” is really just shorthand for a generic “volatility index.” If this potential confusion can be overcome, the CBOE may have found a way to enhance and extend the most successful product and brand they have ever launched – and in the process dramatically change the volatility landscape.


Tuesday, July 22, 2008

Natural Gas Implied Volatility Spiking

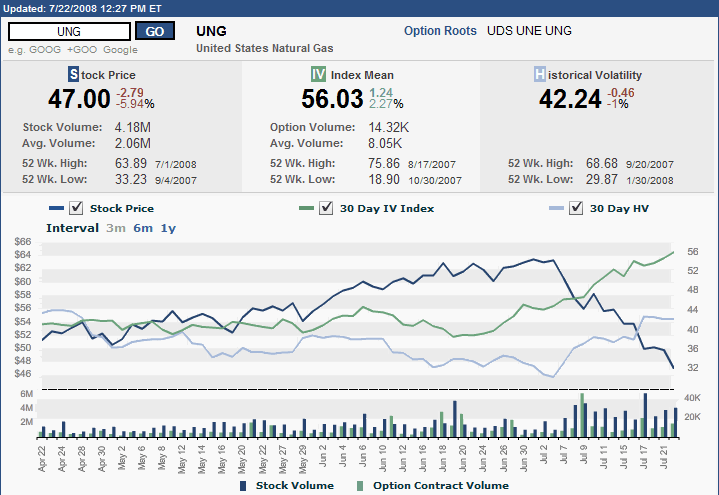
Perhaps it is just a coincidence that the “Oil VIX” appeared on the scene just as the implied volatility in oil futures (or at least as captured by USO) was hitting an eight month high. The “Oil VIX” (formally known as the CBOE Crude Oil Volatility Index; ticker OVX) and crude oil may get the lion’s share of the energy headlines, but lately it has been natural gas that has been making the more dramatic moves.

A look at the three month chart of UNG (the natural gas ETF that is the counterpart to USO), courtesy of the ISE, shows implied volatility steadily increasing over the past five weeks, with the gap between implied volatility and historical volatility continuing to widen – all while natural gas has pulled back about 27%.

Natural gas implied volatility levels are higher than oil implied volatility levels at the moment, and the pullback in natural gas presents some interesting trading opportunities. Some momentum players are already short here and some value hunters are buying on weakness, particularly if they believe in the long-term commodity bull and other supply and demand issues that are specific to natural gas.

The case for natural gas trading sideways from current levels is hard to make. Directional bets are expensive, due to high IV. Two trades I am looking hard at, with a bullish directional bias, are bull put spreads and call backspreads. The former limits upside and downside; the latter is more aggressive and more risky.

Tuesday, July 15, 2008

CBOE Launches "Oil VIX" (OVX)

Today the CBOE launched an "Oil VIX" (OVX) based on options on the USO crude oil ETF.

According to the CBOE press release, the exchange is in the process of expanding their volatility index product line into commodities and foreign currencies.

I think this is an exciting development that just happens to fit nicely with several chapters in my upcoming book.

I'll have a lot more to say about the OVX and other CBOE volatility products going forward.

DISCLAIMER: "VIX®" is a trademark of Chicago Board Options Exchange, Incorporated. Chicago Board Options Exchange, Incorporated is not affiliated with this website or this website's owner's or operators. CBOE assumes no responsibility for the accuracy or completeness or any other aspect of any content posted on this website by its operator or any third party. All content on this site is provided for informational and entertainment purposes only and is not intended as advice to buy or sell any securities. Stocks are difficult to trade; options are even harder. When it comes to VIX derivatives, don't fall into the trap of thinking that just because you can ride a horse, you can ride an alligator. Please do your own homework and accept full responsibility for any investment decisions you make. No content on this site can be used for commercial purposes without the prior written permission of the author. Copyright © 2007-2023 Bill Luby. All rights reserved.
 
Web Analytics