Showing posts with label USO. Show all posts

Monday, March 28, 2022

Point Hedges ETP Performance During Invasion of Ukraine

On Friday in Flight-to-Safety ETP Performance During Invasion of Ukraine, I reviewed the performance of some of the traditional flight-to-safety ETPs (Treasuries, gold, currencies and volatility) that are often used to hedge an equity-centric portfolio. 

Evaluating the performance of these ETPs since Russia invaded Ukraine a little over a month ago, I found some rather lackluster numbers.  As a group, these products have not even broken even since the invasion of Ukraine.

This time around, I have elected to look at the performance of some less traditional ETPs, including some much more targeted products that I have referred to in the past as “point hedges.”  Specifically, I looked at areas where exports from Russia and Ukraine are a significant portion of the global export market and whose disruption could have a significant impact on the global balance of supply and demand.  As it turns out, these commodities were easy to identify and the price dislocations have generally dwarfed the appreciation one might have been able to realize with more traditional hedges.

These products include: 
USO: West Texas Intermediate Crude Oil (solid red line)
UNG: Natural Gas (dark purple line)
DBB: Base Metals (light green line)
DBA: Agriculture (violet line)
WEAT: Wheat (light blue line
CORN: Corn (black line)
ITA: Aerospace & Defense (medium blue/green line)

[Note that nickel (JJN) should be on this list, but in part due to some chaos and mismanagement at the London Metal Exchange, JJN prices jumped have had multiple spikes of more than 100% and dwarf the performance of other ETPs in this graphic.  Additionally, for the international crude oil market, Brent crude oil (BNO) is typically a better measure than USO, but since the  Russian invasion of Ukraine, the two ETPs have only differed in performance by about 2%.]

It is easy to play Monday morning quarterback and say that with hindsight it is easy to pick the winners, but anyone who studied Ukraine’s biggest contributions to the global export market could have deduced that a supply shortage in wheat and corn was likely and for Russia, natural gas, crude oil and nickel were three areas of high risk in terms of their strategic value to the West, with wheat and corn also part of the equation.  I threw in aerospace & defense as a general military hedge.

Unlike the inconsistent and largely negative performance of more traditional flight-to-safety ETPs since the Russian invasion, the point hedges above have all seen gains of at least 3% during this period – and if you remove aerospace & defense from the mix, all the gains are at least 6.8% or higher. 

This is not to say that more narrow point hedges will usually outperform the broader traditional hedges during periods of geopolitical turmoil, but rather to remind readers that instead of a more generic hedge, a targeted hedge or speculative trade often has the potential to deliver substantially greater returns, such as the median 13% returns from the group of ETPs above.

This also means, of course, that should there be progress in the talks between Russia and Ukraine that each of these point hedges is exposed to the potential of a significant decline in price.


[source(s):  StockCharts.com]

Further Reading:
Flight-to-Safety ETP Performance During Invasion of Ukraine
Safe Haven Options Shrinking?
Chart of the Week: Flight-to-Safety ETPs
Revisiting the Flight-to-Safety Trade
Chart of the Week: The Flight-to-Safety Trade
Why Not Point Hedges?
Cheating with Partial Hedges
Forces Acting on the VIX
A Conceptual Framework for Volatility Events

While it has not been updated in a while, new readers may also enjoy older posts that have been tagged with the Hall of Fame label.

For those who may be interested, you can always follow me on Twitter at @VIXandMore

Disclosure(s): Net short VXX and long USO, DBB, DBA and ITA at time of writing

Saturday, March 12, 2016

Playing Volatile Oil Prices (Guest Columnist at Barron’s)

Today I penned my eighteenth guest column for Barron’s, filling in for Steve Sears and the venerable The Striking Price options column.  Looking back, I was surprised to see that this is the eighth year I have been contributing to Barron’s and while I have generally tilted in the direction of volatility topics during this period, I always like to keep my thoughts topical, but with an unusual twist or two.

In Playing Volatile Oil Prices:  The ins and outs of the backspread trade, I tackled the recent huge moves in crude oil prices, touched upon some of the fundamental and technical influences on the price of crude and used the current environment of chaos following a huge short squeeze as a backdrop to talk about the opportunities associated with a call backspread.

As Barron’s prefers to structure trade ideas around ETPs or single stocks, I elected to use the popular U.S. Oil Fund (USO) ETP as my underlying, though I also like the idea of call backspreads in oil and gas exploration and production (XOP) or Russia (RSX), though the Russia ETP has limited liquidity.  As an aside, readers of this blog will surely know that the prices of futures-based ETPs such as USO and VXX, among others, are strongly influenced by the roll yield associated with the shape of the futures curve.  For this reason, USO acts most like West Texas Intermediate crude oil in the short-term, but over longer periods the price of USO is more strongly affected by the term structure of crude oil futures, similar to the issues associated with VXX and the VIX.

While the Barron’s column discusses the rationale for the trade and some of the details surrounding it, I thought I would post a profit and loss graphic for the USO April 1x2 10.5/11.5 call backspread here as a companion to the Barron’s material.


[source(s):  LivevolPro / CBOE, VIX and More]

I am sure this particular call backspread trade idea is not for everyone, yet I think it is important for everyone to internalize backspreads, their P&L chart and some of the tweaks that can be made.  For instance, one can dramatically change probabilities and payoffs by modifying strikes (including making use of in-the-money strikes, for instance) and expirations, whereas the credit or debit for entering the trade is something that can be strongly influenced by adjusting the ratios to the likes of 2x3, 4x5, etc.

Also of note, readers who are new to backspreads may wish to brush up on bear call spreads (and bull put spreads) before tackling backspreads, as I like to think of backspreads as short vertical spreads that are supplemented by the purchase an extra out-of-the-money option in the time-honored tradition of swinging for the fences with some of the profits from a spread trade.

As I concluded in the column, “In the options world, there are very few trades where you can make money should the underlying shares move sharply in either direction. Backspreads are intriguing in that they have limited risk, unlimited reward (in one direction), and can make money if the underlying moves either up or down.”

Related posts:

A full list of my (18) Barron’s contributions:


Disclosure(s): long XOP and short VXX at time of writing; Livevol and CBOE are advertisers on VIX and More

Wednesday, February 1, 2012

Natural Gas, Contango and UNG

I have talked at length in this space about the contango and negative roll yield issues that plague VXX. Periodically these discussions trigger a question from a reader about the impact of contango on some of the other ETPs.

Just to be clear, as far as ETPs are concerned, contango and backwardation issues are limited solely to those products which hold futures in their portfolio. The large majority of futures-based ETPs are in the commodity space, but in theory at least, any security for which there are futures could end up with a futures-based ETP. Fortunately, ETFdb keeps a handy list of these products at their Futures-Based ETF page.

The main reason why I talk so much about contango in the context of VIX-based ETPs is that the VIX products have a tendency to produce huge levels of negative roll yield (at a rate of 11% per month at the moment in the front two months of the VIX futures) relative to the other products.

Outside of the VIX product space, contango is probably most notorious in crude oil and natural gas – and the two most popular ETPs for these commodities, USO and UNG. Still, contango in these products is generally much smaller than it is with VXX, but right now contango is unusually high in UNG. While contango (front two months) in USO is only 0.4% right now, it is actually at 7.6% per month in UNG.

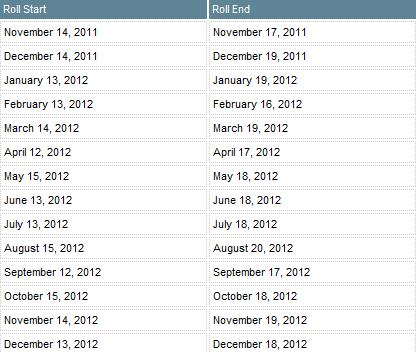
Note that unlike VXX, which has a daily roll, UNG rolls its entire portfolio over the course of four days per month. Better yet, UNG publishes a schedule of their roll dates, reprinted below, though it does come with the disclaimer, “Roll Dates are projected and subject to change without notice.”

So…while it has already been a great year for those who are short natural gas, it is possible that persistent contango will make short UNG positions even more profitable going forward.

Finally and perhaps most important of all, it is critical to keep in mind that steep contango does not happen willy nilly. Instead, contango is essentially a reflection of where the market expects prices to be headed (net of the cost of carry) in the future. Looked at in this context, UNG contango of 7.6% means that the reason shorts are receiving a 7.6% benefit from the negative roll yield is that the market anticipates prices will rebound 7-8% or so over the course of the next month. Contango and roll yield are not a free lunch by a long shot, but over the long term, if risk can be properly managed, positions that benefit from contango should be able to finance at least a few lunches.

Related posts:

[source(s): United States Natural Gas Fund]

Disclosure(s): short VXX and UNG at time of writing

Thursday, December 15, 2011

Safe Haven Options Shrinking?

Back in February, in Chart of the Week: Flight-to-Safety ETPs, I examined the year-to-date performance of five exchange-traded products (ETPs) that are central to the flight-to-safety trade: volatility (VXX), gold (GLD), crude oil (USO), the dollar (UUP) and U.S. Treasuries (TLT). At that time, the Arab Spring was considered to be the main risk to portfolios and I noted that with the exception of crude oil, none of these supposedly safe havens had been profitable for the first two months of the year.

Ten months later the risk landscape is a much different one and TLT (+33.7), GLD (+10.2%) and VXX (+8.4%) have all lodged fairly impressive gains. While the dollar is flat, the picture in crude oil depends on where you look, with USO down 6.0% and BNO (a much better measure of global crude oil prices) up 15.7%.

So while it seems as if the safe havens have had a good year, a large part of that picture has changed during the first two weeks of December. Most notably, implied volatility, gold and crude oil have declined sharply in concert with stock prices, with all three acting as ‘negative hedges’ and adding insult to injury for those who were looking to cushion losses instead of exacerbate them.

Of the big five flight-to-safety vehicles, this leaves just U.S. Treasuries and the dollar as having been successful during the first half of December. With rates on the U.S. Treasuries at all-time lows and seemingly everyone waiting to time the Bill Gross short trade better than the bond master himself, this leaves only a currency that is less debased than most of its competition.

So where is the safe haven? Not too many years ago, many thought real estate was the best safe haven.

Right now one interesting short-term play is EUO, the ProShares UltraShort euro ETF, where the ETFs objective is to move -2x the daily direction of the euro.

Related posts:

[source: StockCharts.com]

Disclosure(s): short VXX and TLT at time of writing

Sunday, February 27, 2011

Chart of the Week: Flight to Safety ETPs

It has already been an interesting year for students of market sentiment, volatility and geopolitical influences on financial markets. We have seen revolutions of various sizes and shapes in the likes of Tunisia, Egypt and Libya, with smaller uprisings in Bahrain, Algeria and elsewhere in North Africa and Middle East. For the most part, volatility in the equity markets has been rather muted prior to the Libyan revolution and its influence on crude oil prices.

In this week’s chart of the week, I examine the year-to-date performance of five exchange-traded products (ETPs) that are central to the flight-to-safety trade. They include volatility (VXX), gold (GLD), oil (USO), the dollar (UUP) and U.S. Treasuries (TLT).

Note that with the exception of crude oil, the political unrest in North Africa and the Middle East has not been disruptive enough to make these trades profitable ones in 2011, though there has been an uptick across the board since violence heated up in Egypt on January 25th and in Libya starting on February 15th. The VXX chart does an excellent job of capturing the nature of the VXX gambit. Even with the geopolitical turmoil and spike in crude oil prices, this ETN is still down 16.2% on the year. The volatility spikes have provided VXX longs with very short-lived opportunities to capitalize on heightened market anxiety, with the chart reflecting the continued downward trend and high volatility in this ETN. [As an aside, a similar chart swapping VXZ for VXX would show very little difference in terms of performance.]

So the next time you think about a long volatility position in the context of a geopolitical crisis, give some strong consideration to some alternative flight-to-safety plays.

Related posts:


[source: ETFreplay.com]

Disclosure(s): long VXZ, short VXX, USO and TLT at time of writing

Wednesday, June 2, 2010

Turmoil in the Oil Patch

Several factors have combined to create turmoil in the oil patch. Most notably, the Deepwater Horizon oil spill has hammered the stocks of BP and Transocean (RIG), while tainting the entire oil and oil services (OIH, XES) sector. On top of the spill, the European sovereign debt crisis has generated concerns about an economic slowdown of the European region and beyond, while manufacturing data and other news out of China hints at the possibility of weakness in the most significant area for future growth in energy demand.
In short, valuations across the sector are way down and yet the long-term supply and demand imbalance will likely suffer no more than a small dent as a result of the events of the last couple of months.
The energy sector has a very promising future and I am looking to add to existing positions on weakness. As the chart below shows, there are some indications that crude oil (USO) may have put in a bottom and the exploration and production ETF (XOP) may also be beginning a bottoming process as well. Outside of fossil fuels, alternative energy plays in solar (TAN, KWT) and wind (FAN, PWND) are somewhat suspect in that critical governmental subsidies from the likes of Spain and Germany appear to be a victim of the sovereign debt crisis. Still, these alternative energy plays, including some broad-based alternative energy ETFs (GEX, PBD), have also been marked down dramatically and should also benefit as crude oil prices start to rebound and governments come under increasing pressure to make use of ecologically sustainable energy sources.
For more on related subjects, readers are encouraged to check out:


[source: ETFreplay.com]

Disclosure(s): long OIH and XOP at time of writing

Friday, March 26, 2010

Volatility Skew Charts from Livevol

Yesterday’s post on ETFreplay.com triggered so many favorable comments about this site and their graphics that it occurred to me I had neglected to mention that Livevol has added some new volatility skew graphics to Livevol Pro.

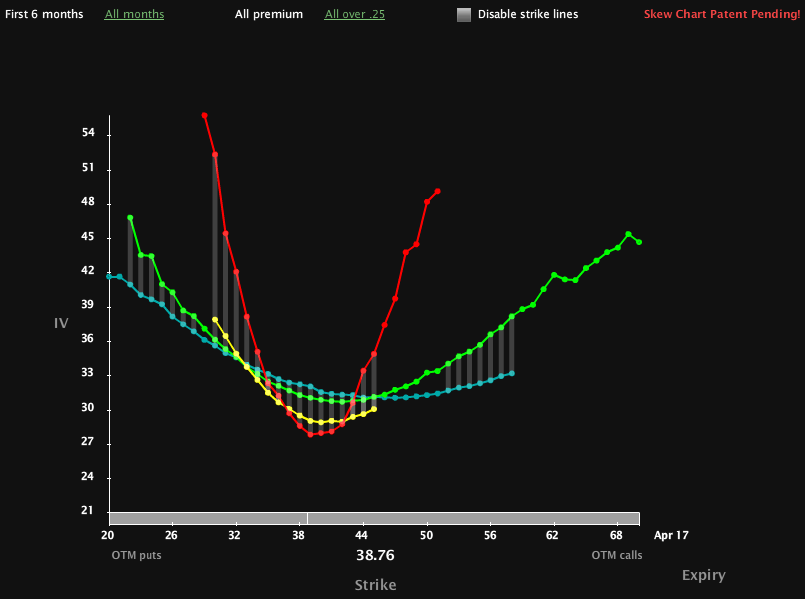
In the chart below, I have captured a snapshot of the implied volatility skew in USO, the crude oil ETF. With USO at just under 39 as I type this, the Livevol graphic captures the IV skew in the April (red line), May (yellow line), July (green line) and October (blue line) options. The April front month options have a steep smile, while the July options reflect the more classic flatter smile. Note that the May options look more like a smirk. I have not discussed volatility skew much to date, but I think it is time the blog dove into the Greeks, volatility skew and some more advanced options analytics, so this is definitely on my list of things to do going forward.

If anyone wishes to learn more about these skew graphics and get a better sense of how to interpret them, a good place to start is at the Livevol blog.

Finally, I can’t help but wonder whether I am the only one who thinks about the Aurora Borealis while looking at these skew charts…

For more on related subjects, readers are encouraged to check out:


[source: Livevol Pro]

Disclosure(s): Livevol is an advertiser on VIX and More

Thursday, March 25, 2010

ETFreplay.com Brings ETFs, Volatility and Charts Together Under One Roof

As a full-time investor and part-time blogger, I have a weakness for web sites that focus on ETFs, volatility and charts – three of the subjects I feature prominently in this space. For this reason, I was excited when ETFreplay.com appeared on the scene earlier this year specializing in ETFs, offering some unique and compelling graphics, and demonstrating an interest in volatility.

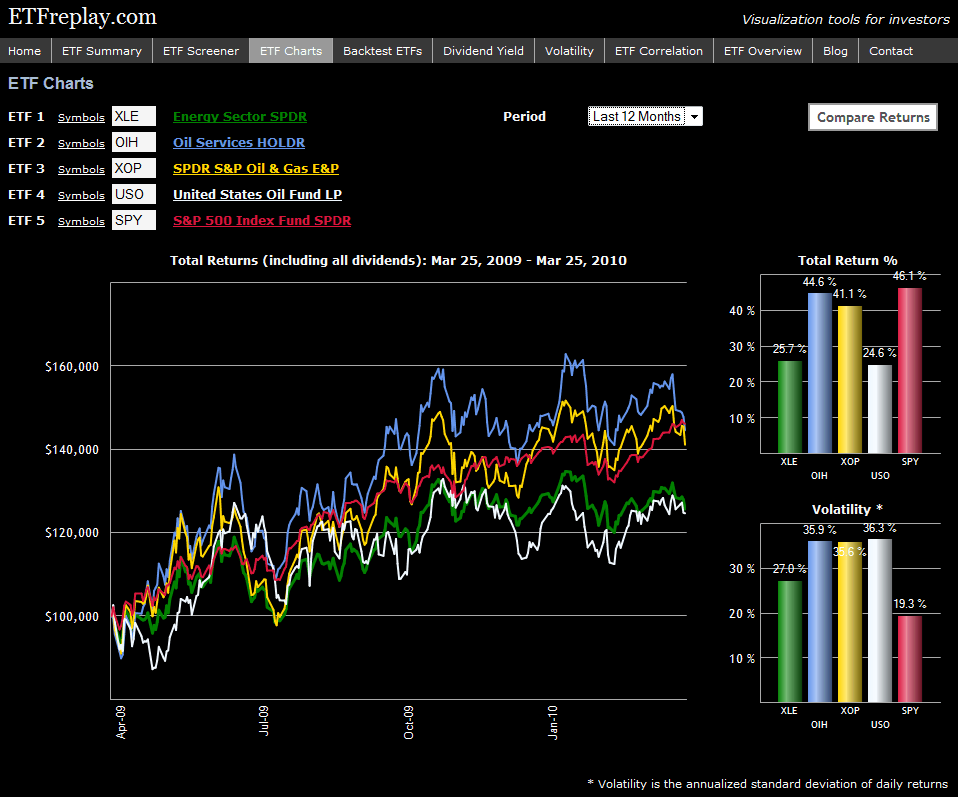
The site is still evolving, but is already a fun an informative destination, particularly for investors who are interested in ETFs. Some of the functionality currently offered includes screening, back testing, correlations, charting, etc. There is also a blog which provides graphics and commentary on a number of issues related to ETFs. The content is excellent, but the graphics are what inspired the tagline, “Visualization tools for investors.” I have included one example graphic below in which I decided to compare the performance and volatility of four popular energy ETFs (XLE, OIH, XOP and USO) relative to the S&P 500 ETF (SPY) over the course of the past year. I'll let the chart speak for itself.

In my opinion, there only a handful of top tier ETF web sites out there. While it may still be a little too early to add ETFreplay.com to that list, based on the speed at which the site is improving, I suspect it will not be long before that gap is closed.

For more on related subjects, readers are encouraged to check out:


[source: ETFreplay.com]

Disclosure(s): long XOP at time of writing

Friday, July 31, 2009

Three Good Articles on the VIX

I continue to be amazed at the sustained level of interest in the VIX and other measures of investor anxiety and volatility, now that the VIX is down 72% from its high.

Today I was pleased to see three excellent articles on the VIX and VIX-related subjects. In no particular order:

Jared at Condor Options asks and answers a question on the minds of many as of late: Why Do VIX Futures Remain High? He shares some graphics from his excellent Volatility Tracker feature and offers a reminder that “the reason those VIX futures remain higher is that traders are willing to pay for November and December SPX options at a higher implied volatility – so any portfolio insurance purchased now will already have this information priced in.”

Bradley Kay at Morningstar takes up a related question in Is Volatility Cheap Yet? He discusses VIX futures and the VXX futures ETN at some length and offers a reminder that “these futures are also subject to the same dangers of contango that hurt similar rolling near-month futures investments in United States Oil (USO) and United States Natural Gas (UNG) earlier this year.” Kay concludes, in concert with my own thinking, that “until this contango starts to flatten and the spot VIX falls to levels more in line with historical norms, we do not think these ETNs provide an attractive long-term risk-reward trade-off.” I do think VXX can be traded effectively across relatively short-term time frames, but the contango roll risk or term structure decay should not be dismissed. I will do a deeper dive into this subject in the near future.

Last but not least, Adam at Daily Options Report (note the new web site) discusses the Credit Suisse Fear Barometer (CSFB) in About that CSFB Index and comes down in favor of a modification proposed by Ryan Renicker of New Edge Group. I need to put my hands on a full set of historical data before drawing any meaningful conclusions about the CSFB, but I like the logic and construction behind a fear-based index denominated in cost of collar data. From what I have seen of the CSFB charts, however, I will approach this one with a fair degree of skepticism.

Thursday, August 28, 2008

Gustav and the Oil Volatility Index (OVX)

Since first becoming a tropical depression on the morning of August 25th, Gustav became a tropical storm, then a hurricane, and is now back to being a tropical storm – at least for the time being. Most models have Gustav reaching hurricane strength again later today, perhaps as soon as the next National Hurricane Center (NHC) update, which is only a half hour away.

If anyone is interested in watching a movie of the evolution of Gustav and the evolution of the five day forecast cone, I can highly recommend the Gustav graphics archive at the NHC web site.
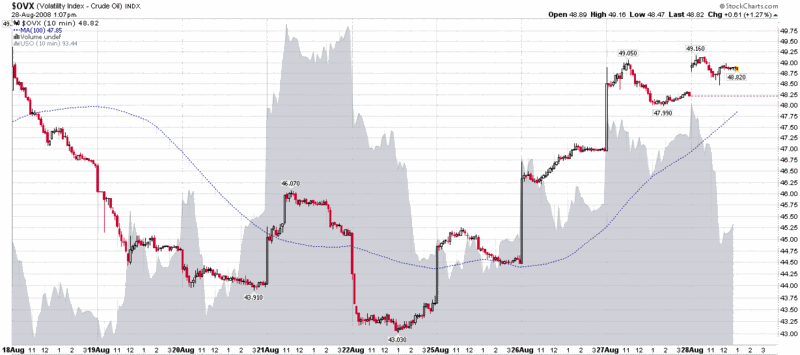
At least as interesting as the changing fortunes of Gustav and predictions for Gustav’s future has been the market’s reaction to crude oil and natural gas prices. In the graph below, courtesy of StockCharts.com, I have captured the change in crude oil prices (via the USO crude oil ETF) as well as the change in the new ‘Oil VIX’ (OVX) that was recently launched by the CBOE. Note how volatility (the candlesticks) has generally followed the underlying up and down, though it has remained elevated as oil prices (the gray area chart) trended down this morning.

Those who are looking at options plays on oil and gas are likely to see long positions facing an uphill battle against time decay in the current highly speculative environment. As a result, spreads and short volatility plays should look more attractive as alternatives.

Thursday, August 21, 2008

Headwinds Index Turns Up

Unless you are Usain Bolt, you are not likely to be in top form – not to mention setting world records – running into a headwind. For that reason, last month I developed something I call the Headwinds Index to calibrate the extent to which oil prices and concerns about financial institutions are providing a drag on stock prices.

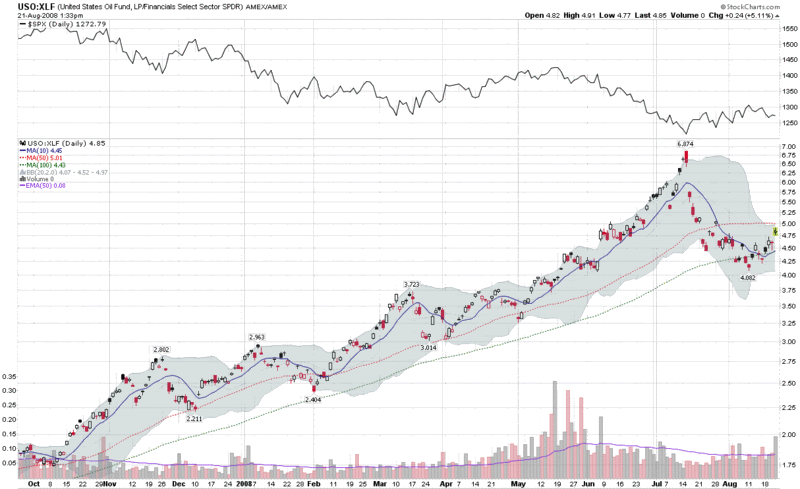
In keeping with my desire for simplicity wherever possible, the Headwinds Index is calculated as the price of crude oil divided by the financial sector ETF (XLF). For various reasons, I used the USO crude oil ETF instead of the crude oil front month futures.

The resulting ratio chart, which I have enhanced from the previous iteration presented in Headwinds Index: How Long Can Financials Outperform Energy? now includes a 100 day simple moving average for the USO:XLF ratio and a 50 day SMA for the SPX mini-graph at the top. [I have also inverted the ratio to better align with the headwinds metaphor.] Note that the 100 day SMA served as support for the Headwinds Index last week and the current level is at the 50 day SMA, which is a potential area of resistance. If this index breaks above 5.0, I would expect to see a rush to re-implement many of those long oil and short financials momentum trades.

Finally, note that an upturn in the Headwinds Index has preceded a turnaround in a rising SPX on a number of occasions. Keep an eye on this divergence going forward, as I do not expect to see a sustained rally in the S&P 500 until financials are able to outperform energy on a relative basis.

Monday, August 18, 2008

The ETF Energy Troika

The ETF revolution is making it much easier than ever before to draw comparisons across related groups of stocks and commodities.

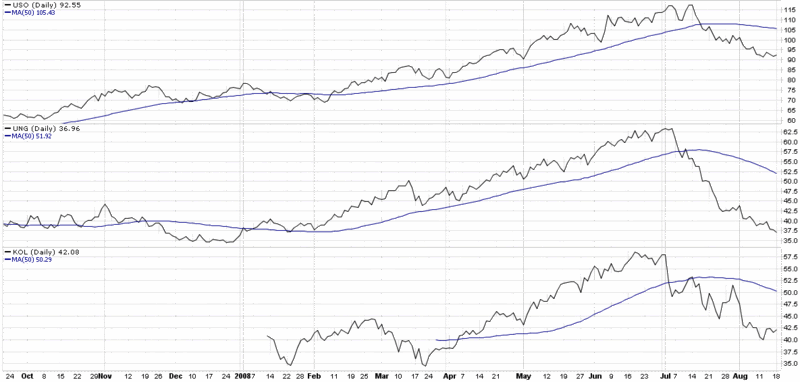
In the past, it has been easy to compare and contrast the price action in crude oil and natural gas. With the advent of a coal ETF (KOL), now it is easy to lump coal into the same comparison.

The chart below shows the crude oil (USO) and natural gas (UNG) commodity ETF as well as the recently launched coal ETF, which is based on a basket of coal stocks (top holdings are BTU, CNX, and ACI). This comparison may have an element of apples to pears about it, but the correlation across energy sources is unmistakable. Note that all three ETFs peaked at the beginning of July and have fallen sharply for the last month and a half. KOL seems to be the best candidate to find a bottom first, with USO showing some signs of flattening out and UNG still heading lower. KOL was the first of the three ETFs to top in June and July; could it be the first to signal a bottoming energy market in August?

Tuesday, August 12, 2008

Crude Oil Volatility Slides with Crude Prices

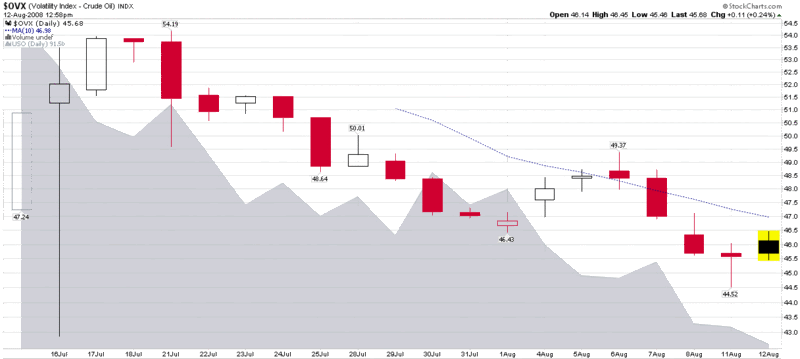
Based on the large number of Google searches that have recently been landing on the blog, there is considerable interest in the CBOE’s new “Oil VIX” or crude oil volatility index (ticker OVX), which was launched exactly four weeks ago today.

While it is still too early to pluck much in the way of useful conclusions from the OVX, I have included a chart of the new volatility index below. So far what may surprise most newcomers to crude oil volatility is that the OVX has fallen in concert with crude oil prices (as measured by the USO crude oil ETF). My analysis of USO options suggests that crude oil implied volatility and the price of the underlying are likely to be largely uncorrelated going forward, which is in sharp contrast to the strong negative correlation between equities and their corresponding volatility indices, such as the VIX, the VXN, and the RVX.

Wednesday, July 23, 2008

Headwinds Index: How Long Can Financials Outperform Energy?

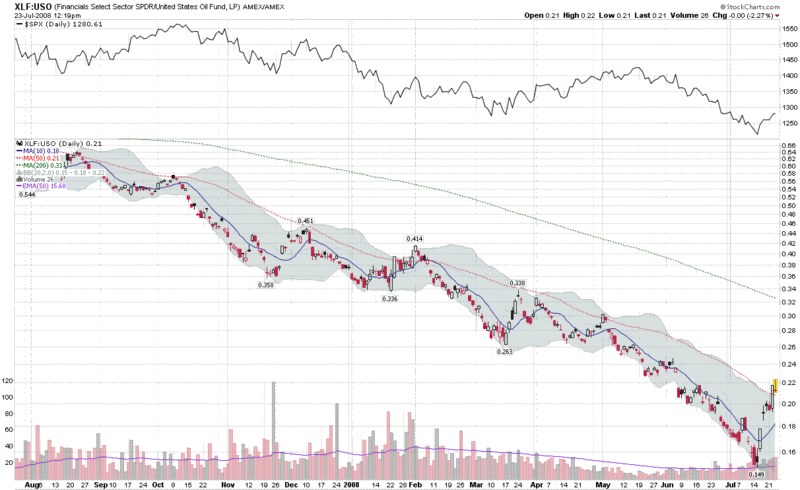
Two weeks ago, I introduced something I called the headwinds index, a simple ratio of financials (XLF) to oil (USO). It took another week for that index to bottom and the markets to rally, but since that bottom, financials have jumped 37% while crude oil has fallen 14% from its peak. The headwinds have turned into a strong tailwind, at least for the past six days.

The question, of course, is how long financials can continue to gain ground before a new long oil, short financials trade becomes too attractive to pass up. Several of my indicators suggest that the tailwinds are about to dissipate in the next day or two; after a strong opening, today’s developing gravestone doji also calls into question the staying power of the recent trend reversal.

At a minimum, I suspect the new tailwinds have gotten ahead of themselves. When they start to move back in the wrong direction, there is little reason to remain in the long financials, short oil trade past its useful life. As sailors are fond of saying, “tack on a header!”

Tuesday, July 22, 2008

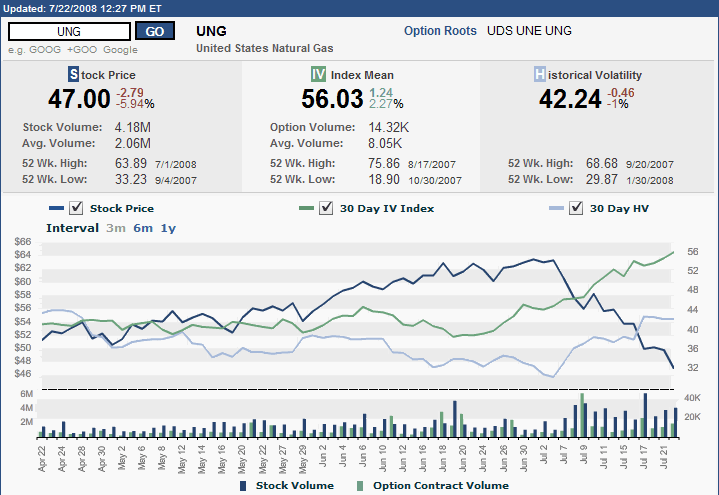
Natural Gas Implied Volatility Spiking

Perhaps it is just a coincidence that the “Oil VIX” appeared on the scene just as the implied volatility in oil futures (or at least as captured by USO) was hitting an eight month high. The “Oil VIX” (formally known as the CBOE Crude Oil Volatility Index; ticker OVX) and crude oil may get the lion’s share of the energy headlines, but lately it has been natural gas that has been making the more dramatic moves.

A look at the three month chart of UNG (the natural gas ETF that is the counterpart to USO), courtesy of the ISE, shows implied volatility steadily increasing over the past five weeks, with the gap between implied volatility and historical volatility continuing to widen – all while natural gas has pulled back about 27%.

Natural gas implied volatility levels are higher than oil implied volatility levels at the moment, and the pullback in natural gas presents some interesting trading opportunities. Some momentum players are already short here and some value hunters are buying on weakness, particularly if they believe in the long-term commodity bull and other supply and demand issues that are specific to natural gas.

The case for natural gas trading sideways from current levels is hard to make. Directional bets are expensive, due to high IV. Two trades I am looking hard at, with a bullish directional bias, are bull put spreads and call backspreads. The former limits upside and downside; the latter is more aggressive and more risky.

Tuesday, July 15, 2008

CBOE Launches "Oil VIX" (OVX)

Today the CBOE launched an "Oil VIX" (OVX) based on options on the USO crude oil ETF.

According to the CBOE press release, the exchange is in the process of expanding their volatility index product line into commodities and foreign currencies.

I think this is an exciting development that just happens to fit nicely with several chapters in my upcoming book.

I'll have a lot more to say about the OVX and other CBOE volatility products going forward.

Tuesday, July 8, 2008

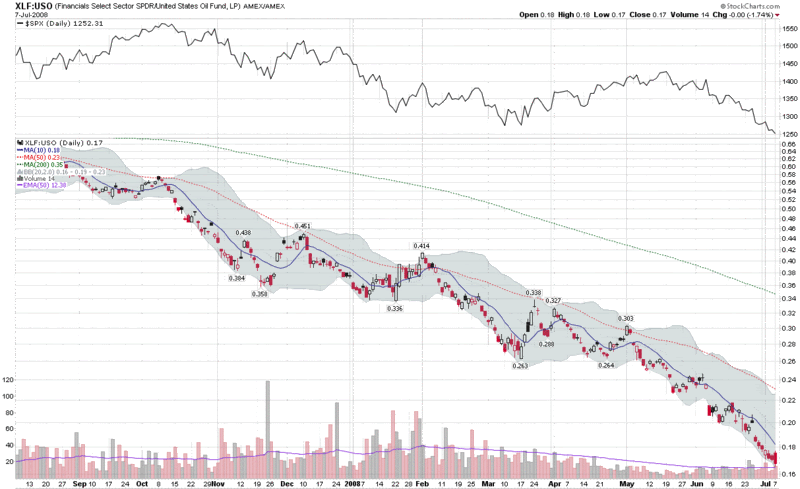
Headwinds Index: Financials (XLF) vs. Oil (USO)

Two numbers have been moving consistently in the wrong direction for the US economy during the past few months: oil prices and bank loan portfolio quality.

The chart below, which reflects a ratio of the valuation of financials (XLF) to crude oil prices (per the USO ETF), neatly captures the recent double threat posed by trends in these two sectors.

You can make an excellent argument that a bottom will not be in until at least one of the two trends, probably both, have reversed. My thinking is that the XLF:USO ratio chart is an excellent tool to monitor those two trends and pinpoint the turnaround. At the very least, I consider the XLF:USO ratio to be a reasonable proxy for two of the major headwinds that the markets are grappling with.

DISCLAIMER: "VIX®" is a trademark of Chicago Board Options Exchange, Incorporated. Chicago Board Options Exchange, Incorporated is not affiliated with this website or this website's owner's or operators. CBOE assumes no responsibility for the accuracy or completeness or any other aspect of any content posted on this website by its operator or any third party. All content on this site is provided for informational and entertainment purposes only and is not intended as advice to buy or sell any securities. Stocks are difficult to trade; options are even harder. When it comes to VIX derivatives, don't fall into the trap of thinking that just because you can ride a horse, you can ride an alligator. Please do your own homework and accept full responsibility for any investment decisions you make. No content on this site can be used for commercial purposes without the prior written permission of the author. Copyright © 2007-2023 Bill Luby. All rights reserved.
 
Web Analytics