Showing posts with label UNG. Show all posts

Monday, March 28, 2022

Point Hedges ETP Performance During Invasion of Ukraine

On Friday in Flight-to-Safety ETP Performance During Invasion of Ukraine, I reviewed the performance of some of the traditional flight-to-safety ETPs (Treasuries, gold, currencies and volatility) that are often used to hedge an equity-centric portfolio. 

Evaluating the performance of these ETPs since Russia invaded Ukraine a little over a month ago, I found some rather lackluster numbers.  As a group, these products have not even broken even since the invasion of Ukraine.

This time around, I have elected to look at the performance of some less traditional ETPs, including some much more targeted products that I have referred to in the past as “point hedges.”  Specifically, I looked at areas where exports from Russia and Ukraine are a significant portion of the global export market and whose disruption could have a significant impact on the global balance of supply and demand.  As it turns out, these commodities were easy to identify and the price dislocations have generally dwarfed the appreciation one might have been able to realize with more traditional hedges.

These products include: 
USO: West Texas Intermediate Crude Oil (solid red line)
UNG: Natural Gas (dark purple line)
DBB: Base Metals (light green line)
DBA: Agriculture (violet line)
WEAT: Wheat (light blue line
CORN: Corn (black line)
ITA: Aerospace & Defense (medium blue/green line)

[Note that nickel (JJN) should be on this list, but in part due to some chaos and mismanagement at the London Metal Exchange, JJN prices jumped have had multiple spikes of more than 100% and dwarf the performance of other ETPs in this graphic.  Additionally, for the international crude oil market, Brent crude oil (BNO) is typically a better measure than USO, but since the  Russian invasion of Ukraine, the two ETPs have only differed in performance by about 2%.]

It is easy to play Monday morning quarterback and say that with hindsight it is easy to pick the winners, but anyone who studied Ukraine’s biggest contributions to the global export market could have deduced that a supply shortage in wheat and corn was likely and for Russia, natural gas, crude oil and nickel were three areas of high risk in terms of their strategic value to the West, with wheat and corn also part of the equation.  I threw in aerospace & defense as a general military hedge.

Unlike the inconsistent and largely negative performance of more traditional flight-to-safety ETPs since the Russian invasion, the point hedges above have all seen gains of at least 3% during this period – and if you remove aerospace & defense from the mix, all the gains are at least 6.8% or higher. 

This is not to say that more narrow point hedges will usually outperform the broader traditional hedges during periods of geopolitical turmoil, but rather to remind readers that instead of a more generic hedge, a targeted hedge or speculative trade often has the potential to deliver substantially greater returns, such as the median 13% returns from the group of ETPs above.

This also means, of course, that should there be progress in the talks between Russia and Ukraine that each of these point hedges is exposed to the potential of a significant decline in price.


[source(s):  StockCharts.com]

Further Reading:
Flight-to-Safety ETP Performance During Invasion of Ukraine
Safe Haven Options Shrinking?
Chart of the Week: Flight-to-Safety ETPs
Revisiting the Flight-to-Safety Trade
Chart of the Week: The Flight-to-Safety Trade
Why Not Point Hedges?
Cheating with Partial Hedges
Forces Acting on the VIX
A Conceptual Framework for Volatility Events

While it has not been updated in a while, new readers may also enjoy older posts that have been tagged with the Hall of Fame label.

For those who may be interested, you can always follow me on Twitter at @VIXandMore

Disclosure(s): Net short VXX and long USO, DBB, DBA and ITA at time of writing

Tuesday, February 21, 2012

Credit Suisse Suspends Creation Units in TVIX: What It Means

After today’s regular trading session, Credit Suisse (CS) announced in a brief press release that it has “temporarily suspended further issuances of the VelocityShares Daily 2x VIX Short-Term ETNs (TVIX) due to internal limits on the size of the ETNs.” The company added that “[t]his suspension does not affect the Early Redemption rights of noteholders as described in the pricing supplement.  Other ETNs issued by Credit Suisse are not affected by this suspension.”

The announcement by Credit Suisse raises a lot of questions and I will see what I can do to answer some of the more pressing ones this evening.

While this is all speculation, based on the “internal limits on the size of the ETNs,” it sounds as if the recent exponential growth in TVIX has violated a position size risk control rule relative to the VIX futures products that comprise the S&P 500 VIX Short-Term Futures Index ER [excess return] on which TVIX is based. Of course we do not know how much the volatility of those VIX futures products is factored into the position size issue, but given the overhang of events in Europe, China and Iran, I can certainly make the case for a very conservative approach to risk control for any VIX futures exposure at the moment.

The suspension of creation units means that the 40,725,000 shares outstanding represents the upper limit for Credit Suisse. While Credit Suisse describes the action as temporary, there is no particular reason to believe the suspension will be a matter of days. It could possibly be weeks or longer before Credit Suisse agrees to issue new TVIX creation units. Back in 2009, for instance, the United States Natural Gas Fund (UNG) experienced regulatory approval issues for creation units and suspended new creation units for seven weeks. At one point in time, UNG traded as high as 16% over net asset value, but that premium turned out to be a temporary spike. Suspension of creation units, while unusual, does happen on occasion. Less than two weeks ago, to pick a recent example, Deutsche Bank (DB) halted creation units on seven of its commodity ETNs.

The big question for investors is whether the suspension of creation units will mean that TVIX trades at a premium or discount to its net asset value. Given that supply is constrained and demand is not, the most likely scenario is that TVIX will trade at least as high as net asset value or possibly at a premium. Valuation will be highly dependent upon arbitrage opportunities and there are quite a few arbitrage opportunities should TVIX begin to separate from its NAV. VIX futures provide an attractive source of arbitrage firepower, as does the very similar 2x VIX futures ETF, UVXY, formally known as the ProShares Ultra VIX Short-Term Futures ETF. Arbitrage opportunities are also available via VXX, VIX options as well as options on SPX/SPY, etc.

In terms of the reaction in the markets, we have some after-hours market data to give us an initial sense of the response to the TVIX announcement. TVIX closed the regular session at 17.01 and was last traded at 17.02 when the news crossed the wire and volume spiked. TVIX initially rose a little more than 1% to 17.26, gave back most of those gains, then rose again as high as 17.31 before finishing the after-hours session at 17.28, up 0.27 or 1.6% from the close.

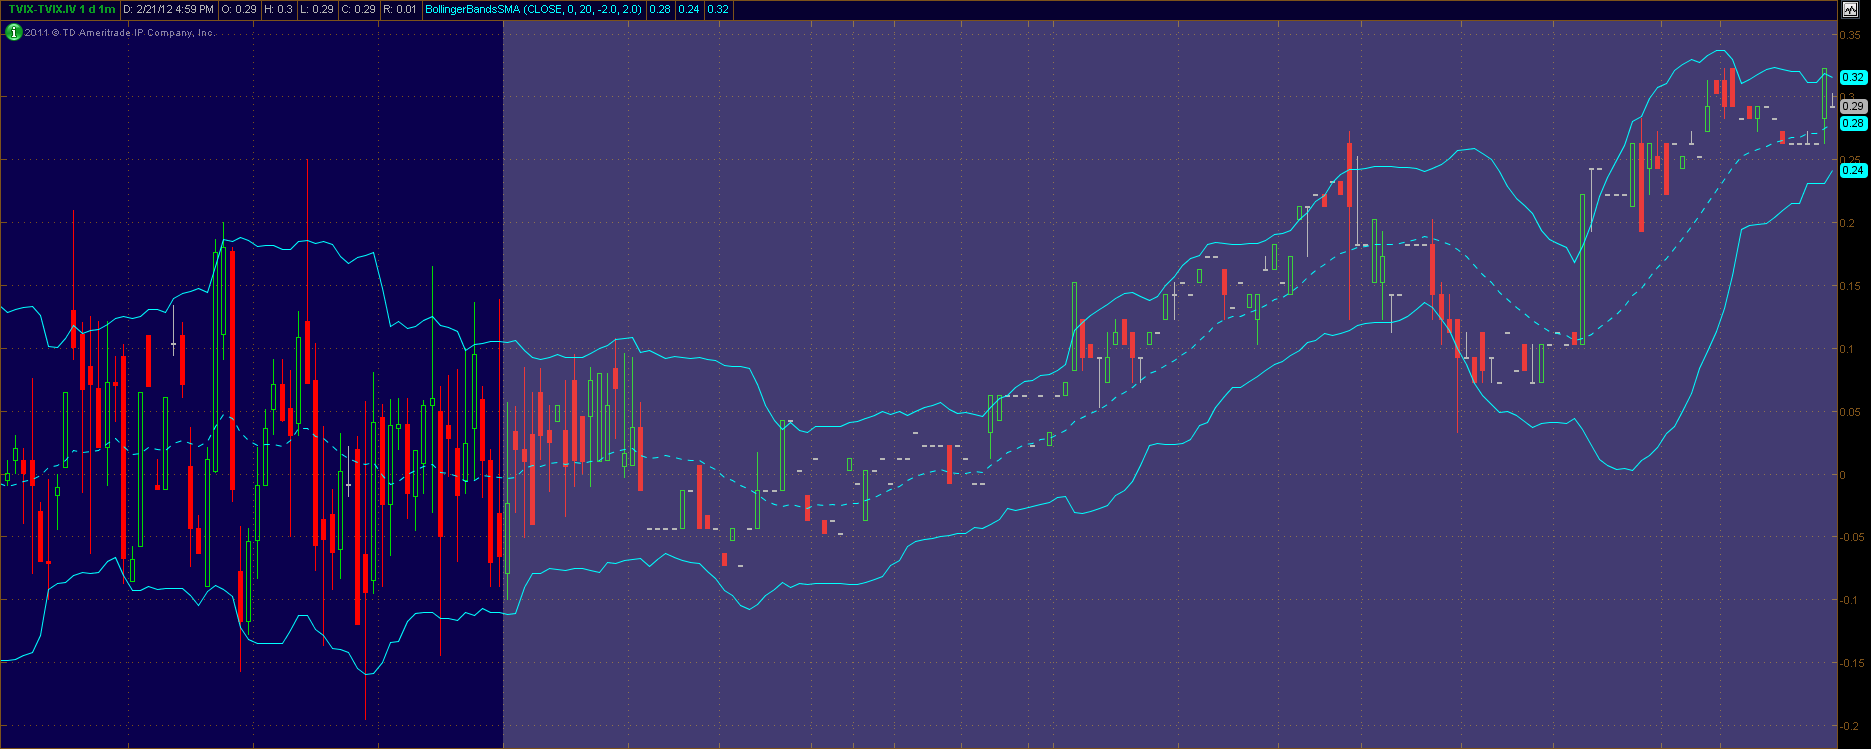
Traders should be aware that each ETP has an Intraday Indicative Value (IV or sometimes IIV), which is essentially a real-time estimate of an ETP’s fair value, based on the most recent prices of its underlying securities. These quotes are updated every 15 seconds and can help determine the extent to which a security has deviated from this measure of fair value. In the graphic below, I have captured the difference between TVIX and TVIX.IV during the last hour of the regular trading session and throughout the (grayed out) after-hours trading session, where TVIX rose to 0.29 above its intraday indicative value.

During tomorrow’s session, keep an eye on TVIX relative to TVIX.IV and also the ratio of TVIX to UVXY. At yesterday’s close, TVIX was trading at a multiple of 2.625 times that of UVXY.

In the short-term, I would expect a small premium to creep in to the price of TVIX, but arbitrage to keep that premium in check. Over the longer term, the price of TVIX will continue to respond to the Four Key Drivers of the Price of TVIX I outlined yesterday, in addition to any market dislocations caused by the suspension of creation units for TVIX.

Should the VIX futures market continue its recent growth trajectory and Credit Suisse ratchet down their relative exposure to that growing market, I would expect to see the resumption of creation units in TVIX in the relatively near future. The timing of this development is difficult to project, as there are quite a few things that can happen in the world of volatility between now and then.

Related posts:

[source(s): thinkorswim/TD Ameritrade]

Disclosure(s): short TVIX, VXX and UNG at time of writing

Thursday, February 2, 2012

Slaying the Natural Gas Contango Dragon

Yesterday’s post on Natural Gas, Contango and UNG appears to have generated a fair amount of interest across a broad base of readers, so for an encore I have decided to forego the typical collection of dazzling Liszt miniatures and skip directly to more on the ways to benefit from the persistent contango and negative roll yield in natural gas.

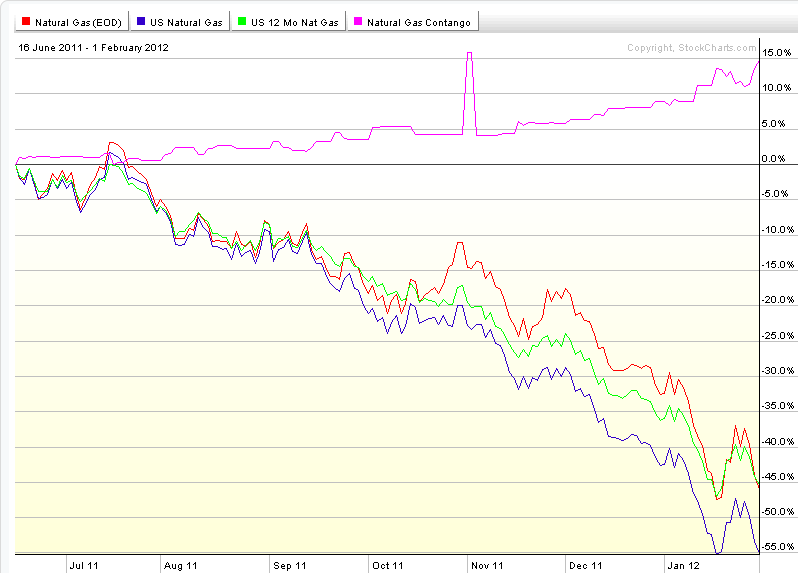
Starting with the graphic below, I have plotted the performance of natural gas (red line) and three natural gas ETPs since June 16, 2011:

  • United States Natural Gas Fund (UNG) – blue line
  • United States 12 Month Natural Gas Fund (UNL) – green line
  • UBS ETRACS Natural Gas Futures Contango ETN (GASZ) – pink(ish) line

The reason the graph begins in June 2011 is that it marks the launch of GASZ; the other two ETPs have a much longer track record.

First, note that UNG does not attempt to minimize its exposure to contango. Like many other futures-based ETPs, its objective is to hold a one-month weighted average constant maturity in its portfolio and it does this by buying second month futures and selling front month futures. UNL, launched after UNG, was an attempt by the same issuer to minimize contango by holding twelve months of natural gas futures contracts on the assumption that contango is likely to be steepest at the front end of the futures curve and flatter in the more distant months. As the chart below shows, the recent performance differential between UNG and UNL has been minimal.

The UBS ETRACS product, GASZ, takes a completely different approach and is based on a natural gas futures spread index that shorts the front month and is long some of the more distant months. In other words, this ETP is specifically designed to take advantage of contango. According to UBS:

“The ISE Natural Gas Futures Spread™ Index, through a series of investments in natural gas sub-indices, effectively provides short exposure in front month natural gas futures contracts and long exposure in mid-term natural gas futures contracts. This is achieved by taking a 100% long position in the components of the ISE Short Front Month Natural Gas Futures™ Index, which provides short (or inverse) exposure to the ISE Long Front Month Natural Gas Futures™ Index and an aggregate 100% long position in the components of the ISE Twelfth Month Natural Gas Futures™ Index, ISE Thirteenth Month Natural Gas Futures™ Index and ISE Fourteenth Natural Gas Futures™ Index (33.33% per index), which provides long exposure to the mid-term Henry Hub Natural Gas Futures (NG) futures contracts. The index is rebalanced monthly before the Sub-Indices’ roll process to maintain the 1:1 ratio.”

For more information, check out the GASZ web site and prospectus.

The results, at least as seen in the chart below, show that the GASZ approach has some promise insofar as the last eight months are concerned. To be fair, GASZ is very thinly traded and has yet to inspire a broad group of investors, but here is an approach that is not likely to be correlated with any strategies investors are currently running and has been racking up profits in a sideways (at least for equities) market.

Of course investors can always short UNG, but I believe that in much the same manner that ZIV is undeservedly neglected as an inverse VIX futures contango play, so is GASZ overlooked for the same reasons. These are two ETPs with a lot of potential that deserve a broader audience.

Finally, as a side note, UNG announced late yesterday that it will undergo a reverse 1-4 split following the market close on February 21. Here is a product that is down more than 40% in each of the last three years and is already down more than 21% in 2012. Don’t be surprised if this is not the last reverse split.

Related posts:

[source(s): StockCharts.com]

Disclosure(s): long GASZ and ZIV, short UNG at time of writing

Wednesday, February 1, 2012

Natural Gas, Contango and UNG

I have talked at length in this space about the contango and negative roll yield issues that plague VXX. Periodically these discussions trigger a question from a reader about the impact of contango on some of the other ETPs.

Just to be clear, as far as ETPs are concerned, contango and backwardation issues are limited solely to those products which hold futures in their portfolio. The large majority of futures-based ETPs are in the commodity space, but in theory at least, any security for which there are futures could end up with a futures-based ETP. Fortunately, ETFdb keeps a handy list of these products at their Futures-Based ETF page.

The main reason why I talk so much about contango in the context of VIX-based ETPs is that the VIX products have a tendency to produce huge levels of negative roll yield (at a rate of 11% per month at the moment in the front two months of the VIX futures) relative to the other products.

Outside of the VIX product space, contango is probably most notorious in crude oil and natural gas – and the two most popular ETPs for these commodities, USO and UNG. Still, contango in these products is generally much smaller than it is with VXX, but right now contango is unusually high in UNG. While contango (front two months) in USO is only 0.4% right now, it is actually at 7.6% per month in UNG.

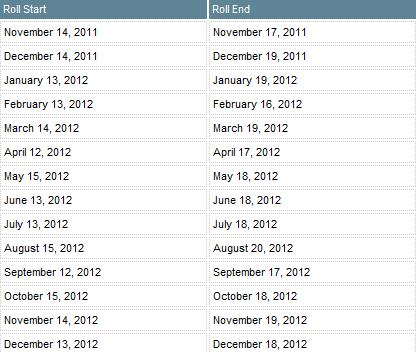
Note that unlike VXX, which has a daily roll, UNG rolls its entire portfolio over the course of four days per month. Better yet, UNG publishes a schedule of their roll dates, reprinted below, though it does come with the disclaimer, “Roll Dates are projected and subject to change without notice.”

So…while it has already been a great year for those who are short natural gas, it is possible that persistent contango will make short UNG positions even more profitable going forward.

Finally and perhaps most important of all, it is critical to keep in mind that steep contango does not happen willy nilly. Instead, contango is essentially a reflection of where the market expects prices to be headed (net of the cost of carry) in the future. Looked at in this context, UNG contango of 7.6% means that the reason shorts are receiving a 7.6% benefit from the negative roll yield is that the market anticipates prices will rebound 7-8% or so over the course of the next month. Contango and roll yield are not a free lunch by a long shot, but over the long term, if risk can be properly managed, positions that benefit from contango should be able to finance at least a few lunches.

Related posts:

[source(s): United States Natural Gas Fund]

Disclosure(s): short VXX and UNG at time of writing

Sunday, January 31, 2010

Chart of the Week: VXX Celebrates One Year of Futility

One year ago yesterday, the iPath S&P 500 VIX Short-Term Futures (1 month) ETN (VXX) was rolled out to little fanfare, with the exception of the widespread coverage that VXX and sibling VXZ received here when the ETNs were launched.

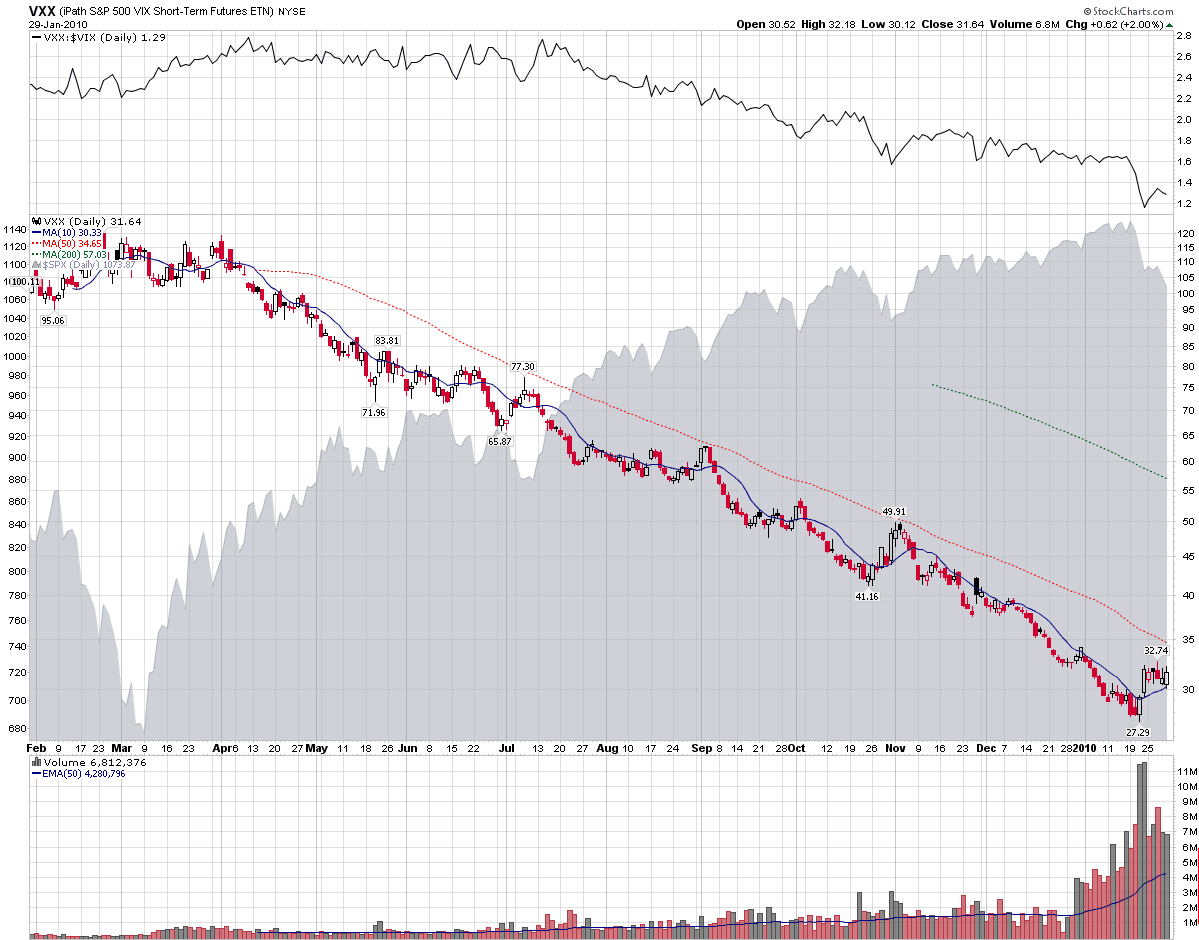
VXX opened at 100.11 that day, with the VIX at 42. 63. One year later, VXX is down 68.4% and the VIX is down 42.2%.

Setting aside leveraged ETFs, long positions in VXX were by far the best way to lose money in an ETF over the course of the last year. Putting the 68.4% loss in VXX in perspective, there were only two other ETFs in which investors could have lost 50% of their investment: short financials (SEF), which were down 52%; and short emerging markets (EUM), which fell 50%. Long natural gas (UNG) and short base metals (BOS) would both have resulted in losses of 48%.

This week’s chart of the week captures the VXX in all its futility, with a ratio of VXX to the VIX on top to see how VXX has underperformed the cash/spot volatility index throughout the past year.

The links below explain the manner in which negative roll yield and other factors have caused VXX to underperform the VIX and turn in such as disastrous performance. All things considered, I expect VXX to perform better relative to the VIX in its second year than it did in its first year, though admittedly this is not a very high bar to clear.

For more on how VXX is constructed and performs, readers are encouraged to check out:


[source: StockCharts]

Disclosures: short VXX at time of writing

Friday, July 31, 2009

Three Good Articles on the VIX

I continue to be amazed at the sustained level of interest in the VIX and other measures of investor anxiety and volatility, now that the VIX is down 72% from its high.

Today I was pleased to see three excellent articles on the VIX and VIX-related subjects. In no particular order:

Jared at Condor Options asks and answers a question on the minds of many as of late: Why Do VIX Futures Remain High? He shares some graphics from his excellent Volatility Tracker feature and offers a reminder that “the reason those VIX futures remain higher is that traders are willing to pay for November and December SPX options at a higher implied volatility – so any portfolio insurance purchased now will already have this information priced in.”

Bradley Kay at Morningstar takes up a related question in Is Volatility Cheap Yet? He discusses VIX futures and the VXX futures ETN at some length and offers a reminder that “these futures are also subject to the same dangers of contango that hurt similar rolling near-month futures investments in United States Oil (USO) and United States Natural Gas (UNG) earlier this year.” Kay concludes, in concert with my own thinking, that “until this contango starts to flatten and the spot VIX falls to levels more in line with historical norms, we do not think these ETNs provide an attractive long-term risk-reward trade-off.” I do think VXX can be traded effectively across relatively short-term time frames, but the contango roll risk or term structure decay should not be dismissed. I will do a deeper dive into this subject in the near future.

Last but not least, Adam at Daily Options Report (note the new web site) discusses the Credit Suisse Fear Barometer (CSFB) in About that CSFB Index and comes down in favor of a modification proposed by Ryan Renicker of New Edge Group. I need to put my hands on a full set of historical data before drawing any meaningful conclusions about the CSFB, but I like the logic and construction behind a fear-based index denominated in cost of collar data. From what I have seen of the CSFB charts, however, I will approach this one with a fair degree of skepticism.

Monday, August 18, 2008

The ETF Energy Troika

The ETF revolution is making it much easier than ever before to draw comparisons across related groups of stocks and commodities.

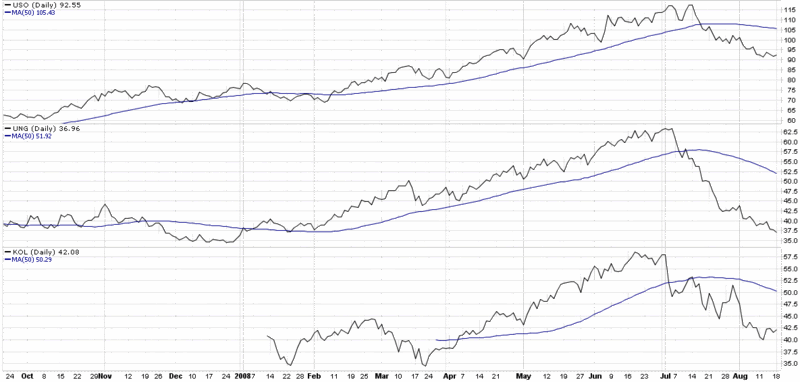
In the past, it has been easy to compare and contrast the price action in crude oil and natural gas. With the advent of a coal ETF (KOL), now it is easy to lump coal into the same comparison.

The chart below shows the crude oil (USO) and natural gas (UNG) commodity ETF as well as the recently launched coal ETF, which is based on a basket of coal stocks (top holdings are BTU, CNX, and ACI). This comparison may have an element of apples to pears about it, but the correlation across energy sources is unmistakable. Note that all three ETFs peaked at the beginning of July and have fallen sharply for the last month and a half. KOL seems to be the best candidate to find a bottom first, with USO showing some signs of flattening out and UNG still heading lower. KOL was the first of the three ETFs to top in June and July; could it be the first to signal a bottoming energy market in August?

Tuesday, July 22, 2008

Natural Gas Implied Volatility Spiking

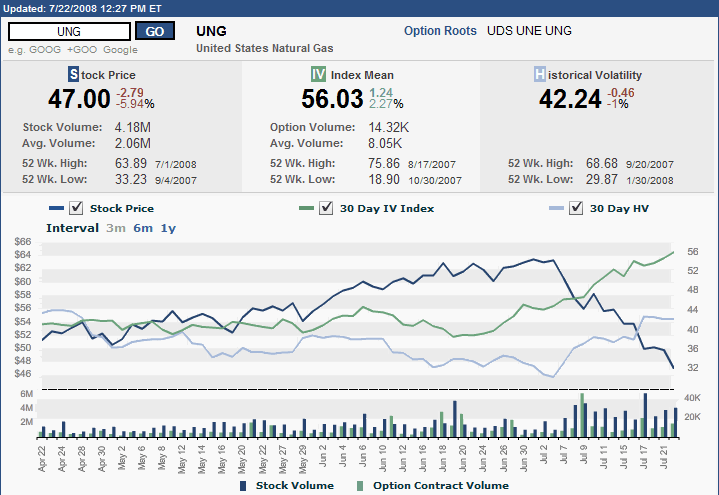
Perhaps it is just a coincidence that the “Oil VIX” appeared on the scene just as the implied volatility in oil futures (or at least as captured by USO) was hitting an eight month high. The “Oil VIX” (formally known as the CBOE Crude Oil Volatility Index; ticker OVX) and crude oil may get the lion’s share of the energy headlines, but lately it has been natural gas that has been making the more dramatic moves.

A look at the three month chart of UNG (the natural gas ETF that is the counterpart to USO), courtesy of the ISE, shows implied volatility steadily increasing over the past five weeks, with the gap between implied volatility and historical volatility continuing to widen – all while natural gas has pulled back about 27%.

Natural gas implied volatility levels are higher than oil implied volatility levels at the moment, and the pullback in natural gas presents some interesting trading opportunities. Some momentum players are already short here and some value hunters are buying on weakness, particularly if they believe in the long-term commodity bull and other supply and demand issues that are specific to natural gas.

The case for natural gas trading sideways from current levels is hard to make. Directional bets are expensive, due to high IV. Two trades I am looking hard at, with a bullish directional bias, are bull put spreads and call backspreads. The former limits upside and downside; the latter is more aggressive and more risky.

DISCLAIMER: "VIX®" is a trademark of Chicago Board Options Exchange, Incorporated. Chicago Board Options Exchange, Incorporated is not affiliated with this website or this website's owner's or operators. CBOE assumes no responsibility for the accuracy or completeness or any other aspect of any content posted on this website by its operator or any third party. All content on this site is provided for informational and entertainment purposes only and is not intended as advice to buy or sell any securities. Stocks are difficult to trade; options are even harder. When it comes to VIX derivatives, don't fall into the trap of thinking that just because you can ride a horse, you can ride an alligator. Please do your own homework and accept full responsibility for any investment decisions you make. No content on this site can be used for commercial purposes without the prior written permission of the author. Copyright © 2007-2023 Bill Luby. All rights reserved.
 
Web Analytics