Volatility Becomes Unhinged on Friday
Over the course of the last week, the VIX has risen 21.6% while the S&P 500 index has been essentially unchanged (-0.17%). During this period, the VIX has decoupled from the technical changes in stock prices and become more focused on event risk or event volatility associated with the latest act in the Greek tragicomedy spinoff of the European sovereign debt crisis.
If you are anything like me, you are constantly recalibrating your answer to the perplexing question of just how seriously we should take the possibility of a Greek default. Well, so are the markets. The added complexity is that everyone has to digest the simultaneously changing probabilities of certain events happening, the magnitude of the impact of those events, the potential reverberations over time – and periodically (seemingly daily, often at 3:58 p.m. ET) some important new events to consider.
If anyone has a probability tree diagram of just the Greek portion of the European sovereign debt crisis, I think it would be fascinating to look at these. I’d imagine it would be something like Johnny Appleseed meets Edward Scissorhands.
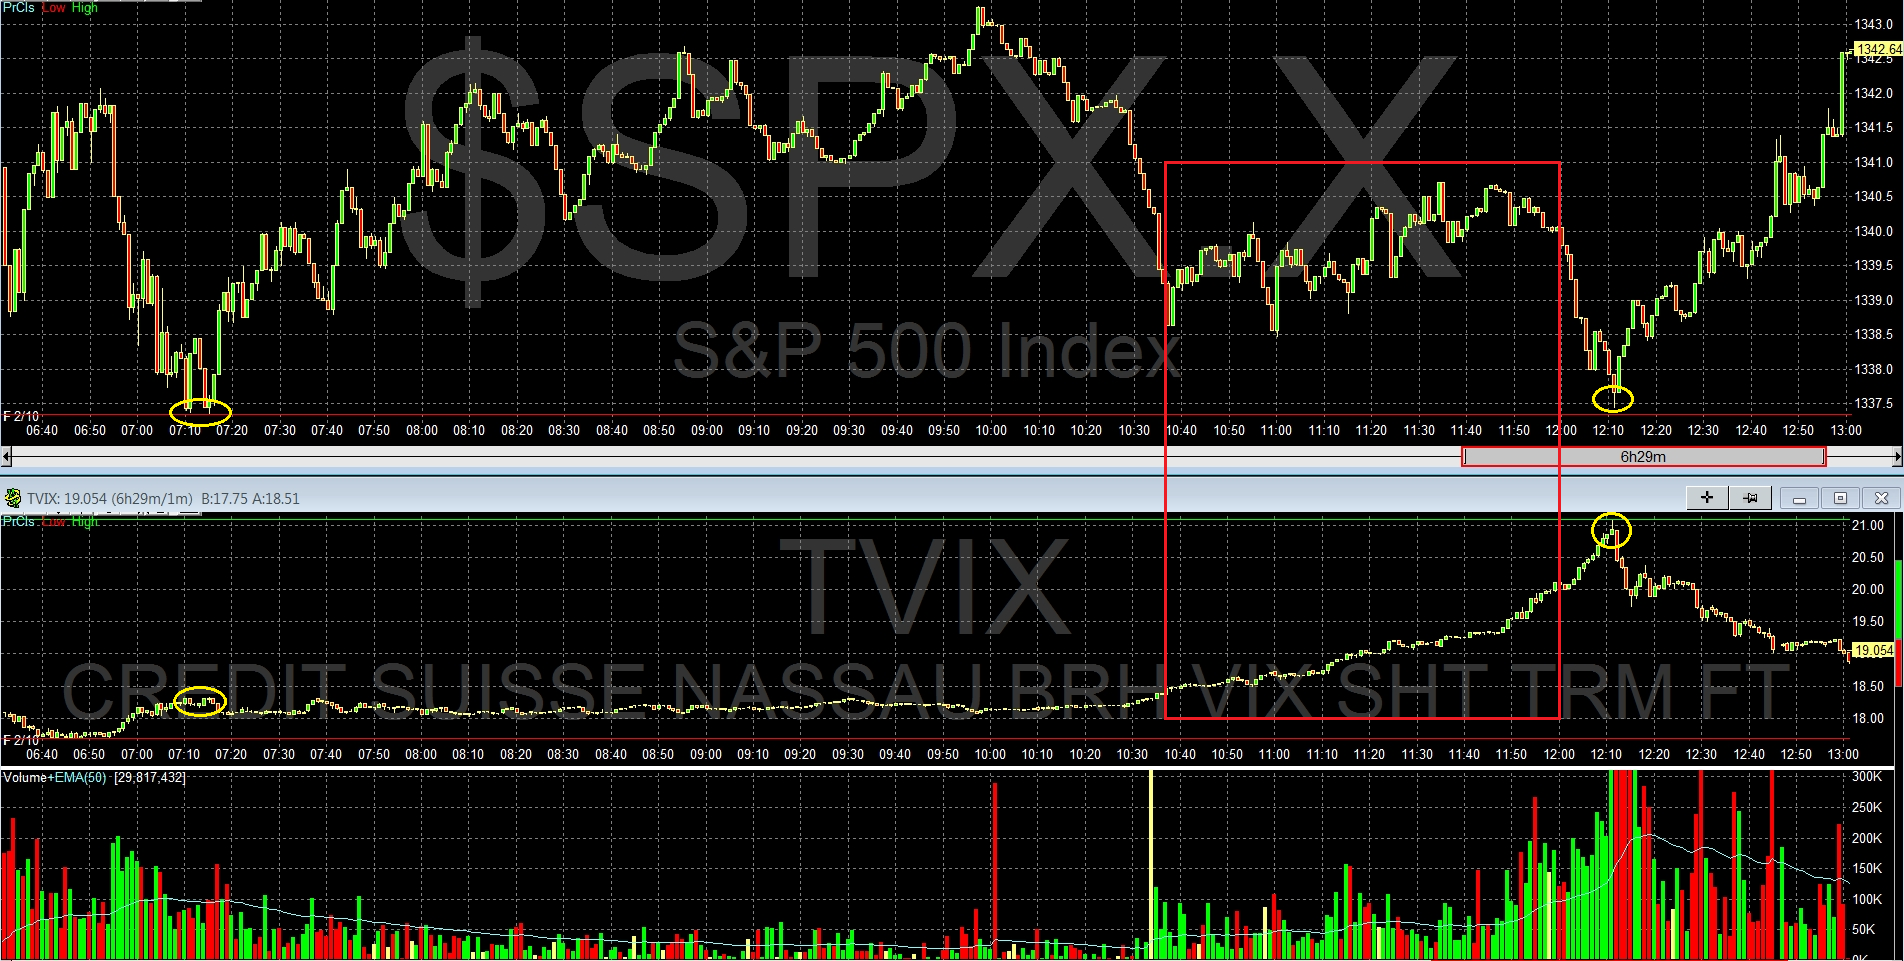
Getting back to the spiking VIX, the decoupling of the VIX and the SPX became quite notable during Friday’s trading session. In the graphic below, I have captured the full trading day of the SPX and TVIX (VelocityShares Daily 2x VIX Short-Term ETN), which is equivalent to a 2x version of the popular VXX (iPath S&P 500 VIX Short-Term Futures ETN). For the record, TVIX targets 2x the daily return of a portfolio that holds front month and second month VIX futures with a constant average weighted maturity of 30 days.
In the graphic below, I have drawn a large red rectangle around a period of approximately 83 minutes (10:36 a.m. – 11:59 a.m. PT) in which the SPX trended steadily higher, yet TVIX split with tradition and rose in dramatic fashion, logging a gain of 8.9% during the same time frame. For two securities that typically trade in opposite directions, this is a highly unusual decoupling. In fact, decoupling may be understating the change in the relationship, which became completely unhinged during the day. Note the yellow ovals that marked the two low points in the SPX some five hours apart. The SPX was unchanged over the course of these five hours, yet TVIX spiked 15.5% (!) during the same five hours. This is as big of an intraday deviation from the normal negative correlation that I can recall observing.

[source(s): QuoteTracker/TD Ameritrade]
Returning to the 21.6% weekly jump in the VIX while the SPX remained flat, this is not the first time the VIX has taken flight in such a dramatic fashion while the SPX was unchanged. In fact, it just so happens that a little more than three years ago the VIX gained 25% in a week in which the SPX eked out a 0.3% gain. That week was the week of September 15, 2008, when the Lehman Brothers filed for bankruptcy.
Related posts:
- The VIX, Lehman Brothers and Forecasting
- The LEHVIX
- Implications of a Positively Correlated VIX and SPX
- High Positive Correlation Between VIX and SPX Often Signals Market Weakness
- TVIX Finally Getting Its Due as Day Trading Rocket Fuel
- More Thoughts and Numbers on the SPX-VIX Correlation
- VXN:QID Ratio Reflects Unusual Complacency
- SPX-VIX Daily Correlation
- Performance Implications of VIX and SPX Divergences
- Availability Bias and Disaster Imprinting
- Data to Support Availability Bias and Disaster Imprinting Hypothesis
- Expectations, Surprises and Fear in 2011
- A Conceptual Framework for Volatility Events
Disclosure(s): short TVIX and VXX at time of writing

