Thursday, May 31, 2007

End of May Links

The most recent installment of the cornucopia of things that I have been reading and thinking about as of late:

Wednesday, May 30, 2007

Hedge Funds and Fuzzy Sentiment

Barry Ritholtz at The Big Picture does a nice job of summarizing two different points of view on the impact of hedge fund activity on market sentiment indicators, a category which includes the VIX, put to call ratios, and many of the other concepts I kick around here.

In his analysis, Ritholtz quotes John Bollinger in the Wall Street Journal as saying that when it comes to short interest, “Hedge fund activity has destroyed the usefulness of the numbers.” While I am inclined to agree with Bollinger with respect to short interest figures, I am not at all willing to take the extra step and offer a sweeping indictment of the VIX, put to call numbers, and other sentiment data. I am more than a little concerned about the increased role of hedge funds, ETFs and other factors that may call into question the value of making comparisons with historical data, but this is the reason that I often favor relative measures over absolute ones and ratios to stand-alone numbers.

Market sentiment data will never be perfect, but when used properly, even fuzzy sentiment data can be enough information to give you the edge you need in your trading.

BuyWrite Index as a Timing Tool?

Adam at Daily Options Report has recently been talking about the CBOE S&P 500 BuyWrite Index (BXM) and related products in considerable detail – enough for me to finally take a look at it myself. Between the information on the CBOE site linked above, Adam’s comments and the insights of ETF-friendly blogger ‘Random’ Roger Nusbaum, you can find out just about anything you might wish to know about the BXM and products that utilized covered call strategies. Well, almost anything.

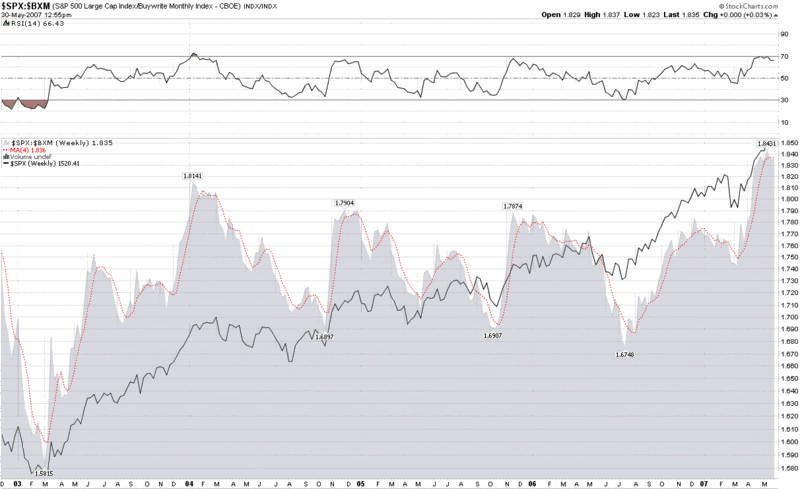
I got to wondering whether or not the BXM might be useful as a timing tool. After spending a little time at StockCharts.com, I put together several ratio charts that compare the SPX to the BXM. In a weekly ratio chart, appended below, I noted that for the last several years when the SPX to BXM ratio approaches 1.80 (or generally makes any 6-12 month high) and rolls over, this has usually provided some advance warning of a significant correction in the SPX over the next two to three months. What particularly caught my attention in the current chart is very high 1.836 moving average reading that appears to be just beginning to roll over.

This ratio is something worth watching; and the BXM and related products (BEP, MCN, and the newly minted ETN, BWV) are another way to think about harvesting volatility in what could be turning into a toppy market.

Tuesday, May 29, 2007

More Thoughts on the PCVXO

Last week I talked a little about the PCVXO, which combines put to call ratios and volatility data in one sentiment indicator. In crunching numbers on the original PCVXO system and a number of variants, I have concluded that the PCVXO family can be an effective market timing device. For those who may be wondering whether they should invest some time and energy in an effort to better understand of the PCVXO, I can offer my encouragement, along with a couple of tidbits from my research.

In a previous post, I described some of the trading rules advocated by Jay Kaeppel, the developer of the PCVXO. Kaeppel recommends initiating positions when the PCVXO re-crosses the 110 and 90 levels, in order to catch the remaining portion of the mean-reverting move. While various backtesting methods indicate that this does produce good results for both long and short positions, it is possible to miss a large portion of the mean-reverting move if the PCVXO happens to spike above 120 or even 130, as was the case with some PCVXO family systems following the February 27th spike in volatility. For this reason, I recommend timing entries to coincide with the first drop or second consecutive drop in the PCVXO once it crosses the 110 threshold. This approach will result in an earlier entry and a better chance of catching a larger portion of the big mean-reversion waves. A similar strategy is also effective below the 90 level, but because extreme low readings in the PCVXO tend to be much milder than extreme high readings, the incremental gains from this strategy are much smaller.

One particularly interesting aspect of PCVXO calculations is that it gives me an opportunity to evaluate what happens when the put to call and volatility data diverge. In a nutshell, my findings are that high readings of volatility relative to put to call data are generally bullish for the broad markets while high readings of put to call data relative to volatility are generally bearish for the broad markets. This is not what I would have expected, which makes the data even more interesting…and raises quite a few additional questions.

Finally, in light of the above, it seems worth noting that there was a significant divergence in the put to call and volatility data as recently as last week. Given that it was low put to call numbers that contributed to the divergence, this should be a bullish sign for the markets.

Monday, May 28, 2007

Portfolio A1 Holds Steady as RKT Loses Altitude

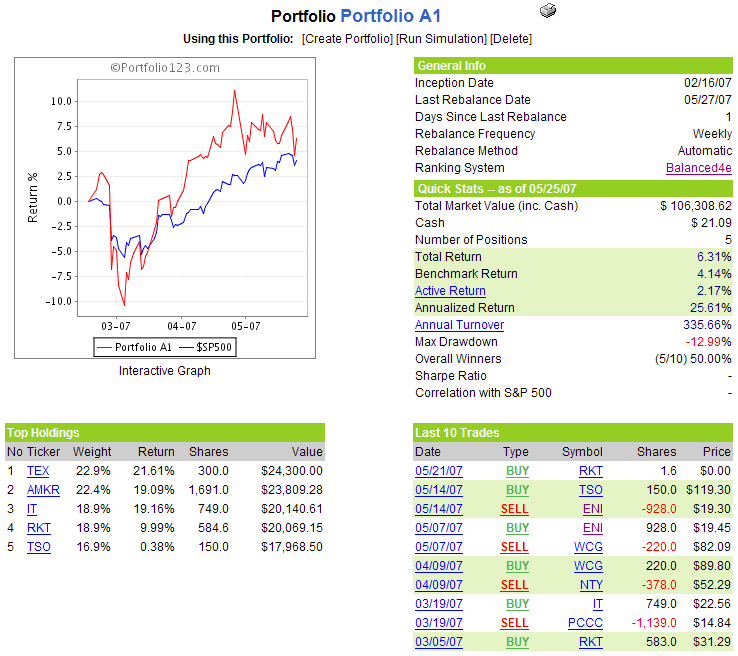
For the second week in a row, at least one Portfolio A1 holding fell 10% during the week. Last week it was Tesoro (TSO), which continued to recover this week; the most recent victim is Rock-Tenn (RKT), whose fall was offset almost imperceptibly by a $0.10 dividend paid out on 5/21. While RKT has been a strong performer since being added to the portfolio during the first week in March, the recent weakness makes this holding vulnerable to being dropped in the coming weeks.

In spite of RKT’s difficult week, Portfolio A1 has increased its performance advantage over the benchmark S&P 500 to 2.2%.

There are no changes to the portfolio for the coming week.

A snapshot of the portfolio is as follows:

Saturday, May 26, 2007

What Volatility? VWSI Back at Zero

Wednesday at Thursday may have felt like a fairly dramatic change in direction for the markets, but for the fourth week out of the last five, the VIX Weekly Sentiment Indicator (VWSI) sits at an even zero. While the VIX closed the week at 13.34, up 0.58 from the previous week, the VIX is sitting almost directly on top of its 10, 20 and 50 day simple moving averages, which are currently showing readings of 13.49, 13.38, and 13.32, respectively.

The recent high correlation between the SPX and the VIX may suggest that historical precedent is siding with a larger correction in the equity markets, but I am not placing any volatility-related bets at this time.

Sometimes it is better just to watch and wait for better opportunities.

(Note that in the above temperature gauge, the "bullish" and "bearish" labels apply to the VIX, not to the broader markets, which are usually negatively correlated with the VIX.)

Wine pairing: For an inexpensive Rhone blend recommendation, check out: Robert Hall’s Rhone de Robles and Tablas Creek’s Cote de Tablas Blanc; the contrarian favorite from Spain, Wrongo Dongo; Oakley Five Reds; and The Stump Jump from Australia. If you are looking for additional ideas, you might want to check with the Rhone Rangers.

Friday, May 25, 2007

PCVXO: Combining Put to Call Ratios and Volatility Data

I talk a lot about put to call ratios and the VIX in this space, but I almost always talk about them as separate indicators and haven’t spent much time dedicated to discussing when to give one precedence over the other, what to do when the two indicators disagree, etc.
As luck would have it, Jay Kaeppel, who is the author of several books on options and a frequent contributor to Optionetics.com, has already written about one such model, which he calls the PCVXO. The name refers to the fact that the PCVXO combines a put to call ratio and the VXO. Essentially, the PCVXO boils down to an average of the ratios of the 10 day simple moving average to the 65 day simple moving average for both the put to call and VXO. The full details of the PCVXO calculations and buy/sell rules are available in Kaeppel's “Can We Bounce Yet: Part II.” You can also try a full search on “PCVXO” at Optionetics.com to get more information.

Like its components, the PCVXO is a contrary sentiment indicator, so it generates buy recommendations when a combination of relatively high put activity and increases in volatility signal excessive bearishness and fear. Likewise, when relative put activity and volatility are in a downtrend and suggest that greed and complacency are figuring prominently into the markets, the PCVXO is most likely to generate sell signals.

Kaeppel says that he uses the total put to call ratio and the VXO because there is a much larger quantity of historical data for these measures than for some of the alternatives. Of course, there are many possible permutations and combinations for indicators that are similar to the PCVXO. I generally prefer the ISEE and the equity put to call ratio to the total put to call ratio (or the index put to call ratio.) I also favor the VIX over the VXO, but believe that the VXN, RVX and VXD are all worth evaluating in the context of a combined sentiment indicator. Finally, there are an almost infinite number of simple and exponential moving averages to consider, but four of my favorite for sentiment data are the 5, 10, 20 and 50 day SMAs. With 4 put to call ratios, 5 volatility measures and 6 moving averages (that’s four factorial for those scoring at home), that means 120 ‘off the shelf’ combined put to call and volatility indicators.

I have been crunching numbers on quite a few of these PCVXO analogs and will have some more to say about this indicator next week.

Thursday, May 24, 2007

A Global Indicator to Watch

One of the best features of StockCharts.com is that it allows you to keep track of ratios for just about any security you can think of. With the continued expansion of the reach of ETFs (monitored by Tom Lydon at ETFtrends.com, among others), the possibilities are growing rapidly, limited more by the lack of historical data for newly minted ETFs than anything else.

With all the talk of a Chinese bubble, there is no better time than the present to have one or more good global sentiment indicators so you can get a handle on whether you should be worried about the extent of speculative activity in Mexico, Malaysia, Brazil and perhaps China or whether you might be better off following the trends.

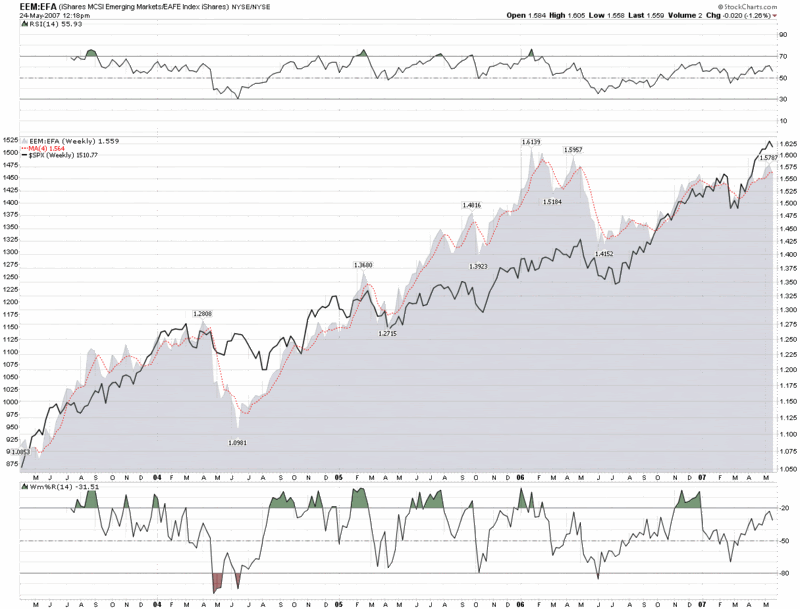
One ratio I have been looking at is that of emerging markets to developed markets. Two highly liquid ETFs that track these markets nicely are the iShares MSCI Emerging Markets Index (EEM) and the iShares MSCI EAFE Index Fund (EFA), where EAFE refers to Europe, Australasia and the Far East. Each ETF is capitalization-weighted and you can get a sense of the differences in their holdings by looking at the iShares complete holdings list for EEM and EFA.

Since EEM first traded in April 2003 and EFA goes back to August 2001, our ratio chart is able to provide four years of combined data, which is a long time in ETF years.

In the chart below, the relative spikes in emerging markets generally provide an indication when speculative activity is getting out of hand and often provide advance warning for an upcoming drop in the SPX. I will leave it to readers to determine whether or not the extent of the correlation is worth tracking going forward. I am certainly going to keep an eye on it.

Wednesday, May 23, 2007

CNBC Loser’s Bracket:: #1056 (Top 1%)

For those who may be interested, the CNBC Million Dollar Portfolio Challenge is winding down this week, with 20 top performers duking it out for $1 million paid out over many years through an IV drip, while the Second Chance Showdown contestants get another shot at glory in the loser’s bracket – with a Sony home entertainment system as a consolation prize to the winner.

I never had a chance to properly chronicle the true extent of my rise and fall in the first round of this contest, as CNBC wiped away the details before I do a proper post-mortem. All I know is that after peaking at the top 0.08%, I fell down to about the top 11%, finally finishing something like 200,000th, perhaps even lower.

The good news is that the contest gave me an opportunity to test some ideas about how to find stock that were about to make a significant move. Since the end of the contest fell in the middle of earnings season, I focused on companies that were due to report in the next 24 hours and published the details of my formula and some associated free public information sources in “How to Find the Spiker Before the Earnings Announcement” on May 9th. Recently, I went back and evaluated the 16 companies that I invested in as a result of that earnings spiker formula and discovered that the minimum next day move for those companies was 1.5%, while the maximum move was 30.2% (down in this case), with a mean move of 5.6% and a median move of 3.7% – all of which is based on a one day holding period.

Armed with this information, I thought I should put the same formula to work again in the loser’s bracket. Once again it has been successful, with my last four picks being a 3.0% gain in PETM, a 7.7% gain in FMCN, a 5.3% gain in TSL, and a 3.0% gain in SNDA. The bottom line is that this performance has put me in the top 1% of the current contest at #1056.

Before I start patting myself on the back, however, it looks like I may have shot myself in the foot. Shanghai-based Shanda Entertainment was a solid earnings pick and turned in a very strong quarter, but it appears I was foiled by my own Lost in Translation moment and accidentally sold prior to earnings. To make matters worse, I jumped from the Shanda rocked onto GameStop (GME), whose doubling of revenues was offset by lukewarm guidance. I got my volatility again, but GME is currently trading down 3.6% on the day.

Tuesday, May 22, 2007

High Positive Correlation Between VIX and SPX Often Signals Market Weakness

For the benefit of those who may not have been following this story, I will backtrack a little before diving in.


I first talked about the implications of a positive correlation between the SPX and VIX back on April 26th in “Divergence, History and Tells,” when I noticed a change in the recent pattern of SPX and VIX correlations. In a follow-up post on May 4th, “Predictive Value of SPX and VIX Correlation: First Pass,” I offered a preliminary conclusion:
“The bottom line is that a highly correlated SPX and VIX does not bode well for the SPX across all the time frames I have been looking at, which start at three days and go out as far as three months.”
Since the second article, I have been crunching numbers and playing around with various correlation metrics and have concluded that the period of high SPX-VIX correlation was focused primarily from April 25th to May 10th and reflected some high readings not seen since 1998. One noteworthy aspect of the recent period of high correlation was its relatively long duration, again something that has not been observed in some of the correlation metrics since March and April of 1998.

Even though today is setting up to be a rare instance of back to back sessions of positively correlated SPX and VIX readings, the big correlation spike now appears to be in the rear view mirror, at least from a statistical perspective.

In looking at past periods of high positive correlations between the SPX and the VIX, it is notable that the SPX generally performs well below its historical mean for up to three months following the high positive correlation period. I also find it particularly interesting that a period of significant underperformance is often associated with 20 trading days following the peak readings. If you consider April 25th to be the first day of these peak readings, then knowing that tomorrow is day #20 should at least give you some fodder for contemplation.

In sum, always be careful with any trading strategy that assumes a freight train is about to make a U-turn…but understand that it never hurts to be fully prepared for the possibility.

Monday, May 21, 2007

Larry McMillan on a Positively Correlated VIX and SPX

Thanks to the CFE’s Futures in Volatility newsletter, I have a fairly good idea what Larry McMillan is thinking about vis-à-vis a positively correlated VIX and SPX. The May 21, 2007 issue of Futures in Volatility just arrived in my mailbox a few minutes ago and in it McMillan makes the following observations:

“The last few weeks have seen a slow but steady rise in VIX (and in most VIX futures), even though the broad market, as measured by the S&P 500 Index, is rising in price. This is not a phenomenon that is seen too often, but it is not completely unprecedented. Occasionally, one sees a day or two in which VIX rises while the broad market rises, but it is much more unusual to see a trend of that sort. The current trend has lasted one month, but back in the 1990s, there were periods when VIX rose for months while the S&P 500 Index rose as well. If one recalls, VIX was near 10 in late 1994. But during the bull market of the 1990s, VIX rose to the point where it was routinely between 25 and 30 in 1998 and 1999. Yet, during that time, the S&P 500 Index also rose quite strongly, as those were the banner years of that bull market.


In the last month, futures prices have reacted accordingly, although their pricing curve is in a state that has not yet been seen in the 3-year history of VIX futures trading. Most of the VIX futures, Variance futures, and VIX options have followed VIX higher in the last month. VIX products have increased in price much across the board: November 2007 and February 2008 VIX futures are now slightly above 15. Even the August 2007 VIX futures are nearly 15. Does this mean that volatility traders are looking for higher volatility later this year? It certainly seems that way. What is a bit unusual is that there is not really much of a spread between the longer-term contracts…Looking back over the history of VIX futures trading, there are only two other occurrences of similar tightly-packed groupings of VIX futures prices. Those occurred in April and May 2005, and June and July 2006, both of which were times when the market had just fallen and was beginning to rally, so the futures were transitioning between “bearish” and “bullish” shapes. That is not the case now. This is the first time we have seen this construct while the market is rallying. In all likelihood, the futures are indicating that the market is going to become more volatile, regardless of the direction of the S&P 500 Index. It appears that traders expect volatility to be more in line with historical norms (the long-term historical volatility of the S&P 500 Index is approximately 15%).”

McMillan’s remarks dovetail nicely with my thinking in “VIX Futures: The One Picture to Remember” (see the comments, in particular.) Still, I am not yet prepared to make a call on the likelihood of increasing volatility or the direction of the SPX. As far as I’m concerned, the record highs and continued upside momentum in the SPX outweigh any signs of technical weakness or a breakdown in investor sentiment. I will have more to add to my May 4thPredictive Value of SPX and VIX Correlation: First Pass” post in the near future. This time around I will offer only two words of advice: trailing stops.

Sunday, May 20, 2007

Portfolio A1 Struggles Behind TEX and TSO

Portfolio A1 had a difficult week. New addition Tesoro (TSO) dropped 10% from Monday to Wednesday, following the refiners down, yet rallied impressively to end the week just barely in the red. The situation was worse at Terex (TEX), which was Portfolio A1’s largest holding coming into the week. Terex struggled throughout the week and finished 8.5% off of Monday’s high. As bad as that sounds, the heavy equipment manufacturer is still flat for the past month and up 84% over the past year.

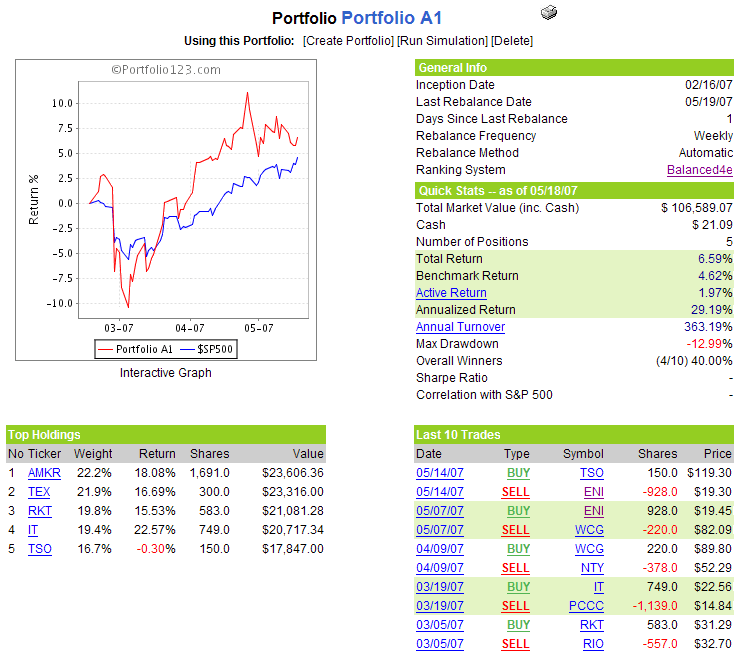
The week’s lackluster performance dropped Portfolio A1’s cushion over the benchmark S&P 500 to 2%, down from the 4.5% advantage as of last week.

There are no changes to the portfolio for the coming week.

A snapshot of the portfolio is as follows:

VWSI Edges Up to +1

After three weeks of consecutive zero readings, the VIX Weekly Sentiment Indicator (VWSI) has moved off of dead center to +1. The VIX closed the week at 12.76, down 0.16 from the previous week, marking the sixth week in a row that the VIX has closed in the 12s.

While the VWSI is not going out on a limb to predict the direction of the next big move in the VIX, futures suggest that the consensus of opinion is that the VIX will be back over 15 in six months. Predicting the path it will take to get there, however, is another task entirely.

I am officially neutral on the VIX at the moment, with a watch and wait perspective. For what it is worth, I probably will not be opening any long positions in the VIX unless it dips below 12.00 in the coming week.

(Note that in the above temperature gauge, the "bullish" and "bearish" labels apply to the VIX, not to the broader markets, which are usually negatively correlated with the VIX.)

Wine pairing: In my previous roundup of California gewurztraminer, I suggested Navarro and Harvest Moon. For some of my top selections from Alsace, check out Trimbach; Hugel; and Domaine Weinbach. You can also check out the top-rated gewurztraminers in the 2007 San Francisco Chronicle Wine Competition.

Friday, May 18, 2007

VIX Futures: The One Picture to Remember

There are really only a handful of important things to remember about the VIX. I can summarize the most important ones as follows:

  • The VIX is generally negatively correlated with the SPX
  • The VIX is a mean-reverting animal
  • VIX options prices are calculated off of VIX futures

Now raise your hand if you follow the futures market. I thought so. Well, neither do I for the most part, but I’m quickly coming around to futures as a useful tool for getting a better handle on how investors are thinking about and betting on the future.

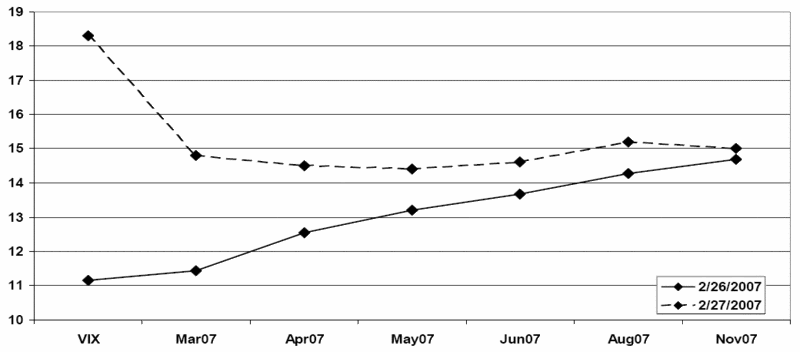
Rather than try to sound like some sort of evangelist, however, let me just offer one chart, which comes courtesy of the CFE. I will skip the commentary, other than to translate the obvious into some numbers: when the VIX jumped 64% from February 26th to February 27th, the nearest futures, the March ’07 VIX, moved less than half as much in percentage terms. Looking further out, the August ’07 VIX futures moved about one tenth of the VIX index, while the November ’07 VIX futures moved about one thirtieth as much as the VIX did.

Thursday, May 17, 2007

Bicoastal Trading…or Are You Trading in the Right Time Zone?

Last week I had a chance to trade on both coasts of the United States. Even though I grew up on the East Coast, I must say that I am more enamored with the manner in which the West Coast trading day fits into my life than the East Coast variant.

Assuming that you are trading NYSE hours of 9:30 to 4:00 ET, here the pros and cons of each time zone, at least as I see them.


East Coast / ET

Pros
  • Anything that happens overnight can be fully digested before the market opens the next morning
  • No need to bother to check with Asia or do any homework before you go to sleep
  • If desired, you can easily put in 3-4 hours of preparation time before the market opens
  • Working hours are closely correlated with those of your friends and family
Cons
  • If you have all that time after waking and before the market opens, there is a tendency to think you need to fill it up with research and analysis
  • After hours trading, West Coast earnings conference calls, and other end of day activities can easily screw up dinner plans
  • The market seems like it is open all day long
  • If you hope to trade in addition to another full-time job, there is too much time overlap for intra-day trading

West Coast / PT

Pros
  • The market closes at 1:00 p.m., so if you manage your time (and investments) well, you can have many of those afternoons off
  • After hours trading and earnings conference calls are a breeze – and still leave you with half of the afternoon free
  • Because of the lack of extended morning preparation time, there is a greater tendency to watch and wait during the first half hour the markets are open, rather then rush to open positions
  • A part-time trader can get at least 1-2 hours of live market action in before going to work
Cons
  • No sleeping in
  • If you have to commute anywhere, you are forced to become part night owl
  • Either you get up really early or (perhaps ‘and’) you must check on Asia and Europe each night before you go to sleep
  • There is no guarantee that you can absorb all the relevant information and formulate a solid trading plan in the time available before the markets open

The Solution?
Since I started trading full-time, I have often thought that the perfect time zone to trade in was Mountain time. Jackson Hole? Telluride? In theory, at least, this would provide a good balance between having the necessary morning preparation time and the opportunity to take the better part of the afternoon off after the markets are closed for skiing, hiking, mountain biking or whatever the local environment offers. Since I mentioned Jackson Hole, Wyoming has an extremely advantageous set of tax laws (save property taxes) too.

For now I’m staying in the San Francisco Bay Area, getting up early, and paying a 9+% state income tax. Every afternoon I have off, though, I thank my lucky stars and try to spend my geography dividend.

Wednesday, May 16, 2007

Pre-Expiration Links

OK, so links below are not really all about options expiration, but this is expiration week and it’s my blog, so…

From Futures to Pastures (an “and More” selection)

All this talk about futures must have conjured up Newton’s Third Law of Brainstorming: whenever I focus my thoughts on a particular future time period, the future simultaneously exerts a force on me with the same magnitude in the opposite direction.

The result is today’s chronological oddity in which I use this space to pull from my personal archives some of the computer hardware and software that still generate nostalgic smiles more than 15 years after I first used them. All examples date (I believe) from before the 1992 launch of Windows 3.1 that essentially ended the DOS/keyboard era of personal computing.

In no particular order…

Stacker (Stac Electronics) – disk compression technology that turned a 10 MB hard drive into a 20 MB one. Stac was one of many innovative small software companies that Microsoft out-marketed and eventually made irrelevant via operating system bloat. Bonus points if you have ever heard of Squish Disk or used it to stretch the capacity of 720k floppies.

(the original) Norton Utilities – the best tool available for recovering from a nasty crash, with tech support that would help you regardless of whether you owned their product, just for the pure joy of solving your problems and getting you up and running. Hard to imagine in the current environment… Key components were Unerase and Disk Doctor

QEMM (Quarterdeck Extended Memory Manager) – after you discovered, like Bill Gates did (or did he?) that not only was 640k not enough, but you were lucky if you could use 512k of that RAM, every k mattered

Toshiba T1000 laptop – this was my first computer and my first laptop. Actually, it was the first laptop. Twenty years later I have owned approximately 25 laptops and zero (count ‘em) desktops. Despite the 768k RAM disk, this was so technologically backward, even for its time, that it forced you to learn all sorts of innovative workarounds. Fortunately, very limited technology is a great way to develop and sharpen a techie brain…

DOS 3.1 – the first DOS that led me to believe that there would someday be a workable and powerful operating system. Little did I know how long the wait would be…and perhaps it is still ongoing. (DR-DOS was better, but it was DOA)

LapLink – the first speedy way to transfer information between computers, as long as you didn’t mind trying to keep track of those damn cables…

WinFax – a great late night savior that allowed me to fax documents from my room to the hotel’s fax machine when late night (or sometimes mid-day) printing was not yet an option…

Quattro Pro – much better than then-dominant Lotus 1-2-3, with unmatched graphics, tabbed worksheets, and many other features that were way ahead of their time

SimCity – a glimpse at the future of gaming, with the odd idea that there was nothing to win, but everything to create

Telix 3.15 – once you crossed over to the world of BBSes, you pretty much had a virtual internet all to yourself, with the exception of a bunch of other pioneering souls. Telix facilitated those modem to modem communications – which were definitely not as easy as trying to find a modern day hot spot.

Z-modem – a radical idea at the time, a file transfer protocol that actually allowed you to restart your dial-up file transfer from the point where it left off. Important in the era of frequent dropped connections.

Silly Little Mail Reader (a.k.a. SLMR or Slimer) – no piece of software has ever induced the quantum leap in internet enjoyment as did this offline mail reader
This tagline stolen by Silly Little Mail Reader!

Practical Peripherals Pocket Modem – the first cigarette box-sized modem had no lights or audible indicators, but you could travel with it and surf up to 2400 bps back in the day, about 1/22 the speed of current dial-up technology… I love the comment from the 1991 New York Times review: “…plenty of speed for all but huge amounts of data…”

Relay Net International Mail Exchange – imagine something not too far from an open source telephone-based internet, where phones called each other in the middle of the night and swapped BBS messages – long before the DARPA version of the internet was made available to the public

Tuesday, May 15, 2007

VIX Futures Starter Kit

If anyone is wondering why I’m not talking more about VIX futures on this blog, the reason is simple: ignorance. Sure, I know what VIX futures are and I know the central role they play in the calculation of VIX options values, but I can’t say that I’ve ever studied them. The time has come to eradicate that particular blind spot in my investment universe and I’ll do the best I can to pull along anyone else who is interested.
First, it may be useful to back up for a minute and take a look at the VIX as a derivative instrument. Consider that stocks are an underlying asset, options are derived from stocks, options premiums are 'derived' from options prices, volatility indices (like the VIX) are derived from the options premiums, and, to top it off, when you want to trade the VIX, you cannot trade it directly, but have to trade a VIX option, which is a derivative based not on the VIX, but VIX futures! That's a fifth or sixth generation derivative, depending upon how you count...

The way I see it, however, the most important component in the derivative chain is the VIX futures. Unless you understand VIX futures, thinking about and trading the VIX is lot like trying to drive a car with a view of the road from 30 miles back rather than what currently lies beyond the front windshield. Even you are somewhere in the Midwestern United States, drive very slowly, and have auto insurance, I wouldn’t recommend it. The VIX, unfortunately, looks more like the road pictured above.

Fortunately, the CBOE Futures Exchange (CFE) has some excellent information on VIX futures. In fact they have a monthly newsletter, Futures in Volatility, you can sign up for that includes a VIX market summary and analysis by options guru Larry McMillan, as well some trading strategy ideas, also provided by McMillan. In short, it’s the perfect place for the budding VIX futures student to brush up on his or her knowledge. After considerable searching, I have discovered where the CFE archives (hides?) these newsletters, but you may prefer to follow the CFE’s instructions to get the newsletter delivered via e-mail.

Homework is optional at VIX and More, but don’t be surprised if I refer to these newsletters (only three of them so far, about 8 pages each) down the road.

Monday, May 14, 2007

IV and HV for SPY and VIX

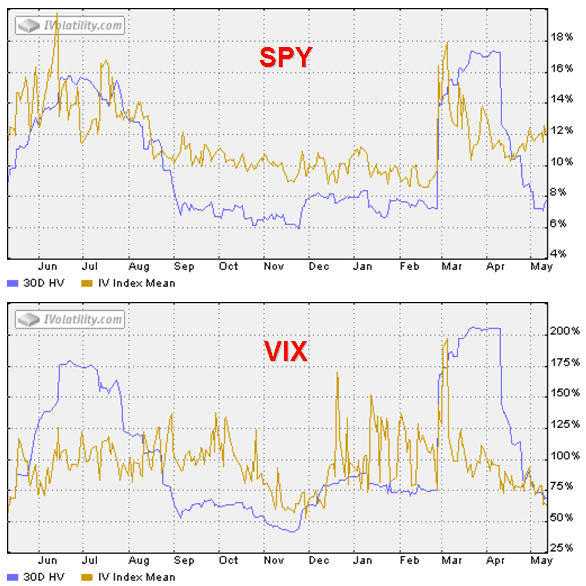
Earlier today, Adam at Daily Options Report posted a one year chart of the implied and historical volatility for SPY (commonly known as SPDRs or Spiders, the original ETF used to track the S&P 500 index) to help drive home the point that for all but one of the past eight and a half months, the SPY options have been overpriced relative to the volatility of the underlying. Adam’s bottom line is that the gap between the current IV and historical IV for SPY is at least as wide as it has been during the past year.

Since I have not done so before, I thought it might be instructive to juxtapose (my favorite word, but I digress…) the identical VIX chart to see if any related conclusions might jump off of the page.

In looking at the charts below, at least four different conclusions immediately present themselves to my eye:

  • unlike SPY, the VIX IV has, on average, tracked reasonably close to historical volatility over the course of the past year; with the exception of brief spikes, only in June-July and September-October (in the pre-2/27 world) were there significant enduring discrepancies

  • the current VIX IV and HV are almost identical, in sharp contrast to the wide spread in the SPDRs

  • since mid-April the SPY IV has risen noticeably, while the VIX IV has continued to drop

  • partly as a consequence of the above, while the SPY IV is close to the middle of its one year range, the VIX IV is at the bottom of the range, approaching a one year low

I am not sure what to make of these discrepancies at the moment, but I thought I would pass along my observations and invite reader contemplation and comment. In thinking about the VIX vs. the SPY, keep in mind that VIX options are based off of futures and consequently have a slightly different time horizon than SPY options.

Sunday, May 13, 2007

Portfolio A1 Likes Tesoro

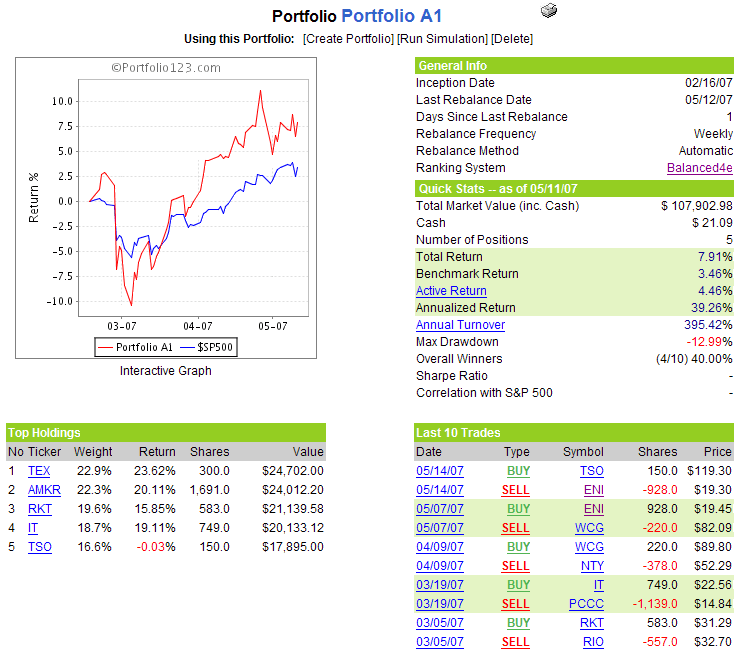
It has been interesting to watch the Portfolio A1 stock ranking system search for a fifth a final holding for this portfolio. This week Enersis (ENI) has been dropped after drifting sideways for a week, to be replaced by Tesoro (TSO). In this instance, the change is more the result of Tesoro’s rising star than a particular dissatisfaction with Enersis: from mid-January to the end of April, Tesoro has more than doubled. Still, a May 3rd earnings report failed to impress and appeared to stall the stock, yet gives the portfolio a chance to buy Tesoro in during what may turn out to be just a pause. I would love to see some stability in the holdings and I think TSO’s prospects are probably a little better than predecessors ENI, WCG (which looks to be recovering), NTY and PCCC.

In the bigger picture, the portfolio maintains its 4.5% cushion over the S&P 500, with a 7.9% gain since the February 16, 2007 inception.

There are no other changes to the portfolio for the coming week.

A snapshot of the portfolio is as follows:

VIX Off 0.01 on Week; VWSI Holds at Zero

The VIX fell a penny last week, keeping the VIX Weekly Sentiment Indicator (VWSI) stuck on zero for the third week in a row. History tells us that four of the last five times the VWSI has closed at zero for three or more consecutive weeks, the VIX continued to drift lower in the weeks that followed. The fifth time was a string of five weeks in a row ending in March 2006; after five additional quiet weeks, the Fed raised rates on May 10, 2006 and set in motion 2 ½ months of high volatility. I am making no predictions at this point in the game, but I can certainly understand those that are using the VIX for portfolio insurance or buying some speculative VIX calls.

(Note that in the above temperature gauge, the "bullish" and "bearish" labels apply to the VIX, not to the broader markets, which are usually negatively correlated with the VIX.)

Wine pairing: For an inexpensive Rhone blend recommendation, I point the reader to wines highlighted in previous posts: Robert Hall’s Rhone de Robles and Tablas Creek’s Cote de Tablas Blanc; the contrarian favorite from Spain, Wrongo Dongo; Oakley Five Reds; and The Stump Jump from Australia. If you are looking for additional ideas, you might want to check with the Rhone Rangers.

Friday, May 11, 2007

Record VIX Futures Trading Yesterday

Yesterday the CBOE Futures Exchange established a new single day volume record for trading in VIX futures, with 12,102 contracts changing hands. The new record surpassed the previous record of 10,673 by 13.4%.

For those who wonder if new volume records for VIX futures may be significant, the old record stood for exactly seven months, having been established on October 10, 2006. In terms of historical context, the October 10 activity preceded a COT report that noted a substantial swing in the holdings of commercials from net long to net short. While commercials are generally considered to be the most savvy of the three groups in the COT report, the VIX did very little over the next 5 ½ months from October to late February, save drift slowly lower as volatility continued to compress.

Thursday, May 10, 2007

Recent Links of Note

The latest installment in what I’ve been reading and pondering in the past few days:


Finally, kudos to Bespoke Investment Group, whose founders Justin Walters and Paul Hickey were the driving force behind TickerSense. I was going to hold off passing judgment on which blog to watch more closely going forward, but in less than two weeks, Bespoke has already made this question moot. My suggestion: bookmark Bespoke and/or read some of my favorites from their first batch of posts:

Wednesday, May 9, 2007

How to Find the Spiker Before the Earnings Announcement

Several readers have expressed interest in how I came up with my earnings spike potential algorithm. Essentially, this is something that has evolved over the past three weeks as a result of my desire to find companies with a high probability of making a substantial near-term move and give my CNBC Million Dollar Portfolio Challenge portfolio a chance to make a run at the finals. To make a long story short, I got the volatility I wanted, but I didn’t always get the direction right.

I would not call this a battle-tested formula. It is more like a hypothesis that continues to evolve as I get more data and continue to test and tune some of the elements. Think of it as just-in-time sausage making.

I am not an arsonist (I even missed out on youthful pyromania), but I liken this task to understanding how to get a fire started and make sure it quickly builds in intensity and spreads as rapidly as possible. For a fire, you need a starter and an accelerant; for an earnings spike, it’s essentially the same thing.

In the links below, wherever possible I have provided a favorite deep link to a free public source that includes the relevant data, calculation, graphic, etc.

Some of the more important factors I look at are:

  • Implied volatility, a great initial screening tool (higher is better) – free data at iVolatility.com; if you have an account at optionsXpress, they have excellent options screens available to all

  • Beta (higher is better) is another good accelerant barometer, though not as good as IV – available many places, including Google Finance

  • Number of analysts (lower is better) and degree of analyst consensus (lower is usually better) – Marketwatch.com has a page that not only summarizes the analyst estimates, but also provides a “coefficient variance” number that gives you a sense of the dispersion of opinion. In many cases, the earnings and/or revenue surprise is the fire starter.

  • Short ratio: days to cover (higher is better) – a classic accelerant indicator, with free data available at ShortSqueeze.com

Some secondary factors to consider:

  • Price to earnings ratio (negative or n/a is best, higher is better) – available many places, including Google Finance

  • Earnings history data there is a higher probability of a surprise if there is an erratic earnings history; there is also greater potential for a high magnitude surprise if there is a consistent pattern of beating (or missing) expectations assuming the pattern can be broken. One fun source that has earnings dates baked in to charts and post-earnings performance data available is WhisperNumber.com (more complete data for larger companies.)

  • Recent analyst ranking and/or price estimate changes (none is best) – these can work both ways, but most often they reduce the probability of a surprise. Again, Marketwatch.com is a good source.

  • News flow this is a highly subjective/qualitative assessment, but there are certain types of pre-earnings news that I believe can indicate in increased or decreased likelihood of an earnings surprise. Be particularly wary of binary events, such as the pending FDA approval for a drug and the like. The best place to find the relevant information is probably by looking at company news at Yahoo Finance. I am not ready to expand upon this one at this stage, except for…

  • Recent company guidance (none is best) – as with recent changes in analyst opinion, these usually dampen the surprise potential. Again, try Yahoo Finance.

  • Insider transactions – these are sometimes difficult to evaluate in the context of earnings, but if an apparent transactional pattern is confirmed or contradicted by earnings, there could be an accelerant. I favor Form4Oracle as a free public source of insider transaction data.

  • Technical analysis – this is good for identifying the heightened possibility of breakouts, violation of important support and resistance levels, and other factors that may act as technical accelerants. The gallery view at StockCharts.com is always a good place to start.

  • Put to call ratio (higher is better) – somewhat analogous to the short data is the individual stock open interest put to call ratio, data for which is available at SchaeffersResearch.com

  • Recent options activity – another subjective and difficult to assess measure, but if significant changes in open interest favor either puts or calls, this may be a tell. Not much in the way of great public data, but you may get some valuable information from Yahoo Finance.

  • Company size (lower is better) – this includes revenues and market capitalization. Available many places, including Google Finance.

  • Recent IPO or lack of relevant operating history (less history is better) – In general, the shorter the track record, the bigger the chance for an earnings surprise. This means that the first quarterly report or two with new management, new products, a new acquisition, etc. increases uncertainty about the result – and the potential for a surprise.

As a footnote, if you are looking for a good source for who reports when that is sortable by time of day (BMO, AMC, etc.), I like TheStreet.com’s Earnings Release calendar, where you can click on the Date/Time column to sort accordingly. If you are not familiar with a lot of the tickers/companies, then I suggest that a first pass be limited to those companies with four letter tickers whose EPS estimate and/or previous year actual EPS is negative or close to zero.

Finally, I feel obliged to remind everyone that this is a method for finding the high potential post-earnings movers, *not* the winners. I continue to play with the weightings of the various factors and ultimately your weightings should reflect your research and beliefs about the market. If you keep track of the pre-earnings data and the outcomes, you should be able to develop and tweak your own model – or at least flag some potential high fliers.

Don't Forget About "Fed Links"

I have moved my Fed Links post from March over the the Archive Highlights section of the blog for easy reference, but I thought it should mention it here for any new readers or for those like me who are just memory challenged.

For what it's worth, I have yet to find anything else on the web that is nearly as comprehensive...

CXO Advisory Group on CBOE Put to Call Ratio and ISEE

Yesterday, the CXO Advisory Group published an analysis of the CBOE total (index plus equity) put to call ratio, looking out at 5, 21 and 63 day time horizons. They concluded that relative to the S&P 500 index data, the CBOE total put to call ratio is "not a useful indicator for short-term or intermediate-term trading" and found that the put to call numbers are more likely to lag rather than lead the S&P 500 data.

In a follow-up piece this morning, the folks at CXO examined the ISEE data in a similar fashion. While they found a stronger relationship between the ISEE and the S&P 500 index, they expressed concern about the sample size in the course of concluding that the ISEE "may offer a slight edge for intermediate trading," particularly at the 63 day horizon.

My suggestion is that you read both of the CXO articles in full and take a look at my comments about the usefulness of the ISEE 50 day simple moving average and Bernie Schaeffer's recent comments and charts regarding the CBOE equity put to call ratio. Of the three CBOE put to call measures (index, equity, and total put to call ratios), I put considerably more stock in the equity variant, which tracks most closely to the ISEE.

I will have more to say about the ISEE and the CBOE put to call ratios in the future. While I believe that following these ratios is a worthwhile endeavor for gauging investor sentiment, I strongly suggest that they not be the only arrow in your quiver.

Monday, May 7, 2007

Tuesday is a Traveling Day

...so I'll leave you in the good hands of my highly capable friends on the "Blogs I Read" list in the event that I am not able to update the blog on the fly.

CNBC Million Dollar Portfolio Challenge: #143,438

It’s not as bad as RoyTin Cup’ McAvoy blowing up on the 18th hole, but shaving $700,000 off of my CNBC portfolio in just a week was still quite a feat – if you are impressed by people who can run backward and that sort of thing.

There are now 1,603,782 contestants in this parade of silliness, so thanks to their collective mediocre performance, I have somehow managed to stay in the top 9%. All you need to know about last week is that Friday’s LeapFrog Enterprises (LF) gambit turned out to be my best pick of the week at -1.5%.

Fortunately, the ship seems to have been righted today, as Flamel Technologies (FLML) is up 7.3% at the moment. I’d really like to make it back into at least the top 5% before the contest ends on Friday. It looks like FLML will be a good first step. My earnings pick for today will probably come from this group that has been selected by my earnings spike potential algorithm. I’m still debating which one I should put all my chips on.

There are no mulligans on the 18th hole and rest assured, I’m not going to lay up...

ISEE at 173 Intra-Day

I generally don't get particularly excited about intra-day sentiment numbers, but I was surprised to see that the ISEE jumped from a low opening reading of 108 to a relatively stratospheric 173 as of 11:30 EDT. The smaller sample size makes the first few readings of each day less significant, but I am now on notice to pay closer attention to this indicator as we move forward.

For the record, since August 2006 there have only been two closes above the 173 level: a 184 on 12/18 and a 175 on 1/16. Obviously, neither of those readings signaled an imminent top, but in three of the seven days just prior to the May 2006 top, we did see the ISEE close over 200.

Sunday, May 6, 2007

WCG Out and ENI In at Portfolio A1

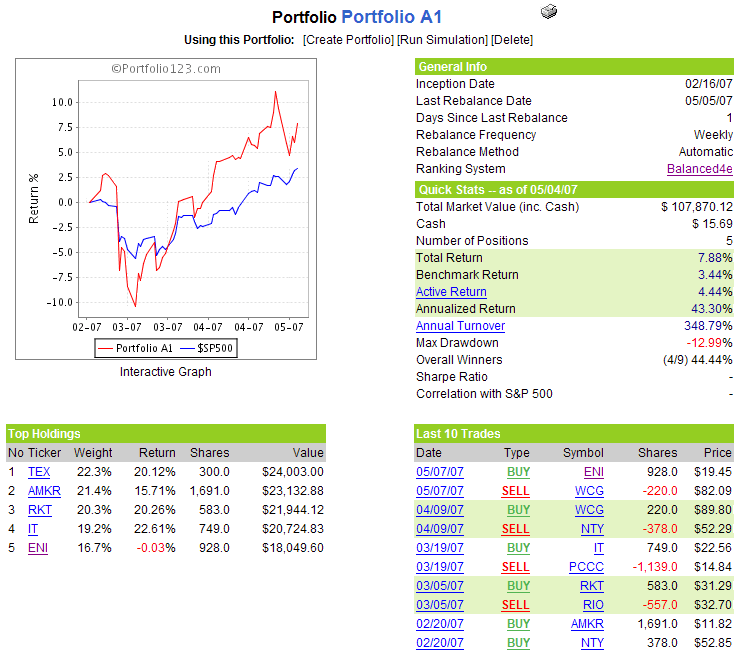
Information technology research powerhouse Gartner (IT) posted a strong first quarter and raised guidance and raised full year revenue and earnings guidance before the bell Thursday, then rode bullish analyst comments up 8% Friday, helping to offset some of the continued weak performance from WellCare Health Plans (WCG), which is being dropped from the portfolio. WCG has been a significant drag on portfolio performance and is largely responsible for reducing the cumulative performance advantage over the benchmark S&P 500 from last week’s 6.8% to this week’s 4.4%.

The story of the individual holdings continues to be one of four strong performers in search of a fifth and final holding that will provide a little more diversification without dragging down performance. With WCG out, the portfolio now turns to Chilean hydroelectric company Enersis (ENI) to see if it can fill that bill. Will Frankenhoff outlined the bull case for Enersis at Motley Fool in February. Since reporting earnings on April 25th, Enersis has moved up another 10%, but Portfolio A1’s stock ranking system is undeterred and believes Enersis still represents a good value.

For the record, the portfolio’s proprietary ranking system ranked 7804 stocks this week. ENI had an overall rank of 35, but was selected because one or more of the following buying rules eliminated the higher ranked stocks:

  • Market capitalization > $250 million
  • Average volume over the past 20 days > 300,000
  • Friday’s closing price > 10

Finally, stocks cannot be added to the portfolio if their inclusion will push any sector weighting to over 30% of the portfolio.

There are no other changes to the portfolio for the coming week.

A snapshot of the portfolio is as follows:

Saturday, May 5, 2007

VWSI at Zero Again; Another Rhone White Blend to Pass the Time

Not much has changed on the VIX front between last week and this week, with the result that the VIX Weekly Sentiment Indicator (VWSI) is holding steady at zero. The one recent development in the VIX that I am watching most closely is the correlation with the SPX. I summarized my current thinking on this yesterday in “Predictive Value of SPX and VIX Correlation – First Pass.”

(Note that in the above temperature gauge, the "bullish" and "bearish" labels apply to the VIX, not to the broader markets, which are usually negatively correlated with the VIX.)

Wine pairing: This week I would like to highlight a recent find, “The Stump Jump,” a refreshing, food-friendly white Rhone-ish blend of from South Australia’s d’Arenberg. I say “ish” because the 2006 vintage consists of 63% riesling, 16% sauvignon blanc, and for Rhone purists, ‘only’ 13% rousanne and 7% marsanne. Frankly, I was surprised to see the high riesling content, as my taste buds were convinced that this was a more traditional Rhone blend – and an excellent one at that, particularly for the $8.99 price tag. There is also a red Stump Jump that I have not yet tried; the red is a more traditional Rhone blend, consisting of 46% grenache, 34% syrah and 20% mourvedre in the 2005 vintage. For those that are interested in these things, Robert Parker rated the 2005 white an 87 and the red an 88.

Previous inexpensive Rhone blend recommendations include Robert Hall’s Rhone de Robles and Tablas Creek’s Cote de Tablas Blanc, the contrarian favorite, Wrongo Dongo, and Cline CellarsOakley Five Reds.

DISCLAIMER: "VIX®" is a trademark of Chicago Board Options Exchange, Incorporated. Chicago Board Options Exchange, Incorporated is not affiliated with this website or this website's owner's or operators. CBOE assumes no responsibility for the accuracy or completeness or any other aspect of any content posted on this website by its operator or any third party. All content on this site is provided for informational and entertainment purposes only and is not intended as advice to buy or sell any securities. Stocks are difficult to trade; options are even harder. When it comes to VIX derivatives, don't fall into the trap of thinking that just because you can ride a horse, you can ride an alligator. Please do your own homework and accept full responsibility for any investment decisions you make. No content on this site can be used for commercial purposes without the prior written permission of the author. Copyright © 2007-2023 Bill Luby. All rights reserved.
 
Web Analytics