Showing posts with label BEP. Show all posts

Friday, November 28, 2008

Recent Highlights in Volatility

I am moving closer and closer to a regular feature along the lines of “The Week in Volatility.” I’m not quite there yet, so today I am going to turn the keyboard over to others around the blogosphere who have posted some interesting articles of note about volatility from the past week:

Monday, September 8, 2008

The Value of Selling Covered Calls

One subject that gets less attention than it deserves is the value investors can extract from selling covered calls. To be fair, a covered call strategy sacrifices what can sometimes be considerable upside in exchange for a fixed return, but this can be a highly effective strategy in a range-bound market.

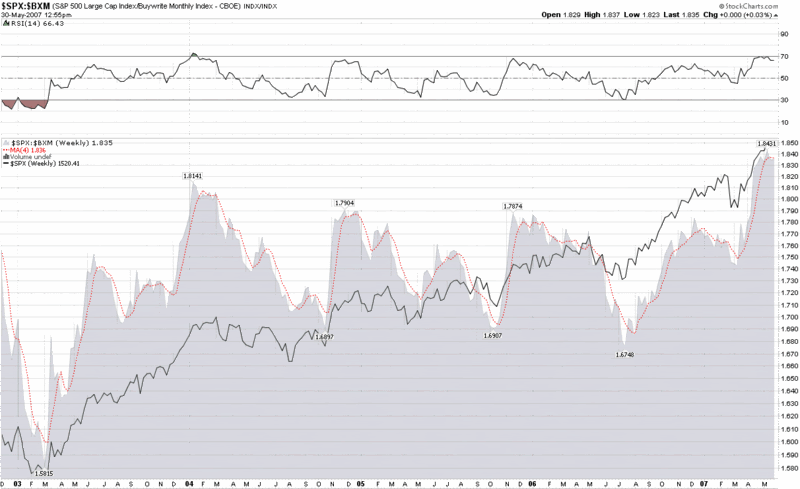
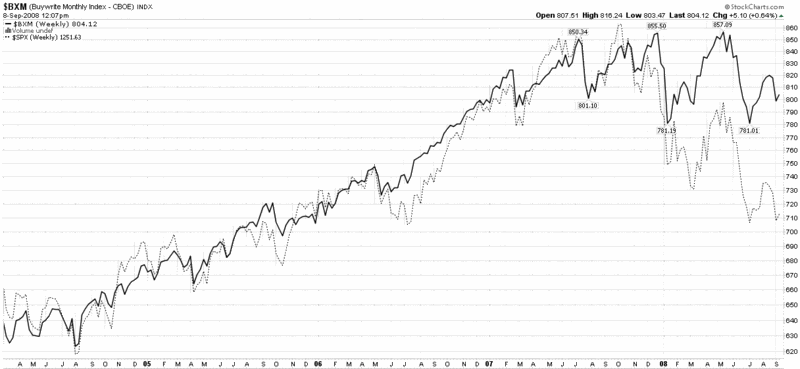
The chart below is a weekly chart that shows the CBOE S&P 500 Buy-Write Index (BXM), which is designed to replicate a buy-write or covered call strategy for the S&P 500 Index. Note that during the recent bull market, a buy-write strategy resulted in roughly the same returns as owing the SPX, but with less volatility.


[source: StockCharts]

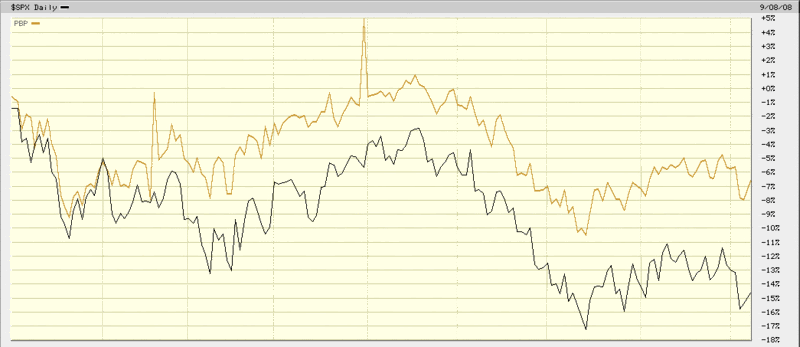
More importantly, over the course of the last year, a buy-write strategy has significantly outperformed the SPX. The details can be seen in the next chart, where a relatively new ETF, the PowerShares S&P 500 BuyWrite Portfolio (PBP) has lost value at less than half of the rate of the losses in the SPX.

In sideways markets, in down markets, and even in up markets, a buy-write or covered call approach like that of the PBP (or first cousins BEP and MCN) can be an excellent way to increase returns and reduce risk.


[source: BigCharts]

Thursday, March 20, 2008

BEP and the Joy of Covered Call Funds

I have spoken about buy-write or covered call funds on a number of occasions, perhaps most notably in One Approach for Volatile Sideways Markets.

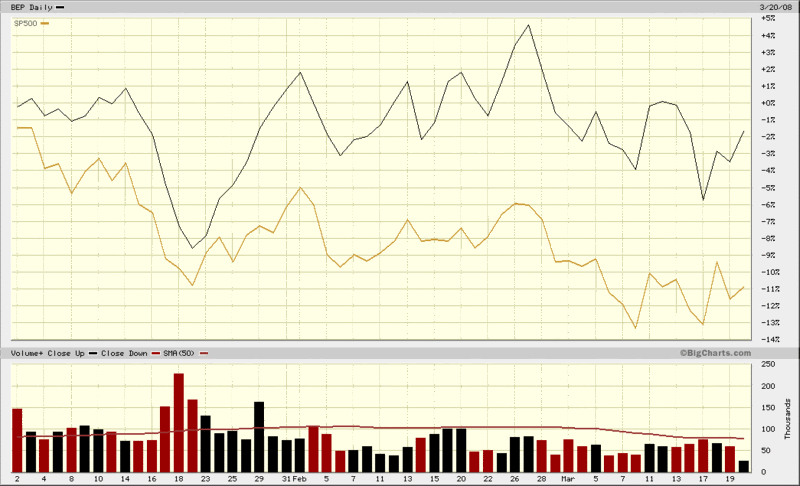
One of my favorite funds in the covered call space is the S&P 500 Covered Call Fund (BEP), a closed-end fund that is the most actively traded of the covered call funds. BEP is currently trading at a 4.9% discount to net asset value and is an excellent way to capture some of the volatility premium in the current market without having to go to the trouble of establishing your own covered call portfolio. Looking at the chart below, while the SPX is down approximately 11% year to date, by writing covered calls against the SPX, BEP has managed a loss of only about 1.5% since the beginning of the year. Covered call funds will almost always outperform the SPX in down and sideways markets, but will generally have less upside potential in a bull market.

For a more detailed profile of BEP, follow the link to the Closed-End Fund Association’s (CEFA) web site or get an annual report and other information directly from the BEP splash page at IQ Investment Advisors.

Tuesday, December 4, 2007

Thinking Sideways But Volatile? Consider MCN…

Until further notice, I am going to consider this a sideways market instead of trying to guess whether the next big move will be up or down.

In terms of trading implications, this means selling volatility in the form of bear spreads, iron condors, iron butterflies, short strangles, short straddles, selling an occasional naked call, and even that old standby, covered calls.

If you are not a regular options seller, many of these strategies can seem daunting, risky, expensive, and a lot of work. While this can be the case, there is an easy way: a covered call fund or ETF. I have prominently mentioned BEP here in the past. BEP, also known as the S&P 500 Covered Call Fund, is a closed-end fund that does exactly what the fund’s name says. I am increasingly becoming more of a fan of another closed-end fund that is very similar: the Madison/Claymore Covered Call and Equity Strategy Fund (MCN). This fund trades a little more actively than BEP, appears to be a little more flexible in its investment approach than BEP, and carries a current dividend yield of 11.5%.

In a sideways market where investors fear a lot of volatility, I’ll take 11.5% and a chance to participate in an up move any day…

Tuesday, October 23, 2007

Fibonacci Retracements and Trading Ranges

Most traders are reasonably knowledgeable about Fibonacci retracements, which predict the likely percentage retracement of any preceding up or down move. The details of Fibonacci retracements are discussed in many places on the web, so I won’t repeat them here other than to note that the most commonly used Fibonacci numbers are the retracement percentages of 38.2%, 50%, and 61.8%. When markets move sharply in one direction, then turn around, the first question traders tend to ask themselves is how long the move will last. The usual suspects are previous closes, moving averages and “Fibs.”

Even if you don’t believe in what some consider to be the equivalent of numerical astrology, the important thing is that other traders do and right or wrong, they can make Fibs a self-fulfilling prophecy.

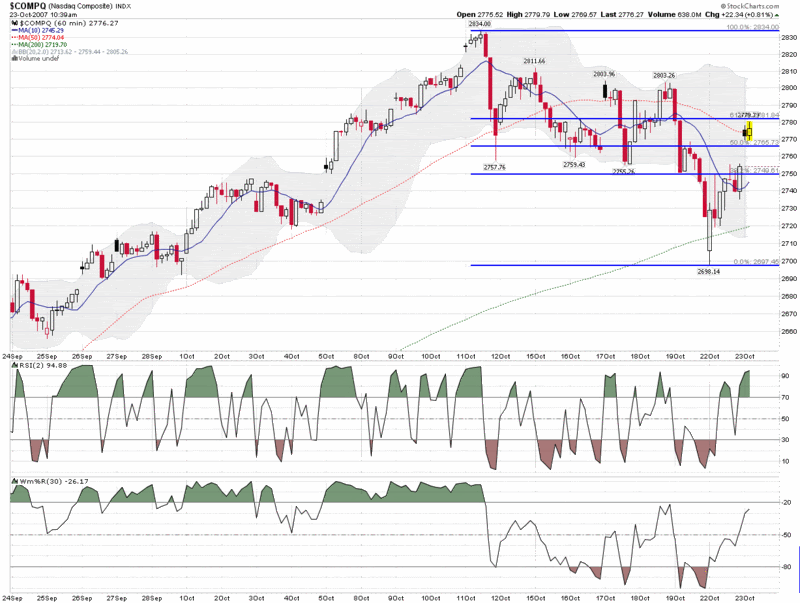
Part of the reason I mention all of this is that the NASDAQ composite just retraced about 61.8% of the recent drop and now is finding resistance at the Fibonacci level. The chart below tells much of this story, but the pressing question is what happens next. There is a temptation to assume that the bulls will eventually win out once again or that this time it looks like the bears finally have the numbers…but there is a third possibility, that we may be entering into a trading range. Once again, it is way too early to determine whether this may be the case, but today’s stalemate (so far) opens up that possibility. IF we are going to be in a trading range for awhile, expect Fibonacci levels to play an important role in defining the trading range, along with the other usual suspects.

Also, keep in mind that if we are in a trading range and volatility expectations continue to be on the high side, a covered call (or buy-write) fund, like market leader BEP, is an excellent low risk way to beat the market.

Thursday, July 26, 2007

One Approach for Volatile Sideways Markets

About two months ago, I talked about three different buy-write products (two closed-end funds and an exchange-traded note or ETN) which are designed to mimic a strategy of writing covered calls, such as is tracked by the CBOE S&P 500 Buy-Write Index (BXM.)

I was being a little cheeky when I suggested that this index might be useful as a market timing tool. Instead, I figured that the best application of a buy-write strategy would likely be as a cash equivalent of sorts, particularly for those who were looking for a place to park their money somewhere that it could earn a reasonable return in a volatile sideways market, yet participate in any unexpected upward moves.

I think we may be in just that market environment right now.

If you are worried about the RUT falling through its 200 day SMA today and most of the other major indices penetrating their 50 day SMAs, then perhaps you should take a long look at the BEP, MCN and BWV. I am slightly partial to the BWV, because, as an ETN, it will not have (taxable) distributions. There has been very little volume in BWV in the two months it has traded, but with a typical bid-ask spread of 0.10, it is competitive with the more liquid BEP and MCN at least on a small scale.

Wednesday, May 30, 2007

BuyWrite Index as a Timing Tool?

Adam at Daily Options Report has recently been talking about the CBOE S&P 500 BuyWrite Index (BXM) and related products in considerable detail – enough for me to finally take a look at it myself. Between the information on the CBOE site linked above, Adam’s comments and the insights of ETF-friendly blogger ‘Random’ Roger Nusbaum, you can find out just about anything you might wish to know about the BXM and products that utilized covered call strategies. Well, almost anything.

I got to wondering whether or not the BXM might be useful as a timing tool. After spending a little time at StockCharts.com, I put together several ratio charts that compare the SPX to the BXM. In a weekly ratio chart, appended below, I noted that for the last several years when the SPX to BXM ratio approaches 1.80 (or generally makes any 6-12 month high) and rolls over, this has usually provided some advance warning of a significant correction in the SPX over the next two to three months. What particularly caught my attention in the current chart is very high 1.836 moving average reading that appears to be just beginning to roll over.

This ratio is something worth watching; and the BXM and related products (BEP, MCN, and the newly minted ETN, BWV) are another way to think about harvesting volatility in what could be turning into a toppy market.

DISCLAIMER: "VIX®" is a trademark of Chicago Board Options Exchange, Incorporated. Chicago Board Options Exchange, Incorporated is not affiliated with this website or this website's owner's or operators. CBOE assumes no responsibility for the accuracy or completeness or any other aspect of any content posted on this website by its operator or any third party. All content on this site is provided for informational and entertainment purposes only and is not intended as advice to buy or sell any securities. Stocks are difficult to trade; options are even harder. When it comes to VIX derivatives, don't fall into the trap of thinking that just because you can ride a horse, you can ride an alligator. Please do your own homework and accept full responsibility for any investment decisions you make. No content on this site can be used for commercial purposes without the prior written permission of the author. Copyright © 2007-2023 Bill Luby. All rights reserved.
 
Web Analytics