Showing posts with label Fibonacci. Show all posts

Sunday, June 27, 2010

Chart of the Week: The Weekly SPX and Fibonaccis

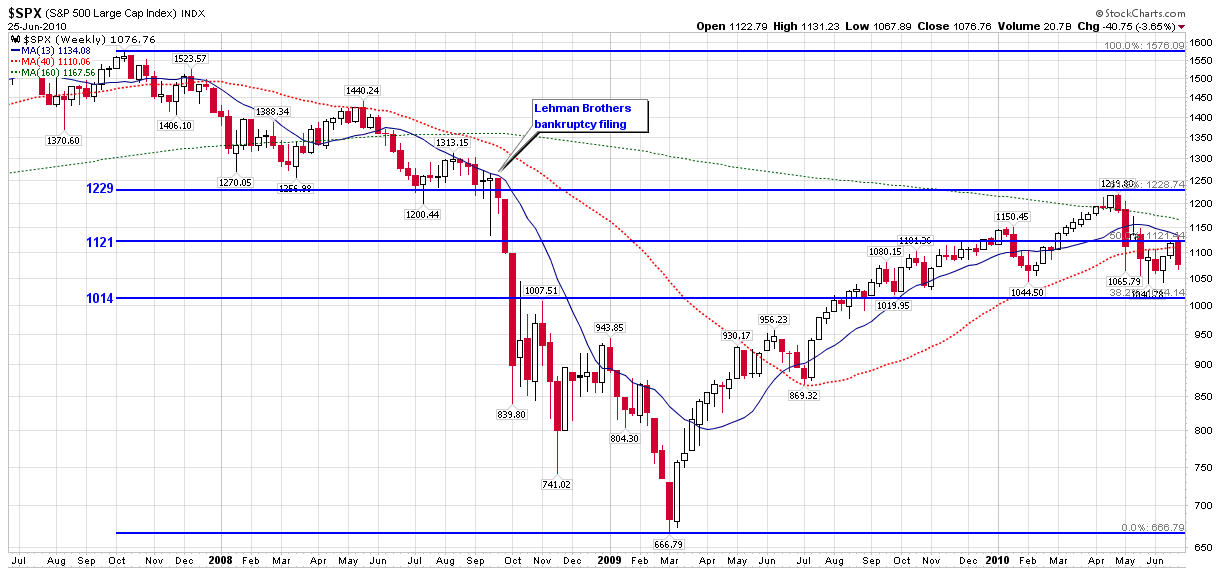
This week’s chart of the week is simple and straightforward: weekly bars of the S&P 500 index.

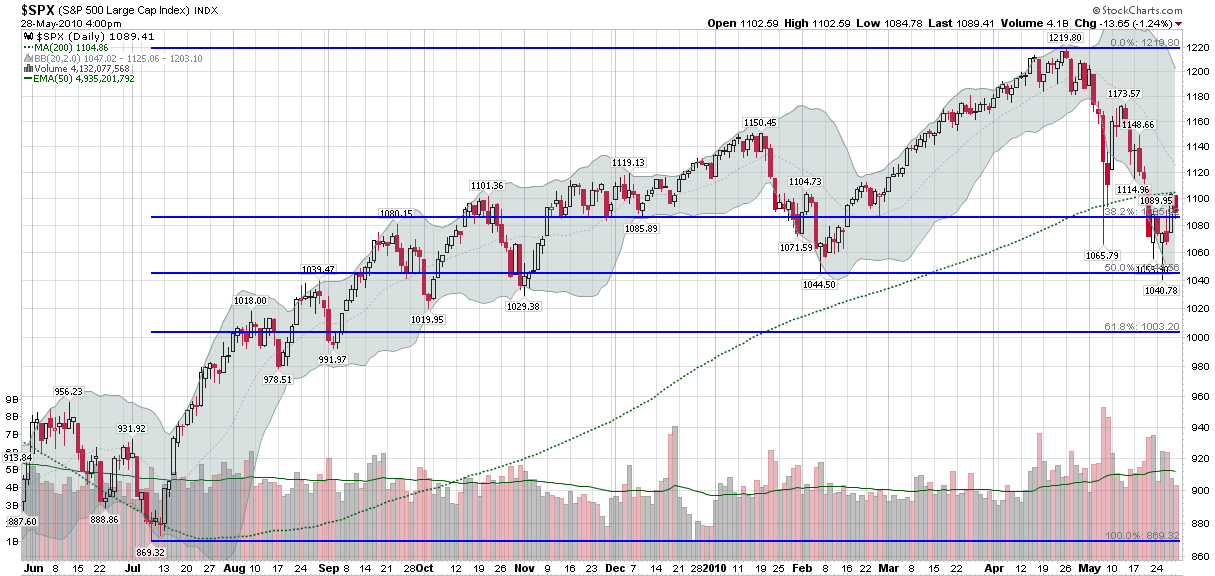
In the chart below, I have added Fibonacci retracement levels to demonstrate that the rally off of the March 2009 lows has been stuck in a post-Lehman Fibonacci retracement zone (i.e., between the 38.2% and 61.8% retracement levels) for the past ten months.

The chart is essentially an updated version of a chart I showed on April 13 in Technical Resistance Looms in the S&P 500 Index. At the time I said, “This seems like a good time to play the Fibonacci retracement card and suggest that significant technical resistance looms for the SPX, particularly in the area of 1225 and above.” Now some eleven weeks later, Fibonacci levels are suggesting that we have a good chance of seeing range-bound trading in the area of SPX 1014-1229.

Of course, in order to define a trading range, stocks are going to have to do a more convincing job of establishing downside support. For the moment, at least, it is the bottom of this (potential) trading range that looks a little shaky.

For more on related subjects, readers are encouraged to check out:


[source: StockCharts.com]

Disclosure(s): none

Monday, May 31, 2010

Chart of the Week: SPX, Fibs and 200 Day MA

This week’s chart of the week is an attempt to offer something relatively simple and uncluttered: a one year look at the S&P 500 index.

The chart below shows daily bars of the SPX, with four highlighted overlays:

  1. A 200 day moving average (dotted green line) – currently at 1105, moving up about two points a week and looming as possible upside resistance

  2. Fibonacci retracement levels drawn from the July 2009 low of 869 to the April 2010 high of 1219 – these generate a 50% retracement level of 1044 (recent support) and a 38.2% retracement level of 1085 (just below current levels)

  3. Volume, including a 50 day moving average (solid green line) – which shows activity picking up dramatically in May

  4. Bollinger bands (the gray cloud, based on 20 days and 2 standard deviations)

Apart from noting that the 200 day MA and Fibonacci retracement levels (particularly 1085 at the moment) look to be important lines in the sand, I will leave the balance of the conclusions to the reader.


[source: StockCharts.com]

Disclosure(s): none

Tuesday, April 13, 2010

Technical Resistance Looms in S&P 500 Index

With a strong earnings report coming from Intel (INTC) after hours, the futures are pointing to a bullish open tomorrow morning and a likely run at 1200 for the S&P 500 index.

Now that quite a few pundits already on record as saying that stocks are overextended, this seems like a good time to play the Fibonacci retracement card and suggest that significant technical resistance looms for the SPX, particularly in the area of 1225 and above.

As the chart below (three years, weekly bars) shows, SPX 1225 is technically significant for several reasons. First of all, 1228 is the 61.8% retracement level from the October 2007 high to the March 2009 low. Second, the SPX 1225-1250 zone sits just below where the index closed (1251) on the Friday prior to the Lehman Brothers bankruptcy filing. Looking farther back, the 1225-1250 zone also defines support for the March 2008 (Bear Stearns) low and subsequent lows in the beginning of July 2008.

To quickly summarize, the SPX first has to scale the psychologically significant 1200 level, where the last close above the level was on September 26, 2008. On the other side of 1200 looms a key Fibonacci retracement level, as well as the ghosts of Lehman Brothers, Bear Stearns and others.

Now it is possible that stocks will continue to ignore gravity and skate right past these barriers, but I suspect it is finally time that technical resistance decides to drop its gloves and fight back.

For more on related subjects, readers are encouraged to check out:


[source: StockCharts.com]

Disclosure(s): none

Monday, June 15, 2009

Open Thread: Do Fibonacci Retracements Work?

Following my recent Dueling Fibonaccis for the SPX, a reader asked if I knew of any 'scientific' studies that attempted to evaluate the usefulness of Fibonacci retracement levels. The short answer is that I am unaware of any detailed studies, nor was I able to dig up anything meaningful with a search of SSRN.

So I turn this topic over to readers:

  • Do Fibonacci numbers work as a trading tool?

  • Are you aware of any published analysis which evealuates Fibonacci retracement levels?

Friday, June 12, 2009

Dueling Fibonaccis for the SPX

I had suspected that I might get some pushback from some of the charting purists about limiting the scope of my Fibonacci retracement lines to a post-Lehman world, particularly since the SPX had already corrected more than 300 points prior to the Lehman Brothers bankruptcy filing.

My explanation, quite simply, is that the investment world changed radically in September 2008, both from a fundamental and technical perspective. I even used the term Market 2.0 to describe the situation at that time. Technically, at that time the markets transitioned from a measured decline to a series of free falls that took ten day historical volatility to as high as 100 in October.

In the chart below, I have superimposed two different sets of Fibonacci retracements on top of almost two years of daily SPX data. The dotted blue lines repeat my post-Lehman world view as presented in SPX and Fibonacci Resistance at 966 earlier today; the solid green lines reflect a more traditional approach to Fibonacci calculations, using the October 2007 high of 1576 as a point of departure. I have highlighted the 50% retracement levels for both sets of calculations, using blue arrows for the post-Lehman data and green arrows for the data going back to 2007. Note that the difference is a full 155 points: 966 in a post-Lehman world and 1121 using the 2007 high.

If the markets continue to rally, I would encourage readers to pay attention to the green Fibonacci lines. In the meantime, I continue to believe that the post-Lehman period – at least while the SPX remains below 1000 – is the appropriate time frame on which to focus our analytical lens.

[source: StockCharts]

Saturday, February 7, 2009

Chart of the Week: SPX Price by Volume

There are many methods that technicians use to help determine when various market moves may run into significant support and resistance. Moving averages are one common method, pivot points are another, and Fibonacci retracement levels are one of my personal favorites.

Another method of gauging support and resistance involves the use of charting price by volume. As I have lately heard very little about price by volume charts, this seems like a good time to make these charts the subject of this week’s chart of the week.

In the graphic below, in addition to the standard daily volume vertical bars at the bottom, I have used one of the StockCharts tools to plot horizontal bars that represent the total volume for all the days in which the closing price fell in the range described by each horizontal price by volume bar. The longer the bars, the more volume that was transacted within that price range. For more detailed analysis, I have also color coded the price by volume bars so that total volume for each price by volume range can be further decomposed into up volume (gray) and down volume (red).

In terms of time frame, I have used SPX data from the beginning of October 2008, when the SPX first dipped below 1000, to illustrate possible resistance. Note that during this 18 week period, a large portion of the volume fell in the range of approximately 820-920.

With the SPX currently just one point below its 50 day simple moving average (dotted red line), additional upside movement may be harder to come by. According to price by volume charts, however, the biggest resistance should be in the 890-920 area, where not only is the volume by price bar a long one, it is also predominantly red from previous selling pressure.

If the SPX can clear 920, then resistance (as indicated by the length of the bar and also the ratio of red to gray area) seems to fall off dramatically, with 955 looking like a much less formidable hurdle on the road back to 1000.

Of course the charts have no idea what Geithner is going to say on Monday, nor how the House and Senate will resolve their different perspectives on what needs to be included in the economic stimulus package.

[source: StockCharts]

Friday, May 2, 2008

Limited Upside for Consumer Discretionary Sector?

As Corey at Afraid to Trade pointed out in Some Surprising Trend Day Action, one of the more interesting sub-plots in yesterday’s breakout was the strength in the consumer discretionary sector, which rallied 5.8%.

I am firmly of the opinion that the current stock market rally cannot be sustained unless consumer confidence, consumer purchasing power and consumer activity all rally in concert with the markets.

My concern with the consumer discretionary sector extends to a chart of the sector ETF, XLY. In the weekly chart below, the current level of the XLY (33.55 as I type this) is now back to the 32-34 area bounded by the symmetrical triangle formation of 2005-2006 and is also rapidly approaching the 34.08 50% Fibonacci retracement level. Both of these indicators suggest that the XLY should find considerable resistance in the 34-35 area; if this is the case, the market will have to rely on other sectors to continue the current bull rally.

Monday, November 12, 2007

NASDAQ Chart with Hourly Bars

On Friday I posted a weekly chart of the NASDAQ going back six years. Today I am swapping the wide angle lens for a telephoto one and focusing on hourly bars for the past month. I am emphasizing the NASDAQ Composite (and the NDX) because that is where a good deal of the speculative activity has been as of late and where the correction was most severe last week.

The graph below shows four semi-arbitrary simple moving averages for the NASDAQ Composite Index: 13 bars; 20 bars (the faint dotted gray line in the middle of the Bollinger Bands); 30 bars (the same as the Williams %R time frame); and 100 bars. All this spans roughly a period of 1 ½ days to about 3 weeks. With the aforementioned Bollinger Bands and Williams %R data, as well as the Fibonacci retracement lines, there are many ways to keep score. As much as anything, however, I will be looking at the intensity and duration of the bull rallies off of the bottom. Given that many indicators point to the current situation as significantly oversold, the absence of a compelling bull rally may provide as much information as what is actually happening. In other words, a draw should favor the bears.

Finally, I still haven’t seen much in the way of fear yet…

Thursday, November 8, 2007

BIDU Fibonacci Targets

In measuring back to the mid-August low, I calculate BIDU's Fibonacci retracement targets to the downside to be 326 (38.2%), 295 (50%), and 263 (61.8%). This could get interesting.

Tuesday, October 23, 2007

Fibonacci Retracements and Trading Ranges

Most traders are reasonably knowledgeable about Fibonacci retracements, which predict the likely percentage retracement of any preceding up or down move. The details of Fibonacci retracements are discussed in many places on the web, so I won’t repeat them here other than to note that the most commonly used Fibonacci numbers are the retracement percentages of 38.2%, 50%, and 61.8%. When markets move sharply in one direction, then turn around, the first question traders tend to ask themselves is how long the move will last. The usual suspects are previous closes, moving averages and “Fibs.”

Even if you don’t believe in what some consider to be the equivalent of numerical astrology, the important thing is that other traders do and right or wrong, they can make Fibs a self-fulfilling prophecy.

Part of the reason I mention all of this is that the NASDAQ composite just retraced about 61.8% of the recent drop and now is finding resistance at the Fibonacci level. The chart below tells much of this story, but the pressing question is what happens next. There is a temptation to assume that the bulls will eventually win out once again or that this time it looks like the bears finally have the numbers…but there is a third possibility, that we may be entering into a trading range. Once again, it is way too early to determine whether this may be the case, but today’s stalemate (so far) opens up that possibility. IF we are going to be in a trading range for awhile, expect Fibonacci levels to play an important role in defining the trading range, along with the other usual suspects.

Also, keep in mind that if we are in a trading range and volatility expectations continue to be on the high side, a covered call (or buy-write) fund, like market leader BEP, is an excellent low risk way to beat the market.

DISCLAIMER: "VIX®" is a trademark of Chicago Board Options Exchange, Incorporated. Chicago Board Options Exchange, Incorporated is not affiliated with this website or this website's owner's or operators. CBOE assumes no responsibility for the accuracy or completeness or any other aspect of any content posted on this website by its operator or any third party. All content on this site is provided for informational and entertainment purposes only and is not intended as advice to buy or sell any securities. Stocks are difficult to trade; options are even harder. When it comes to VIX derivatives, don't fall into the trap of thinking that just because you can ride a horse, you can ride an alligator. Please do your own homework and accept full responsibility for any investment decisions you make. No content on this site can be used for commercial purposes without the prior written permission of the author. Copyright © 2007-2023 Bill Luby. All rights reserved.
 
Web Analytics