Chart of the Week: SPX, Fibs and 200 Day MA
This week’s chart of the week is an attempt to offer something relatively simple and uncluttered: a one year look at the S&P 500 index.
The chart below shows daily bars of the SPX, with four highlighted overlays:
- A 200 day moving average (dotted green line) – currently at 1105, moving up about two points a week and looming as possible upside resistance
- Fibonacci retracement levels drawn from the July 2009 low of 869 to the April 2010 high of 1219 – these generate a 50% retracement level of 1044 (recent support) and a 38.2% retracement level of 1085 (just below current levels)
- Volume, including a 50 day moving average (solid green line) – which shows activity picking up dramatically in May
- Bollinger bands (the gray cloud, based on 20 days and 2 standard deviations)
Apart from noting that the 200 day MA and Fibonacci retracement levels (particularly 1085 at the moment) look to be important lines in the sand, I will leave the balance of the conclusions to the reader.
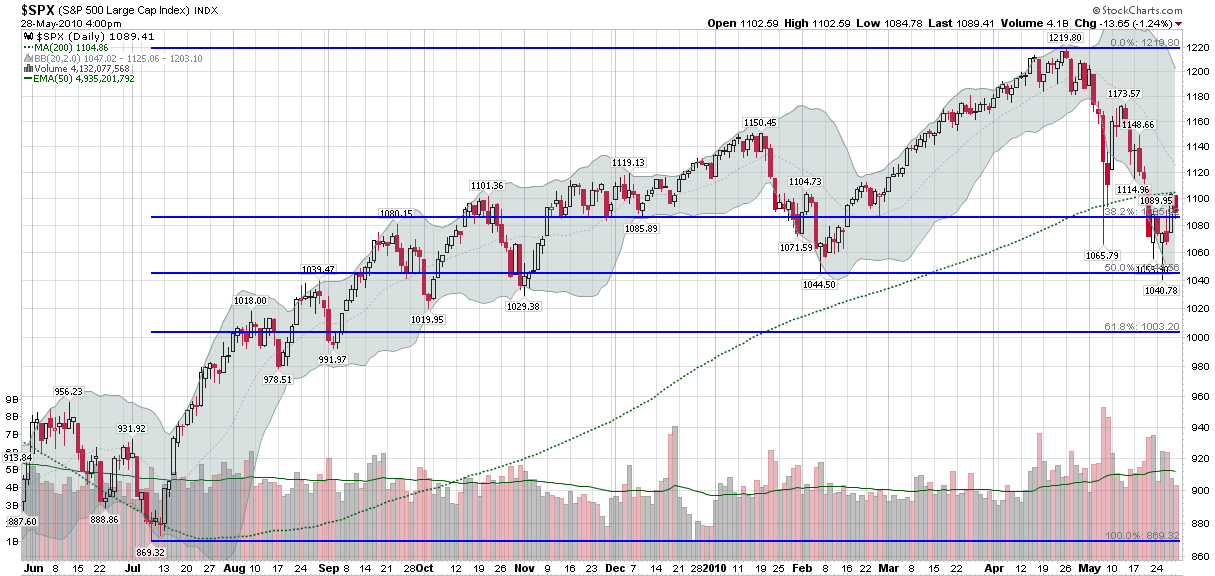
[source: StockCharts.com]
Disclosure(s): none

