Wednesday, November 30, 2011

VIX Reflecting Skepticism About Rally

With the S&P 500 index up 3.4% as I type this and the VIX down 7.8%, it is clear that there is a fairly substantial disconnect at the moment between those who are buying stocks and those who are trading options on the SPX.  The picture is even more dramatic if you look at the upward trend in both the SPX and the VIX since the open.  The graphic below is not ideal for deciphering the relative movements, but the unusually high correlation between stocks and implied volatility is unmistakable when looking at today’s intraday price action.

With the VIX typically moving about 4x as rapidly in the opposite direction of the SPX under ‘normal’ market conditions, it appears as if many investors are skeptical about stocks continuing to rally in the face of ongoing uncertainty about the Europe-driven news cycle.  Following an initial pop, the euro is selling off and after it dropped into the 27s, the VIX now looks content to remain above 28 for the balance of the day, the bullish action in stocks notwithstanding.  One simple explanation:  investors are snapping up options, including put protection, at what look like bargain basement prices.

Related posts:


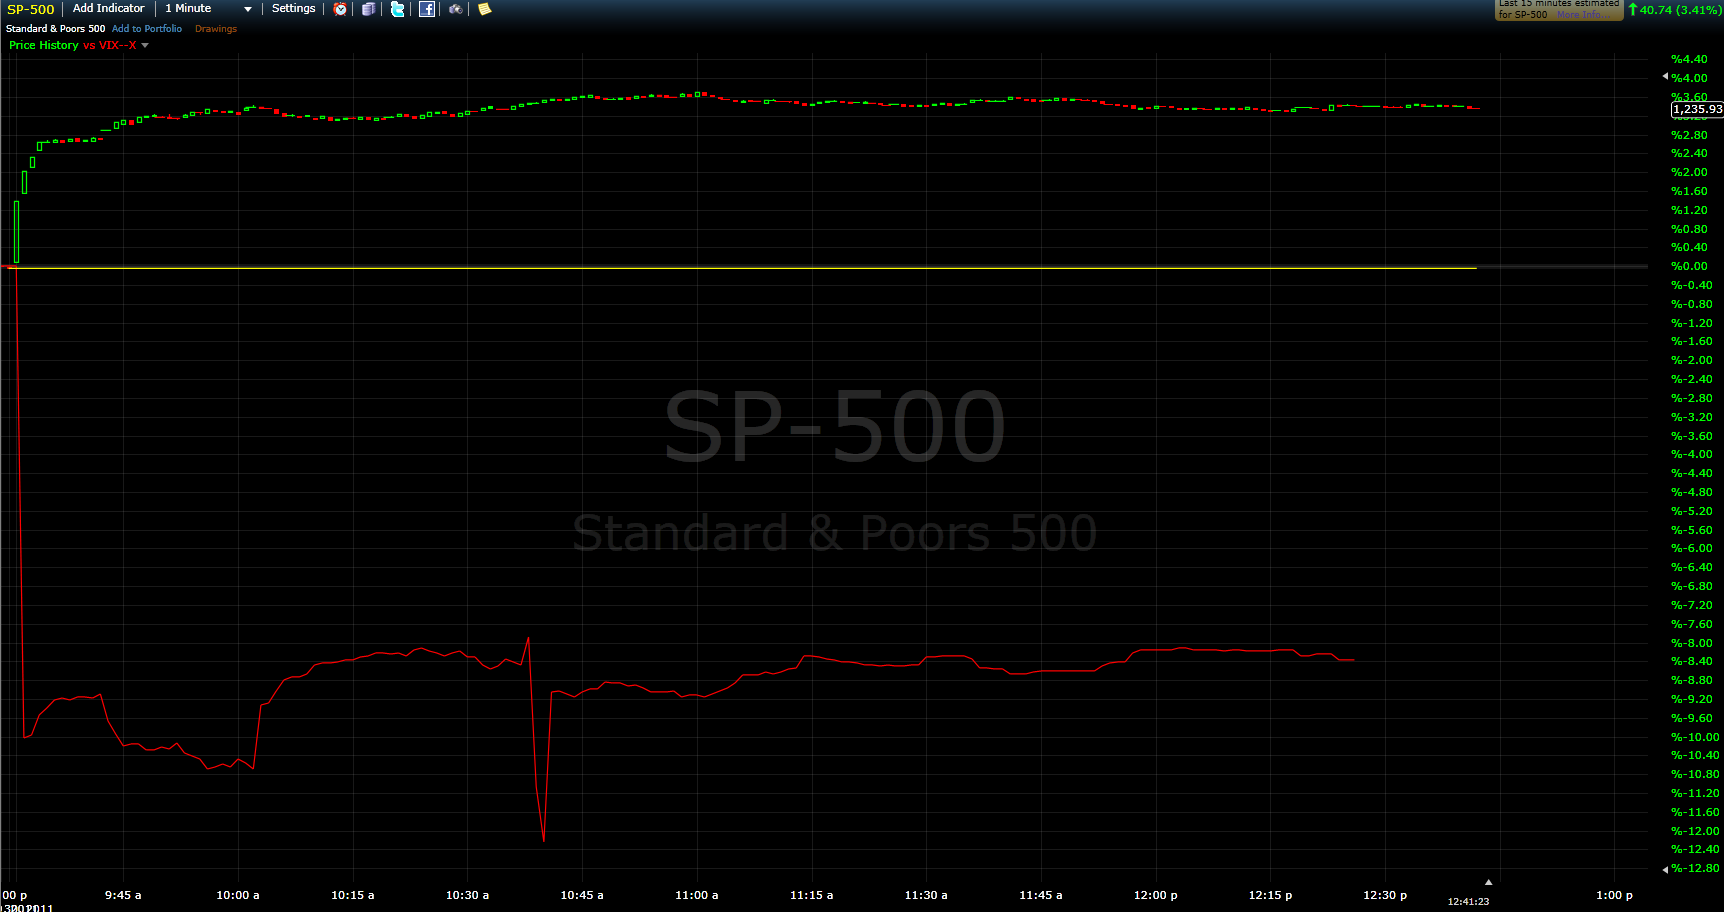
[source: FreeStockCharts.com]

Disclosure(s): none

Monday, November 21, 2011

Slicing and Dicing All 31 Flavors of the VIX ETPs

Ten months have passed since the last time I attempted to graphically depict all the VIX-based exchange-traded products. At that time there were 16 such securities; now that number has swelled to 31 and two have closed their doors (IVO and VZZ) along the way.

The graphic below attempts to map the herd onto an x-axis for target duration and a y-axis for leverage. In addition to these important criteria, I have also further delineated the group by identifying the four ProShares ETFs in black (the balance are all ETNs), highlighting the five optionable ETPs with a red O preceding their ticker and flagging the two VIX ETPs that have some non-VIX components (in the form of the S&P 500 index) with a black triangle. For good measure I have identified the issuer with a parenthetical one letter abbreviation (Barclays,VelocityShares, ProShares and UBS).

It is worth noting that earlier in the month S&P and VelocityShares announced several new VIX futures strategy indices that hint at future VIX ETPs, all of which will include both a long leg and a short (inverse) leg.

The VIX ETP space is already an exciting one, with over $2.1 billion in assets and daily volume of over 45 million shares per day. As exciting as 2011 has been in this space, things look to be heating up even more in 2012.

Related posts:


Disclosure(s):
none

Friday, November 18, 2011

Interview at OptionPundit

Earlier this week, OptionPundit published the transcript of a recent interview: Bill Luby Talks to OptionPundit.

The interview touches on a wide range of subject, but with an emphasis on the VIX and VIX-based ETPs, such as VXX, VXZ, XVIX. As always, VIX futures and the VIX futures term structure are a critical part of this discussion.

Related posts:

Disclosure(s): long VXZ and short VXX at time of writing

Friday, November 4, 2011

VIX Futures: A Tale of Two Backwardations

After yesterday’s New VIX Backwardation Record post, I thought it might be interesting to compare the VIX futures term structure during the past three months to that of the prior record, which spanned September to December 2008.

The mechanics for graphing VIX futures over time are fairly complicated, as not only do values change daily, but on any day there can be up to ten futures contracts traded, with the front seven months generally being the only actively traded contracts. Of course, the futures roll every month, so the result is a rolling and scrolling array of data.  My efforts at oversimplifying this problem for the purposes of comparing the record 2011 backwardation data and the prior record data from 2008 resulted in the graphic below, which shows the average front month, second month, etc. values for the VIX futures all the way out to the seventh month.  Note the relatively mild in backwardation in 2011 compared to the steep backwardation in 2008. In fact, the 2011 curve is essentially flat from the third month through the seventh month, while the 2008 curve slopes down throughout the entire term structure.

Clearly some of the differences between the shape of the term structure in 2011 vs. 2008 can be attributed to the absolute level of the VIX and the fact that mean reversion expectations were therefore much higher in 2008 than during the past few months.

Students of the VIX may find it interesting that the front two months of the VIX futures briefly reverted to contango in the middle of December of 2008, while both the VIX and the front month VIX futures were still above the 55.00 level.

As it turns out, the VIX futures during late 2008 greatly overestimated the level of the VIX during the first half of 2009. It will be interesting to see if the same can be said for the first half of 2012.

Related posts:

[sources: CBOE Futures Exchange, Interactive Brokers]

Disclosure(s): short VIX at time of writing

Thursday, November 3, 2011

New VIX Backwardation Record

This week marks the first time that the front two months of the VIX futures term structure have been in backwardation each day for more than three consecutive months. In fact, the current streak of 68 days eclipses the old record of 63 days that dates to the 2008 financial crisis.

While the backwardation streak is intact for the front two months, when looking at the full VIX futures term structure, the futures curve has reverted to contango five times over the course of the past three weeks. The primary reason that the front two months have remained in backwardation in defiance of the rest of the VIX futures term structure has to do with something I call the “holiday effect” or “calendar reversion.” Essentially, what happened a little over two weeks ago was that the roll from the October front month to the November front month VIX futures, as well as from the November second month to the December second month VIX futures has added some incremental holiday effect backwardation to the front two months. This is due to the fact that the second month VIX futures have an expiration of December 21st, and these are artificially depressed due to the historically low volatility associated with the holiday season. The impact is being felt by all the short-term VIX futures ETPs that are buying second month (December) VIX futures at artificially depressed levels and selling front month (November) VIX futures as part of the daily rebalancing process.

The graphic below shows the 1.70 point differential between the front month and second month VIX futures. Note that it is not until February 2012 that the term structure starts to flatten out, as investors begin to converge on the idea that the VIX is likely to hug the 30 level for the better part of the first half of next year.

Related posts:

[source: Interactive Brokers]

Disclosure(s): short VIX at time of writing

DISCLAIMER: "VIX®" is a trademark of Chicago Board Options Exchange, Incorporated. Chicago Board Options Exchange, Incorporated is not affiliated with this website or this website's owner's or operators. CBOE assumes no responsibility for the accuracy or completeness or any other aspect of any content posted on this website by its operator or any third party. All content on this site is provided for informational and entertainment purposes only and is not intended as advice to buy or sell any securities. Stocks are difficult to trade; options are even harder. When it comes to VIX derivatives, don't fall into the trap of thinking that just because you can ride a horse, you can ride an alligator. Please do your own homework and accept full responsibility for any investment decisions you make. No content on this site can be used for commercial purposes without the prior written permission of the author. Copyright © 2007-2023 Bill Luby. All rights reserved.
 
Web Analytics