VIX Term Structure Changes Since November 20th
The VIX term structure is a series of calculations of implied volatility on SPX options stretching out months and years into the future. The terms structure highlights how future expectations of volatility in the SPX as derived from IV data reflect changing expectations about how volatility will evolve over time.
The concept is best illustrated with an example.
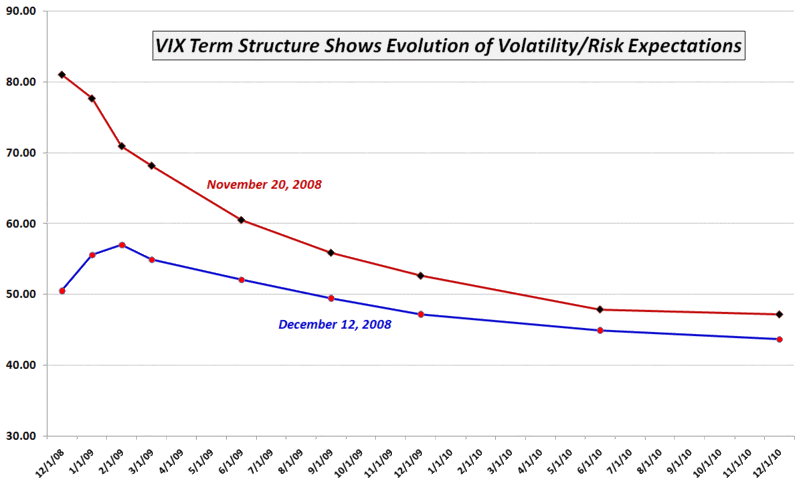
In the chart below, I have plotted the VIX term structure from November 20, 2008 and again at the close on last Friday, December 12. November 20th marks the high water mark for the term structure, when implied volatility for the SPX options closed at their highest levels of the year. The current data shows how implied volatility has fallen dramatically in the front months and incrementally in the second half of 2009 and beyond.
At this stage, market participants are anticipating market volatility will peak in February at about 57, then gradually decline to a level in the 43-44 range by the end of 2010. In contrast, back in November, traders were of the opinion that SPX implied volatility (the VIX) was extremely extended and would mean-revert rapidly, as has been the case.
One way to think about the difference between the November 20th term structure and the December 12th term structure is that the change represents the amount of volatility, risk or uncertainty that has been removed from the S&P 500 index during the course of a little over three weeks.

[source: CBOE]


5 comments:
I use an interesting indicator that measures the slope of the term structure over the next three expirations. A negative reading means present fear is greater than the future. It has been negative since Sep 9th, (lowest point was Oct 27th) but now is almost positive.
Anonymous, where do we find the indicator you are speaking of? Thanks
Morning: It's my own indicator, but it's fairly simple to make. I use a linear least squares analysis on the closing current and later vix futures prices.
an easy way to look at the vix term structure is to view the relationship of the vix to vxv which is the 3 month vol for the spx. i follow the relationship to find extremes in the ratio that would signify extreme fear as the spot vix is bid up rapidly due to "freaking out". infact, the ratio did not confirm the second top on the vix at the november low. any thoughts, i would be interested in any feedback.
I am not sure whether the "business day" convention is used in calculating VIX term structure data, which is available in the website? I guess it uses calenday days, since the end of the VIX term structure white paper says "In the coming months,..., based entirely on calender days,...." Thanks! by Camel
Post a Comment