VIX Holiday Crush
The VIX has been steadily declining during the month of December, from the high 60s on the first day of the month to the neighborhood of 42 as I write this.
Clearly the extraordinary measures taken by the government to pump liquidity into the system have been responsible for some of the shrinking volatility, but since I often talk about the holiday effect on volatility and frequently receive questions on the subject, I thought it would be a good day to share some of my research on the subject.
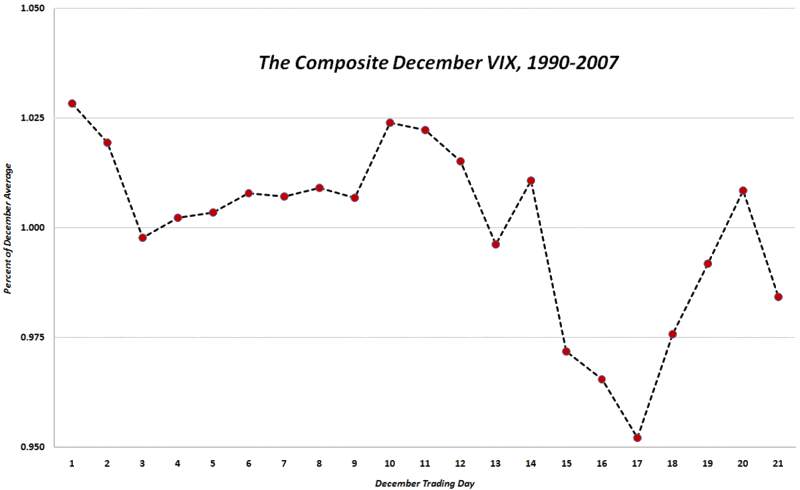
Since 1990, the month of December has averaged 21.05 trading days. The chart below captures each of those 21 trading days from 1990-2007 in composite form, with the mean for all December VIX values set at 100. In the chart, the pattern of decreasing volatility is most evident from the middle of the month to just before Christmas, during which period volatility drops from 2.4% above the December average (10th trading day) to 4.8% below the December average (17th trading day).
For the record, today is the 17th trading day of December, which makes the the historical low point in volatility for December.
I will not go so far as to say the that calendar suggests today is likely to be the last time the VIX dips under 42 for awhile, but those with an interest in historical context may wish to prepare for an increase in volatility, as the holiday ‘calendar reversion’ effect wears off.

[source: VIX and More]


5 comments:
Bill, thanks for this. Very interesting. Perhaps we should be working with seasonally adjusted VIX figures. Are there other points in the year when the seasonality is significant?
My impression, without having done the arithmetic, is that the fall off in the implied volatility figures in the last few days has been much greater than this seasonality suggests.
This drop in IV while the markets are also dropping back is something I am finding quite interesting. I see it as bearish but have not found the time to look back at old data yet.
I did read - was it you or Quantitative Edge? - that the VIX and the market moving in the same direction is bearish.
Before this VIX / VXO fall I was expecting a huge bear market rally. Now I'm not so sure...
VIX/VXV had a crossover since last friday although VIX was falling. now VIX spread all the way to 75. i guess first half of jan is gonna be bad...
Hi Douglas,
Good stuff, once again.
Interesting point about a seasonally adjusted VIX. I have thought about it, but am not sure we really need it. I will post something about this after the first of the year. There is an annual pattern to much of the VIX data, with volatility generally lowest in June and highest in September.
Regarding correlations and divergences between VIX and SPX, I posted about this recently in Performance Implications of VIX and SPX Divergences
I too was looking for a nice rally and am now more neutral about stocks, and turning bearish quickly.
Stonebat,
I hope, for the sake of the economy, that things don't play out the way you suggest, but the bears are starting to make their presence felt once again...
This is really an awesome blog ! I have to go with you on leaning bearish here, I view the market decline with the decline in volatility as the excpexctation that the lack of volatility will persist. And even through the end of the year. I am a huge fan of bear call spreads here. If we could bounce more i would be willing to go short stock as well. I am looking forward to seeing the release of the commercial hedger and small spec data in the vix futures to see if there is an increase in the short positions in the reduction in volatility.
The seasonal data you have referenced for the VIX goes back to 1990. Now in my opinion, that’s just not enough time for this market. Most of the traders are pretty much referencing the 1929-1933 era as a refection of the present market for which I agree. So in reality, we would need to look at the action for the VIX back in 29-33, which I believe is not available. As we are really in un-chartered waters due to the lack of hard core technical data going back to the 29-33 era, I would not lean to hard on the ‘seasonal data’ for the VIX, as it may be hazardous to your health. As a further clarification, I believe were just working through a Bear market rally at present. As to how long this goes on is anyone’s guess. Again, using the VIX seasonal data to time the end of this Bear rally is just too dangerous my opinion.
Post a Comment