VXO Chart from 1987-1988 and Explanation of VIX vs. VXO
In the past, I have gone to some length to differentiate between the VIX and the VXO, but given all the confusion I have seen in the media over new VIX records, I think it is time to offer up some history that may help clarify the situation.
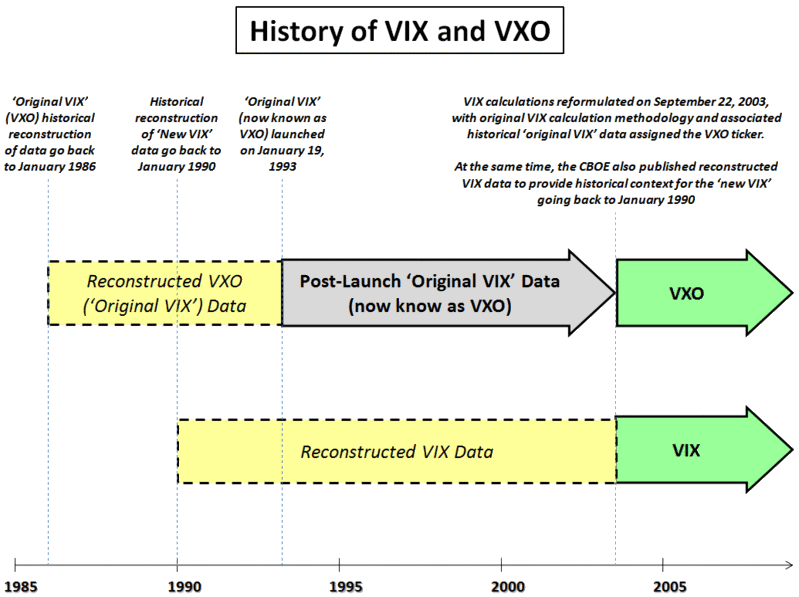
A good place to start, frankly, is with a prior post that I titled Ten Things Everyone Should Know About the VIX. For the visual learners out there, I have reduced the history of the VIX and the VXO to a graphical timeline below. Here are some of the important facts in a nutshell:
- The VIX was launched in 1993
- In September 2003 the formula used to calculate the VIX was modified substantially
- Data from the new 2003 VIX formula has been assigned the VIX ticker, but the CBOE published a reconstruction of historical data for the new VIX formulation going back to 1990
- At the same time, the data (both historical and subsequent) associated with the ‘original VIX’ formula was assigned a new VXO ticker
The result is that for all practical purposes when you or your data provider refer to the VIX, this means the new 2003 VIX calculation and the historical reconstruction of the data for the new VIX formula. Similarly, the VXO ticker refers to VXO data from 2003 to the present, ‘original VIX’ data from 1993 to 2003, and a historical reconstruction of ‘original VIX’ data that goes back to 1986.

[source: VIX and More]
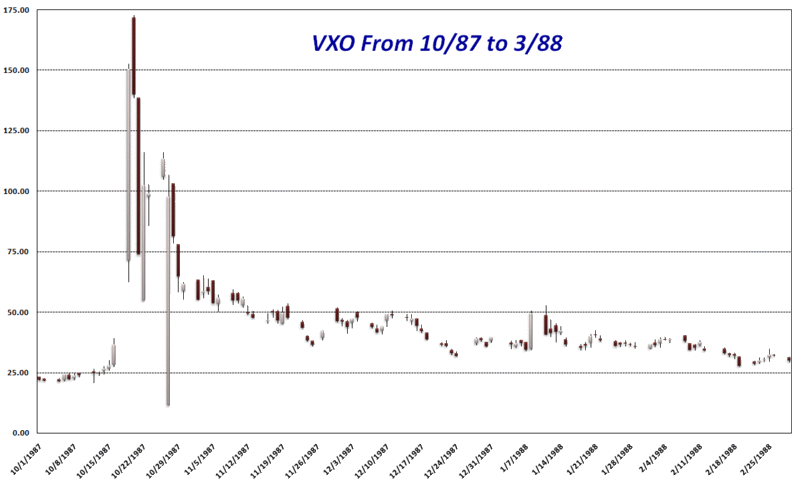
So, in terms of record-keeping, there was no VIX or VXO in 1987, but a historical reconstruction of the VXO arrives at an intra-day high of 152.48 and closing value of 150.19 for Black Monday, October 19, 1987 as well as an all-time high intra-day VXO of 172.79 for October 20, 1987. The chart below details the action in the historical reconstruction of the VXO for the period from October 1987 to March 1988, when the VXO finally slid back below 30.

[source: Yahoo, VIX and More]


2 comments:
Thanks for this article! It provides a nice recap of VIX and its history.
By the way, you have a very nice blog! I came across it last week while reading up on potential uses of volatility as an asset class. I've been reading all I can to better understand VIX.
Thanks again!
Great insights into volatility indices and how they impact the markets! It’s interesting how global investment trends vary. Speaking of investments, if you're exploring real estate, finding the
Best Apartments in Noidacan be a great option for a stable and lucrative investment!
Post a Comment