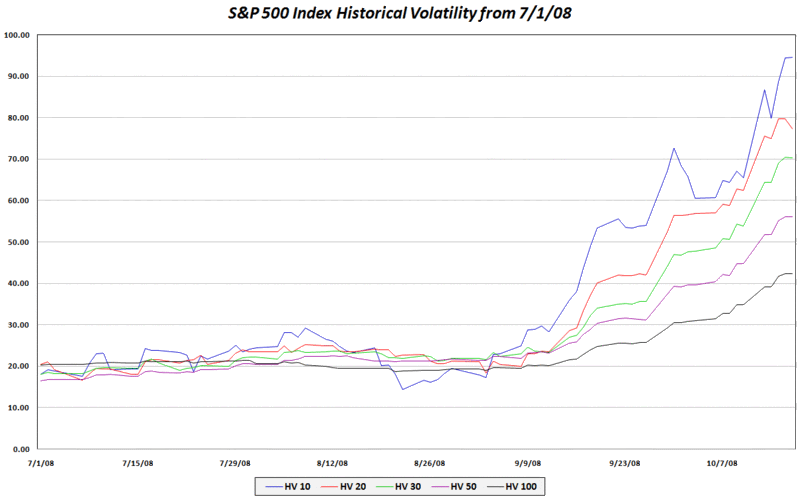
SPX Historical Volatility Snapshot
Adam at Daily Options Report had a post up over the weekend in which he explained why he has lately preferred 10 day historical volatility to 30 day volatility.
Given that I track a lot of historical volatility data, I thought it might be interesting to post a graphic showing historical volatility as calculated (essentially as the standard deviation of the log of returns) over a variety of rolling lookback periods ranging from 10-100 days. The results show a steady increase in historical volatility over the course of the past two months that is unprecedented during the course of the past two decades. Even in 1987, volatility did not continue to rise for such a long period.
With the VIX near 70 at I type this, it is tracking most closely to the 30 day historical volatility at the moment. Going forward, I will have much more to say about historical volatility, implied volatility, and the interplay between these two measures.

[source: VIX and More]


4 comments:
I'm curious if you could comment on the other type of historical volatility...sorry I forget what it's called.
It had to do with the high/low of the day as well if I remember correctly. The intraday swings are even crazier than the closing price swings.
Hi Mikkel,
You are probably talking about Average True Range (ATR), which accounts not only for the intra-day trading range, but overnight gaps as well.
In short, ATR is at even more extreme levels than historical volatility or the VIX.
You can see the posts I have attached the ATR tag to at: Average True Range posts.
Cheers,
-Bill
Thanks Bill. I was just thinking that there is probably an expected return difference for traders when ATR and VIX diverge. This is because of risk loss management strategies.
As your next post shows the VIX relatively tracks 30-day HV. To me this means that there may be price inefficiencies because the option volatility isn't reflecting intraday swings. Does that make sense?
I'm not sure if it's up your alley or not, but it is a possible confounding variable when trying to predict future performance.
Mikkel,
The relationship between backward looking volatility measures such as HV and ATR and forward looking volatility derived from options prices (implied volatility, VIX, etc.) is a complicated one.
First, backward looking measures typically have a rolling moving average component that introduces a time lag and thus doesn't always reflect current volatility. HV/ATR are blind to market moving geopolitical events, economic data releases, key earnings, and whatever other events are scheduled or anticipated.
IV/VIX measures do a better job of capturing the emotion that is layered onto any mathematical calculations of volatility and of reflecting the impact on volatility of coming events. To your point, however, IV is blind to historical volatility (in theory, at least), as no historical data is used in calculating IV.
I had promised a series on HV and IV before all the recent craziness took hold and when things calm down a little I'll take up the subject at some length.
Cheers,
-Bill
Post a Comment