Friday, December 31, 2010

In 2010 I Learned That…

Josh Brown of The Reformed Broker has an excellent post up today, In 2010 I Learned That…, in which he aggregates a wide variety of market perspectives from his broad network. The results have a large dollop of market wisdom, yet are spiced with the type of humor and satire that is a hallmark of Josh’s efforts.

When asked for some input about what I learned in 2010, my immediate reaction what that I hadn't learned as much in 2010 as I had in 2009 and 2008. After a moment of reflection, five ideas tumbled out of my head, in the following order:

  1. Substantial profits can be made from surfing the bleeding edge of Wall Street's product development engine (this is the one Josh chose to include in his post)
  2. The more confident you are in the value of your primary strategies, the more difficult it is (should be) to pull the trigger on other strategies/trades with less impressive or uncertain prospects
  3. There is a huge desire for investors to understand the VIX futures term structure and its implications
  4. When you combine ETFs and options, almost any possible trade idea can be implemented
  5. A good portfolio is one that funds a good vacation without the need for frequent monitoring of positions (my wife’s favorite of this group)
[As an aside, while Josh has a penchant for nailing the humorous side of the investment world, his On a Personal Note… from yesterday shows his talent for writing about the poignant as well.]

Readers, what have you learned in 2010? Feel free to hit up the comments…

Related posts:
Disclosure(s): none

Thursday, December 30, 2010

Top Posts of 2010

It is hard to believe that I have been blogging for four years. Initially I just thought I’d take a couple of minutes during the slow period of the trading day to capture a thought or two for archival purposes, but that original intent has continued to morph into something far beyond what I imagined.

These days most of what I post is for the benefit of readers rather than to aid my personal recollection, but I like to keep things eclectic, provocative and visually interesting for the benefit of all.

The end of the year is a great time to reflect on what readers have found to be of interest at VIX and More. Each year new themes seem to emerge among the top 25 most read posts in this space. This year the dominant themes seem to incorporate the VIX-based ETNs (specifically VXX), contango, the VIX futures term structure and put to call ratios. The #1 post of the year, The Education of a Trader, is one of the few times I have talked about my own trading, but I imagine it is the universality of the message that struck a chord with most readers.

[I hope it goes without saying that clicking on any of the hyperlinks above will pop up a list of all posts I have tagged with that label.]

Thanks to all who have contributed in one way or another to the content here. I like to say that not every day shows a profit, but every day should make you smarter, which will help the bottom line in the days and weeks ahead.

  1. The Education of a Trader
  2. Chart of the Week: VXX vs. VIX
  3. Chart of the Week: CBOE Equity Put to Call Ratio Nears All-Time Low
  4. Rule of 16 and VIX of 40
  5. VIX Futures Contango Soars
  6. Chart of the Week: VXX Celebrates One Year of Futility
  7. Short-Term and Long-Term Implications of the 30% VIX Spike
  8. VIX Futures Contango Bubble
  9. Largest Pullback Since March 2009 Rally Began
  10. Chart of the Week: Total Put to Call Ratio
  11. Yesterday’s Unusually Low ISEE Equity Call to Put Ratio
  12. VXX 1-4 Reverse Split Reminder, After Today’s Close
  13. Chart of the Week: Ten-Year Treasury Note Yield
  14. Charting the Selloff with an Andrews Pitchfork
  15. Direxion and S&P Bring Dynamic Volatility Hedging to ETFs with VEQTOR
  16. VIX Approaches Pre-2008 Record Highs
  17. SPX Pullback Now Second Largest Since March 2009
  18. XXV and the New VIX ETN Landscape
  19. Some Favorite ETF Sites
  20. SPX Historical Volatility at Two Year Low
  21. Chart of the Week: The Flight-to-Safety Trade
  22. Mamis Overbought-Oversold Indicator
  23. VIX Futures: What Were/Are They Thinking?
  24. Bears Emboldened By Low CBOE Equity Put to Call Ratio
  25. Technical Resistance Looms in the S&P 500 Index
For more on related subjects, readers are encouraged to visit the posts tagged with the label archival or check out:
Finally, I have tagged a select group of posts (including six from 2010) as worthy of a somewhat arbitrary “hall of fame” designation. These are all posts in which, regardless of popularity, I believe the content reflects some of the best efforts on this site.

Disclosure(s): short VXX at time of writing

Wednesday, December 29, 2010

VIX Futures Brokers

In light of my comments about MB Trading yesterday, a reader was quick to point out that MB Trading does not offer VIX futures.

For those who may be interested, the CBOE Futures Exchange (CFE) maintains a current list of VIX futures brokers which I have reproduced below:

Futures Commission Merchants (FCMs)

Introducing Brokers (IBs)

Clearing Firms

  • Advantage Futures
  • Bank of America
  • Barclays Capital Inc.
  • BNP Paribas
  • Citigroup Global Markets Inc.
  • Credit Suisse
  • Deutsche Bank
  • Electronic Brokerage Systems LLC
  • Fimat
  • Fortis Clearing LLC
  • Goldman Sachs Global Clearing & Execution
  • Interactive Brokers
  • J.P. Morgan Futures Ltd.
  • Man Financial
  • Merrill Lynch Pierce Fenner & Smith
  • Morgan Stanley & Co. Ltd.
  • Newedge USA LLC
  • Nomura Securities
  • O'Connor & Co. LLC
  • Pax Clearing
  • Prudential Bache Commodities, LLC
  • RBC Capital Markets
  • Timber Hill
  • Tradelink
  • UBS Securities Ltd.
  • Vision Financial Markets

For those who have been drawn into the world of VIX futures as a result of the growth of VIX-based ETNs, perhaps 2011 will be the year to trade VIX futures directly, rather than through various exchange-traded products.

Related posts:

[source: CBOE Futures Exchange (CFE)]

Disclosure(s): the CBOE is an advertiser on VIX and More

Tuesday, December 28, 2010

MB Trading Actively Screening New Customers?

I do my best to maintain accounts with a wide variety of brokers, particularly with those who are partial to options traders, in an effort to get a sense of how various tools and platforms are evolving at the broker level, keep up to date on educational offerings, etc.

In the last year or two, I have opened new accounts at tradeMONSTER and OptionsHouse and have had very positive experiences with both brokers. One broker that I have been meaning to try for awhile is MB Trading, which has been a top performer in the Barron’s online broker rankings (with additional details here) for the past few years.

Much to my surprise, when I heard back from MB Trading today it was to request more details related to my employment and the like. Keeping in mind that any broker new account application for options and futures trading has a comprehensive list of questions related to employment, assets, trading experience, etc., but for the first time out of perhaps 15-20 new account applications I discovered a broker that was intent on conducting additional due diligence over and above what is covered by the standard application. I have to assume this development is specific to MB Trading and I applaud this effort. It is always nice to know that a place where I put my money uses some discretion in the money they accept from others.
 
[Note that Theresa Carey, who authored the Barron’s online broker rankings, also maintains an excellent blog, Investor Brain, where she discusses the latest developments in the online broker space, in terms of functionality and features, as well as industry-level issues.]

Related posts:

Disclosure(s): none

Monday, December 27, 2010

Chart of the Week: U.S. Retail Gasoline Prices

As more and more data points begin to suggest that the green shoots of months past are finally showing signs of developing, concerns about supply and demand in the energy space are starting to heat up again.

In the past week, the average retail price of gasoline in the United States shot up to $2.98 per gallon (and $3.29 per gallon in my home town of San Francisco, but who’s counting?) to a post-crisis high.

This week’s chart of the week shows 21 years of retail gasoline prices in the U.S. (blue line) plotted against a backdrop of the S&P 500 index (gray area chart.) Note that gasoline prices peaked in July 2008 at $4.11 per gallon and fell all the way to $1.61 per gallon by the end of the year, less than six months later.

Not surprisingly, gasoline prices peaked after stocks did and followed stocks down during the financial panic. Interestingly, gasoline actually bottomed about 2 ½ months before stocks and the two have been tracing a very similar pattern back up toward previous highs during the course of the past two years.

Going forward, continued increases in gasoline prices should begin to put pressure on consumer spending and slow down economic growth and the rebound in stocks. Whether this phenomenon begins to show up just on the other side of $3.00 per gallon or at much higher levels remains to be seen, but it is an important factor in the ability of consumers to repair their balance sheet, increase their spending, and power the 70% of the GDP that relies on consumer spending to drive growth.

Related posts:


[source: Energy Information Administration]

Disclosure(s): none

Wednesday, December 22, 2010

VIX and the Week Before Christmas

I guess I should not be surprised that a VIX of 15.45 – the lowest since July 2007 – has all manner of pundits scrambling to pull some sort of explanation out of a hat and weave it into their favorite bullish or bearish forecast for the markets.

In fact, the new low in the VIX is not a big deal, at least during this time of the year. I have talked about this before on a number of occasions, including in VIX Holiday Crush and earlier this week in Chart of the Week: Historical Volatility Plummets in Seasonal Swoon. Call it the holiday effect or calendar reversion, but when the VIX’s 30-day window includes two holidays and two additional historically slow days in advance of the Christmas and New Year’s holidays, volatility has a tendency to take a vacation.

How strong is the tendency toward a low VIX? Well, consider that in five of the last eight years, the annual low in the VIX fell during the week leading up to Christmas. Last year, some may recall that the VIX made its annual low on Christmas Eve. Back in 2004, the VIX had its low for the year on December 23rd; and in both 2003 and 2006, the VIX bottomed out for the year on December 18th. Today’s low makes it five pre-Christmas bottoms in eight years.

So keep a close eye on the VIX and feel free to marvel at how low it goes, but consider that during the holiday season, experienced investors will give very little credence to the absolute level of expected 30-day implied volatility in S&P 500 options. Only after the first of the year should we take the VIX numbers seriously, regardless of how low prices and implied volatility levels may be marked down in the pre-Christmas shopping rush.

Related posts:

Disclosure(s): none

Tuesday, December 21, 2010

Expiring Monthly December 2010 Issue Recap

A reminder that the December issue of Expiring Monthly: The Option Traders Journal was published yesterday and is available for subscribers to download.

This month’s issue has a feature article from Mark Sebastian on the future of options exchanges. On a related subject, Mark Longo interviews Gary Katz, President and CEO of the International Securities Exchange (ISE).  Additional subjects covered in the magazine include how market makers use volatility to update their quotes, delta hedging, analyzing opening gap tendencies, payment for order flow, directional vs. non-directional strategies, the role of luck and skill in trading, and a review of Ron Ianieri’s recent options book.

I contribute two articles to the December issue. Unintentionally blurring zoomorphism with mythology, one article is based on a trade I call “the Minotaur” while the other has earned the name of “the Swan Catcher.” The Minotaur turns out to be a VIX-VXX pairs trade and here I embark on a proof-of-concept approach. The Swan Catcher trade also represents something of a bottoms-up approach to developing options strategies. In part one of a two-part series, I seek a way to structure options positions to profit from extreme moves in the market, without losing too much money while one waits for these events to occur.

As is now my habit, I have reproduced a copy of the Table of Contents for the December issue below for those who may be interested in learning more about the magazine. Thanks to all who have already subscribed. For those who are interested in subscription information and additional details about the magazine, you can find all that and more at http://www.expiringmonthly.com/.

Related posts:


[source: Expiring Monthly]

Disclosure(s): I am one of the founders and owners of Expiring Monthly

Monday, December 20, 2010

Chart of the Week: Historical Volatility Plummets in Seasonal Swoon

‘Tis the season for the annual holiday effect in which historical volatility (HV) has a strong tendency to plunge and drag implied volatility down with it. This is a subject I have tackled on a number of occasions in the past (see links below) and is really just a longer variant of what I call calendar reversion – the tendency of the VIX to fall an extra 1% or so on Fridays due to market makers adjusting prices ahead of the weekend. The lack of volatility all boils down to the same root cause: fewer trading days during the 30 calendar day window specified by the VIX (and implied volatility in general) means there are fewer opportunity for stocks to stray significantly from the path projected by efficient markets, standard deviations and the rest of the normalcy regime.

As of Friday’s close the S&P 500 index had a 10-day historical volatility of 5.5, which is the lowest reading since May 2007. In this week’s chart of the week below, I have elected to show the 10-day historical volatility of the Russell 2000 small cap index (RUT), which traditionally has higher volatility than the SPX and is also more susceptible to the winds of economic change and uncertainty. As the chart shows, 10-day historical volatility (white line) sits at a two-year low and has helped to pull the implied volatility (red line) of the index down below 20. Note that last week the CBOE Russell 2000 Volatility Index (RVX) dipped as low as 19.55 and is threatening to drop below the 19.00 level for the first time since June 2007.

After the first of the year I expect to see the holiday effect magically disappear and HV, IV and volatility indices begin to reflect a more accurate view of investor expectations.

Related posts:


[source: Livevol.com]

Disclosure(s): Livevol is an advertiser on VIX and More

Friday, December 17, 2010

VIX and More and the 2011 Bespoke Roundtable

For the second year in a row, I have elected to stick my neck out and make my best guess at what the investment world will look like in the coming year in conjunction with the Bespoke Investment Group’s second annual roundtable.

As someone who has a tendency to focus almost all of my predictive powers on the next two options expiration cycles, I find that forcing myself to think in terms of a one year time horizon is a daunting task. Still, just going through the process and committing some ideas to paper makes this exercise worthwhile and fun.

Frankly, I was surprised by how accurate many of my predictions from last year turned out to be and for better or (more likely) for worse, this has emboldened me to be even more provocative and more specific this year, including some outrageous comments about AAPL.

More to the main theme of this blog, I think readers may find the following predictions for 2011 to be of interest:

2011 will mark the rise of volatility as an asset class.  Part of the reason for this rise will be the runaway success of VIX-based ETNs and ETFs, notably the recently launched XIV, which will prove that volatility vehicles can be good buy-and-hold investments.  XVIX will also prove to be a popular and successful buy-and-hold ETN and once liquidity improves, TVIX will hit a tipping point and become the darling of day traders.”
All in all, a dozen top bloggers offered up their predictions for 2011. Bespoke has assembled some of the highlights from the responses here.

Additionally, there is a to the the full text of my replies to all 34 questions about 2011 here.

For those financial anthropologists in the crowd, the highlights for the 2010 roundtable are here and my archived predictions for 2010 are here.

[12/19/10 Update:  note that there were several incorrect links to Bespoke that have since been corrected ]

Related posts:

Disclosure(s): long XIV and XVIX at time of writing

Thursday, December 16, 2010

VIX and Put to Call Ratio Snapshot

There has been a good deal of discussion about recent high put to call ratios across the blogosphere lately, including in my post yesterday, Rohan Clarke on the VIX and Put to Call Ratios.

Given all the interest in the subject, I thought it would be an opportune time to share a simple chart of both that I often refer to. The graphic below captures the VIX (solid black line) and a 10-day exponential moving average of the CBOE equity put to call ratio (CPCE), which is show as a dotted red line.

Note that these two indicators are generally highly correlated. They both hit extreme lows in April, just before stocks began to correct – hence the concern about the current situation. The recent levels mark the second lowest readings of the year and may also portend a reversal. It is important to note, however, that the VIX can remain low for an extended period and also indicate nothing more than the fact that investors are comfortable accepting more risk. Also, the 10-day EMA of the CPCE is showing some signs that the recent extreme reading may self-correct before the bears are able to generate any significant traction. Finally, seasonal factors have a tendency to distort both indicators and often point to short-term holiday complacency rather than any sort of conviction that is expected to persist into 2011.

Related posts:


Disclosure(s):
none

[source: StockCharts.com]

Wednesday, December 15, 2010

Rohan Clarke on the VIX and Put to Call Ratios

With the favorable response I received on two recent posts, Edward Hugh and a Fistful of Euros and Market Psych Offers Language-Based Fear Index, I thought it might be a good time to highlight the work of another blogger who I believe deserves a wider audience and whose content nicely complements what readers can find here.

The blogger is Rohan Clarke and his blog is known as Data Diary and also carries the tag line, “An investor’s diary of economic data, corporate earnings and market sentiment.” While Clarke is based in Australia, his posts betray a broad range of geographical and intellectual interests. His latest missive, from earlier today, Betting on Zero, tackles inexpensive portfolio hedges, the VIX and put to call ratios.

For another insightful blog from Down Under, readers might also wish to check out billy blog, where I can guarantee that Bill Mitchell’s take on the global economy and economic issues in Australia will give you something to think about, whether you agree with his perspective or not.

Related posts:


Disclosure(s): none

Tuesday, December 14, 2010

Treasury Yield Curve ETNs and Volatility

The subject of the VIX and Treasury yields is one I have probably not explored in sufficient detail in this space, so with some recent developments, this seems like a good time to dive into that subject.

One big reason for my interest is the recent rapid steepening of the Treasury yield curve. Another is an excellent article on two yield curve ETN plays from Timothy Strauts of Morningstar: How to Take Advantage of a Steep Yield Curve. In the article, Strauts discusses two ETNs from iPath that are designed to take advantage of a yield curve that becomes steeper or flatter. The ETNs are known formally as the iPath US Treasury Steepener ETN (STPP) and the iPath US Treasury Flattener ETN (FLAT). These innovative and exciting ETNs hold 2-year and 10-year Treasury futures and are rebalanced monthly. In many respects they represent the latest generation of what I refer to as strategy-in-a-box ETPs.

Launched in August, STPP and FLAT have started to attract some attention in the last few weeks, as Treasury yields have become more volatile.

There is not yet much of a track record, but I will be interested to see how the movements in STPP and FLAT interact with movements in the VIX. For an initial pass, I have chosen to look at STPP and FLAT in conjunction with SPY and VXZ. (Note that I chose VXZ here in order to sidestep the strong contango in the VIX futures term structure that exacerbated the price decline in VXX as of late.)

The chart below shows the performance of the yield curve ETNs since their August 10th launch. Note that so far – and particularly as of late – it has been FLAT which has been more positively correlated with changes in implied volatility expectations as measured by VXZ. On the flip side, STPP has demonstrated a higher positive correlation with stocks, at least as reflected in SPY.

Going forward, I will provide periodic updates on my observations between changes in the Treasury yield curve in the VIX and also take up the subject of how the Treasury yield curve might be able to predict the future of the VIX.

Related posts:


[source: ETFreplay.com]

Disclosure(s):
short VXX at time of writing

Monday, December 13, 2010

Chart of the Week: Banks on a Tear

There were many cross-currents in the financial markets during the last week, but one of the dominant themes was the spike in Treasury yields. As expectations for interest rates move higher, the banks are also catching a bid. Long able to borrow at Bernanke-induced artificially low rates, now banks are finding better prospects on the lending side – and have the added bonus of a larger yield spread on their loans as interest rates start to climb.

These factors make banks the focal point of this week’s chart of the week. In the graphic below, note that the upper study shows banks have been consistently underperforming the S&P 500 index for the past seven months. In the last week, however, banks have shown a dramatic turnaround that has lifted KBE, the popular bank ETF, above resistance (dotted blue line) and also reversed the trend of outperforming the broader market.

As was the case in 2010, the performance of the banks will be a critical factor in the performance of the broader market in 2011. Said another way, banks will continue to be a critical barometer not just of global growth, but of the ability of various economies to deal with threats to growth, such as sovereign debt and other issues.

Related posts:


[source: StockCharts.com]

Disclosure(s): long KBE at time of writing

Thursday, December 9, 2010

VIX Futures Now Opening at 8:20 a.m. ET

Effective tomorrow, December 10th, VIX futures will be open for trading as of 8:20 a.m.

"Extended trading hours for VIX futures will give investors the ability to more efficiently mitigate risk and establish or offset positions that may be impacted by potential market-moving events such as overnight news, banking actions, or key economic reports released prior to the general market open," explained Andrew Lowenthal, Managing Director, CBOE Futures Exchange.

Of course VIX futures are the underlying security for all VIX options and exchange-traded products.

For more information, check out the CBOE Futures Exchange (CFE) press release.

Wednesday, December 8, 2010

Market Psych Offers Language-Based Fear Index

Aside from the VIX, there are quite a few fear indices out there. Just a couple of months ago, for example, I was extolling the virtues of the St. Louis Fed’s Financial Stress Index.

One of the more interesting ones that I have not seen get much in the way of media attention is the Market Psych Fear Index. This index is constructed by using a 10-day exponential moving average of the percentage of “fear” words in the U.S. financial news. In the chart below, the Market Psych Fear Index is the solid blue line and the candlesticks are the NASDAQ-100 index (QQQQ).

As the construction of this fear index is based on language in the financial media, the fear index makes it possible to compare market-based fear measures such as the VIX and other volatility indices with the degree of public concern or perhaps even fear mongering found in the media.

One would expect that the Market Psych Fear Index and stocks to generally move in opposite directions, just as is the case with the VIX and stocks. While this is the case more often than not, the chart below shows that in the last month or so, as stocks have been rising, the movements in stocks and the Market Psych Fear Index have been positively correlated. What does this mean? Perhaps all the talk of the European sovereign debt crisis and North Korean aggression is starting to wear thin. Perhaps the media is not quite able to stir up fear like it has in the past. Of course, perhaps Occam’s razor would say that investors are being naĂŻve.

In any event, VIX futures are predicting that the VIX will rise almost 50% by the middle of 2011.

At a minimum, I think the divergence between market-based and language-based fear indicators bear further watching.

Finally, the Market Psych web site has some interesting content, not the least of which is sentiment-based analysis of stocks and ETFs, but also an excellent collection of free personality tests for traders and investors.

Related posts:


[source: MarketPsych.com]

Disclosure(s): neutral position in VIX via options at time of writing

Monday, December 6, 2010

VIX Put Matrix Offers Glimpse of Expected Future

In yesterday’s, Chart of the Week: VIX Support, I made a statement that several readers have had some difficulty putting their arms around.

Specifically, I noted:

“VIX puts are extremely inexpensive right now and one can actually buy VIX puts for March, April and May of 2011 for less than half the price of what the December 2010 puts are currently being offered.”
This strange, but true phenomenon arises because of the confusion over the underlying for VIX options. At the moment VIX options expire, the underlying for the options is indeed the cash/spot VIX. Prior to expiration, however, the appropriate underlying to focus on is the VIX futures. With the VIX currently at about 18 and the VIX futures for the middle of 2011 approximately 50% higher at 27, the VIX futures term structure actually reflects a different underlying for each month of VIX options and futures.

The graphic below summarizes some of the consequences of the steep VIX futures term structure for VIX options. By means of illustration, note that the VIX December 18 puts can be bought for 0.85. The same puts in for March, April or May 2011, however, can be purchased for less than half that price, as I noted yesterday. The explanation is simple: when investors expect the VIX to be at 27, the VIX 18 puts are going to be a lot cheaper than when the VIX is at 18.

For comparison purposes, refer to a similar VIX put matrix from April 2009 that appeared in Selling VIX Puts with the Help of a VIX Put Matrix. At that time, stocks had formed a major bottom the previous month and the consensus expectation was that volatility would be on the decline. For this reason, with the VIX at 34.82, any puts that were “in the money” (in terms of the cash/spot VIX, not vis-Ă -vis the VIX futures) were more expensive the farther one goes out in time.

With VIX options, the key ingredients are almost always the VIX futures term structure and what it implies about mean reversion expectations.

Related posts:

[source: optionsXpress.com]

Disclosure(s): neutral position in VIX via options at time of writing

Sunday, December 5, 2010

Chart of the Week: VIX Support

In this week’s chart of the week, I have created a chart of the VIX going back to June 2007 which uses weekly bars to show that just about the time stocks made their 2007 pre-crisis highs, the VIX was establishing the 17-18 area (yellow bar) as a zone of support.

During the past three plus years, the VIX has frequently found support in the 17-18 zone before bouncing higher. In fact, the one time the VIX has made its most impressive break below the 17-18 zone was back in April, just before the European sovereign debt crisis hit and pushed the VIX all the way up to 48.20, which just happens to be the highest VIX level recorded outside of the financial crisis of 2008-2009.

For this reason, VIX puts are extremely inexpensive right now and one can actually buy VIX puts for March, April and May of 2011 for less than half the price of what the December 2010 puts are currently being offered.

Related posts:


[source: StockCharts.com]

Disclosure(s): neutral position in VIX via options at time of writing


Friday, December 3, 2010

Economic Data Frozen Until Next Thursday

Today’s data dump of nonfarm payrolls, the ISM non-manufacturing survey and factory orders caps a big week for economic data and since there is an unusually long stretch until the next data points are released ( next Thursday’s jobless claims), this seems like a good time to update my ongoing chart of economic data relative to expectations.

The last time I updated this chart, in late October, I observed, “There has been a noticeable uptick in positive reports since the beginning of September – one that just so happens to coincide with the upturn in stocks.” Today’s nonfarm payrolls report notwithstanding, the pattern of positive surprises has been repeated through November and into the first week of December. While employment continues to be the biggest story, the recent uptrend in the consumer and resurgence in manufacturing mitigates some of the bad news on the labor front and hints at the possibility of a job market that may show signs of improvement soon.

The other big story in this chart is that as bad as housing and the construction market seem, the data has consistently been coming in higher than the lowered consensus expectations.

Finally, it is rare that there is dearth of data in the U.S. for such an extended period of time. Among other things, this lack of new data points means that any investing trends that are currently in place will have little in the way of evidence to undermine their validity during the next week. It also means that the Fed will have little in the way of additional new information in front of them when the FOMC meets on Tuesday, December 14th.

Related posts:


Disclosure(s): none

Wednesday, December 1, 2010

Two More VIX ETNs Makes It a Baker’s Dozen

In addition to the six new VIX-based ETNs launched yesterday by VelocityShares, two new VIX-based ETNs also traded yesterday for the first time.

Barclays added VZZ to their product lineup, bringing the total number of Barclays products in the space to five. VZZ is essentially a +2x version of VXZ, with a target maturity of five months.  VZZ is the first leveraged volatility ETN from Barclays and is interesting in that the absence of a corresponding +2x VXX product suggests Barclays does not see the need for a leveraged VXX equivalent or perhaps finds the combination of leverage and high contango at the front end of the VIX futures term structure to be a daunting combination.

Elsewhere, UBS makes its entry into the VIX-based ETN fray with a huge splash. Their new product, XVIX, ups the innovation ante by combining a 100% long position in the S&P 500 VIX Mid-Term Futures Excess Return Index with a 50% short position in the S&P 500 VIX Short-Term Futures Excess Return Index. Translated into Barclays terms, this would be roughly the equivalent of two units long VXZ and one unit short VXX. Depending upon the shape of the VIX futures term structure, UBS is hoping that XVIX will benefit from contango and also get a lift from an increase in volatility. The performance of XVIX going forward will be particularly interesting to watch.

I would expect the land grab in the volatility ETP space to settle down for a little while as investors evaluate the new menu of options.  In the meantime the chart below should help.  I have grayed out those products which have been announced, but not launched.

The most difficult part may be unlearning Roman numerals in the process. I’m sure on some trading floor, however, some joker is yelling out, “I’m long 25 and 15, but short 70.”

Related posts:


Disclosure(s): short VXX at time of writing

Tuesday, November 30, 2010

Impressive Launch for Sextet of New Volatility ETNs from VelocityShares

The list of tradable VIX ETNs more than doubled today, following the successful launch of six new ETNs by VelocityShares.

Last week in VelocityShares Jumping in to the VIX ETP Space with Leveraged and Inverse Products, I mapped out the new VelocityShares ETNs against existing and announced competitive offerings in the VIX-based ETP space.

Several things struck me about today’s trading in these new issues. First, the six ETNs traded an aggregate of approximately 160,000 shares today, which is an excellent showing and indicates strong demand for volatility products, particularly when there is so much uncertainty swirling around the European sovereign debt crisis. Second, I was interested to see that the most actively traded products were the two leveraged ETNs. To my surprise TVIZ, which uses +2x leverage applied to a five month target maturity, was the volume leader (57,273 shares), edging out TVIX, which applies +2x leverage to a one month target maturity. In terms of opening day volume, the next level of interest was in the +1x (VIIX) and -1x (XIV) one month ETN, which overlap with existing Barclays products. Finally, only 100 shares were traded in the +1x (VIIZ) and -1x (ZIV) products that target a five month maturity. So, taking the liberty of jumping to conclusions based on only one day of data, investor interest in new VIX-based ETNs seems to be greatest in terms of leveraged products, then the one month maturities, with the five month maturities bringing up the rear.

Of course I expect that sophisticated investors will adjust their strategies based on the shape of the VIX futures term structure. Today the front month VIX futures closed at 2.60 points below the second month VIX futures. On the other hand, the fifth month VIX futures closed only 0.15 points below the sixth month VIX futures. To complete the daily volatility picture, today the front month and second month VIX futures rose at about twice the rate of the fifth month and six month VIX futures.

I see many opportunities here and am even toying with the idea of trading only VIX-based ETPs for the foreseeable future.

Related posts:


[graphic: Yahoo.com]

Disclosure(s): none

CVOL Steps It Up

In Citigroup Belly-Flops into the ETP Sponsor Pool, Ron Rowland had some harsh criticism for Citigroup seemingly stealth launch of the C-Tracks ETN on CVOL (CVOL) earlier this month.

I am glad to report that Citigroup now has a nifty new web site devoted to CVOL (see graphic below) that includes the prospectus, historical closing prices, a list of the factors and values that are inputs into the CVOL daily calculation (nice!) as well as a description of key risks and key terms and an attractive little charting module. In other words, Citigroup has stepped up to the plate in a big way here.

…and I’m excited that they have done so because I think CVOL has a great deal of potential. I will get into this in more detail in future posts, but essentially this ETN has chosen a much flatter part of the VIX futures term structure than VXX and is using 2x leverage to account for the fact that in the 3-4 month VIX futures maturities, volatility tends to move more gradually on a day to day basis than it does in the cash/spot VIX or in the front month VIX futures. Eventually, I think investors will warm up to this tradeoff, but until CVOL has a sufficient track record to convince some investors that in some respects CVOL has some advantages to VXX, I would expect adoption to be gradual.

So far the volume in CVOL has been low and the spreads have been very wide (often as high as 1%), but as soon as these spreads start to narrow and volume picks up, I expect to be an active trader in CVOL.

Related posts:


[graphic: Citigroup]

Disclosure(s): short VXX at time of writing

Edward Hugh and A Fistful of Euros

Ever since the European sovereign debt crisis began flaring up, I have made it a habit to read Edward Hugh’s excellent A Fistful of Euros. While The Economist and the Financial Times are two top notch resources for U.S. investors hoping to avoid an Americentric bias and incorporate a European perspective into events as they unfold across the pond, it continues to appear that ultimately the fate of the euro zone will be determined by events in Spain. Given the likely trajectory of events, I can’t think of a better time than the present to be reading what Barcelona-based economist Hugh has to say about Spain and the European financial difficulties.

For starters, check out Hugh’s last three offerings:

…then be sure to check out the archives for a comprehensive set of charts and data about the Spanish economy, more commentary, etc.

Readers, what other top European-based economics blogs should we all be reading?

Related posts:
Disclosure(s): none

Sunday, November 28, 2010

Chart of the Week: The Resurgent Consumer and Holiday Shopping

During the first half of 2010, a recovery in manufacturing helped to lift stocks. When manufacturing plateaued, stocks gave up their gains. Now it looks like manufacturing may be picking up again, but it has been consumer spending that has been responsible for much of the recent rise in equities.

There are two large ETFs devoted to retailers, XLY and XRT. While neither is a great proxy for the types of stores most likely to compete for our holiday shopping dollars, they will both pick up the major trends. I tend to have a slight preference for XRT over because XRT has more holding and these are more equally distributed. The top holding for XLY, for instance, is McDonalds (MCD).

In this week’s chart of the week below, I show the performance of XRT over the course of 2010. Note that earlier in the month XRT broke above its April high and has continued to maintain a bullish trajectory since then. Of particularly interest is the sector’s performance relative to the S&P 500 index (top study), which has been very strong since stocks began to rally in the beginning of September.

With the holiday shopping season off to a good start, XRT makes an intriguing momentum play and should be a barometer of the strength of U.S. consumer throughout the holiday season.

Related posts:


[source: StockCharts.com]

Disclosure(s): none

Wednesday, November 24, 2010

More Turkey Anyone?

It is the last week in November, so naturally all our thoughts are turning to the BCS and Turkey (TUR). Here I mean not Barclays and the bird, but the Bowl Championship Series possibilities and the emerging market.

As the chart below shows, anyone who has focused on Turkey not just as a seasonal play but a long-term holding has been nicely rewarded over the course of the past year, as Turkey has outperformed broader emerging markets ETFs like EEM by 5x. As captured in the chart, over the past month or so the performance advantage of TUR has begun to narrow. This could mean it is time to take profits and it could also spur the enterprising investor to go back for a second helping. Either way, I suggest that as 2011 approaches, investors make sure to look at emerging markets at least as a portfolio side dish, if not at a main course.

Related posts:


[source: ETFreplay.com]

Disclosure(s): long TUR at time of writing

Tuesday, November 23, 2010

Expiring Monthly November 2010 Issue Recap

A reminder that the November issue of Expiring Monthly: The Option Traders Journal was published yesterday and is available for subscribers to download.

This month’s issue has what may be my favorite feature article to date, The Volatility Risk Premium in Commodity Options, authored by Jared Woodard. If you have an interest in options on commodities, this issue has seven articles devoted to various aspects of that subject.

I have two contributions to the November issue. The first is Options Volume and Commodities ETFs, in which I discuss some of my thoughts on volume as it applies to combining market timing and options. The second piece comes from the back page column of the magazine (the same place where The Education of a Trader first appeared) and is necessarily more tangential to the options world than the other articles in the magazine. I have given this effort the title of Life Is A Call Option and will leave it at that in order to retain at least a little mystique.

I have reproduced a copy of the Table of Contents for the November issue below for those who may be interested in learning more about the magazine. Thanks to all who have already subscribed. For those who are interested in subscription information and additional details about the magazine, you can find all that and more at http://www.expiringmonthly.com/.

Related posts:


[source: Expiring Monthly]

Disclosure(s): I am one of the founders and owners of Expiring Monthly

Monday, November 22, 2010

VelocityShares Jumping in to VIX ETP Space with Leveraged and Inverse Products

Less than two weeks after I mapped out the various VIX exchange-traded products (ETNs + ETFs) in The Evolving VIX ETN Landscape, that landscape has has already changed dramatically. The first surprise was the launch of the C-Tracks ETN on CVOL (CVOL), a direct competitor to VXX, one week ago today.

The bigger change, however, is a suite of six new VIX-based ETNs on the way from VelocityShares (see filing) to be issued by Credit Suisse (hat tip to Adam Warner, who may be de-blogging for awhile, but is still tweeting his thoughts.) In the updated VIX ETP graphic below, I have coded the new VelocityShares products with a (V) suffix. In terms of covering the existing waterfront, the new VelocityShares products include VIIX and VIIZ to compete directly with VXX and VXZ, with the inverse XIV to compete against XXV.

The innovations come in the form of new leveraged ETNs as well as a new inverse ETN which targets VIX futures with a five month maturity. In the +2x space, these are TVIX (one month target maturity) and TVIZ (five month target maturity). In the inverse space, the new entry is ZIV, which has a five month target maturity.

For volatility traders, these are exciting developments. While I have no idea what the timeframe is for the launch of the new VelocityShares products, I can already envision dozens of exciting trades...which has me wondering why I am blogging about this instead of opening up a hedge fund...

Related posts:


Disclosure(s): short VXX at time of writing

Sunday, November 21, 2010

Chart of the Week: European Stocks Holding Up Well

Six months ago the European sovereign debt crisis was flaring up and my chart of the week was the Flight-to-Safety Trade.

With the joint EU-IMF bailout of Ireland unfolding over the weekend and the future of Greece and Portugal in the euro zone also being called into question over the course of the past two weeks, this seems like a good time to compare the performance of Europe against some of the other continents.

While relative performance is almost always dependent upon the date one picks as a starting point, I still think many will be surprised to see in this week’s chart of the week below that at least over the course of the past six month,s Europe (VGK) has performed on par with Latin America (ILF) and has significantly outperformed Asia (VPL) and the United States. Should Europe be able to finish the year without giving up any ground to its counterpart regional ETFs, I think the continent should be allowed to exhale and declare victory, at least for 2010.

For more on related subjects, readers are encouraged to check out:


Disclosure(s): none

[source: ETFreplay.com]

Thursday, November 18, 2010

Guest Columnist for Steven Sears at Barron’s

It may just be a coincidence, but each time I have been tapped as a guest columnist for The Striking Price on behalf of Steven Sears at Barron’s, there has been a spike in volatility just as I sit down to draft some thoughts. Perhaps Steven knows something I don’t, but if he does, he’s not telling.

Today in There’s Opportunity in Uncertainty, I build on some themes from a previous September column, Will Market Volatility Return to Crisis Levels? and discuss why I think those who have been earning a nice living by selling options steadily for the past two years or so may still be able to carry that strategy forward.

In today’s column, I also mention the sentiment cycle pioneered by Justin Mamis in The Nature of Risk. As that graphic has never appeared on the blog, I have decided to include it below for reference.

I will take up some of the ideas presented in the Barron’s column, including information risk and price risk, in this space going forward.

Related posts:

Previous Barron’s contributions:

Disclosure(s): none

Wednesday, November 17, 2010

A Cluster of Support

Last week in Looking for SPX Support Levels, I introduced a chart which highlighted two areas in which stocks had traded in a narrow range for about two weeks before breaking the deadlock and moving higher. I referred to these two areas as congestion areas and highlighted them in red ovals in the cart below.

The higher of the two congestion areas, which spans roughly SPX 1175-1185, represents what I consider to be the first of two tipping points. Last week I described 1175-1185 as a “line of demarcation between a minor pullback and a bearish counter trend.” So far this area of congestion has managed to muster sufficient support to halt the decline, but has yet to inspire enough buying to turn stocks back upward.

The chart below updates the two congestion areas through today’s closing data. Note that the 50-day moving average of 1167 is about to come into play as well, even as technical factors take a back seat to issues in Europe and China.

Related posts:


[source: StockCharts.com]

Disclosure(s): none

Tuesday, November 16, 2010

VIX Punches Through Upper Bollinger Band

The VIX has no idea what is going on in Ireland and has no way of knowing whether the markets are underestimating or overestimating the full extent of the European sovereign debt crisis, not only in the Emerald Isle, but also in Greece and Portugal.

While it is always important to be well-informed when it comes global political and economic flash points, most VIX traders prefer to take a technically-based approach to trading volatility. In this vein, the simplest and most effective approach is to fade any VIX extremes. I have covered many ways to measure VIX extremes in this blog. One of the simplest is to use Bollinger bands to identify VIX values which are extreme enough to invite high probability mean reversion trades.

The chart below is a daily bar snapshot of the VIX, with standard Bollinger band settings (20 days, 2.0 standard deviations), showing that the recent VIX high of 23.06 is well above the 22.45 upper band level of the current Bollinger band settings. For most VIX traders, this means a short VIX play is in order, irrespective of events on the ground in Europe.

For those who are new to volatility trading, keep in mind that VIX spikes have a habit of clustering and creating a vicious cycle. One only has to scroll back six months to see what happened the last time concern about European sovereign debt soared, sending the VIX from 15 to 48 in the space of a month.

Related posts:


[source: FreeStockCharts.com]

Disclosure(s): short VIX at time of writing

Monday, November 15, 2010

CVOL Begins Trading Today

Today the first non-Barclays volatility ETN began trading (CVOL), whose formal name is (and I am not making this up) “C-Tracks Exchange Traded Notes Based on the Performance of the Citi Volatility Index Total Return.” Fortunately, what I will be affectionately calling CVOL also has a formal short name of “C-Tracks ETN on CVOL” so that if anyone happens to ask you what CVOL stands for at a cocktail party, at least you can blurt out the answer in one breath.

Going forward, the big question is how CVOL and its 3-4 month VIX futures target maturity and 2x leverage component will perform relative to the Barclays competition: VXX and VXZ.

CVOL will need some more volume and liquidity before we can make some meaningful comparisons, but with 3900 shares traded today, at least some investors are already stepping up to the plate.

The links below provide some additional information about CVOL and attempt to locate it in the VIX ETN universe.

Related posts:

Disclosure(s): short VXX at time of writing

Sunday, November 14, 2010

Chart of the Week: Uptick in the Jobs Picture

Lost in all of the attention paid to Ireland, China, Cisco (CSCO) and the week’s other headline grabbers was some signs of progress on the jobs front, specifically in the area of the weekly jobless claims data.

This week’s chart of the week shows initial and continuing jobless claims since 2000 as a percentage of total covered employment in order to adjust for the changing size of the workforce. Note that while initial claims (solid red line) peaked first in March 2009, they have been in a holding period for the last year or so. Continuing claims (dotted blue line) peaked three months later and initially showed a sharper decline. While continuing claims began to form a plateau earlier in the year, the last month or so has seen noticeable improvement, with the trend line now dropping below the gray rectangle which marks the recent consolidation area.

This improvement could be a precursor to some downward movement in the unemployment rate, which may show up as early as in this month’s data.

Related posts:


[source: Bureau of Labor Statistics]

Disclosure(s): none

Thursday, November 11, 2010

The Evolving VIX ETN Landscape

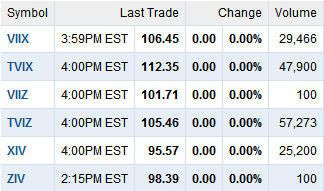
As of today, only four VIX exchange-traded products (ETNs and ETFs) are available for trading. All of these have been Barclays products and three of the four carry the iPath brand name. In descending order of volume, the VIX-based ETNs currently being traded are:

  • iPath S&P 500 VIX Short-Term Futures ETN (VXX)
  • iPath S&P 500 VIX Mid-Term Futures ETN (VXZ)
  • iPath Inverse S&P 500 VIX Short-Term Futures ETN (XXV)
  • Barclays ETN+ S&P VEQTOR ETN (VQT)
Five other companies (ProShares, Direxion, Citigroup, Jefferies and Bank of America) have VIX-based ETNs and ETFs (in the case of ProShares) in registration or have made announcements about forthcoming products, but I am unaware of any target launch dates.  In order to simplify matters a little, henceforth I will start to refer to these products as exchange-traded products or ETPs.

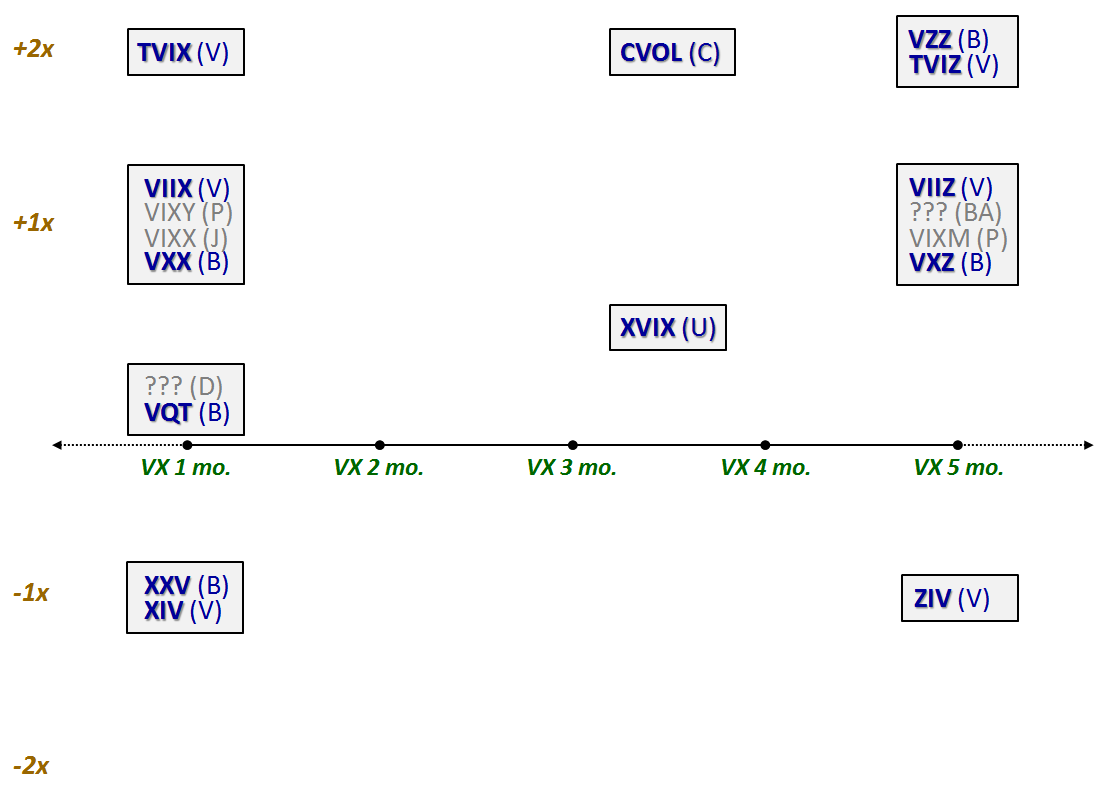
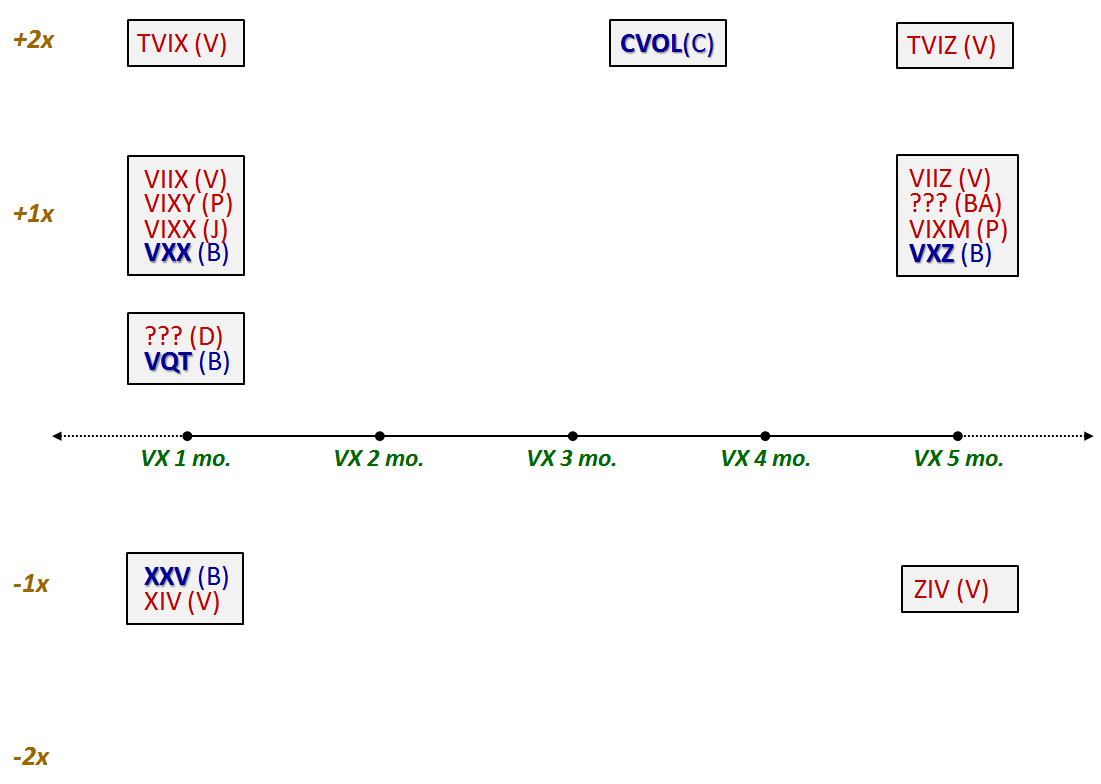
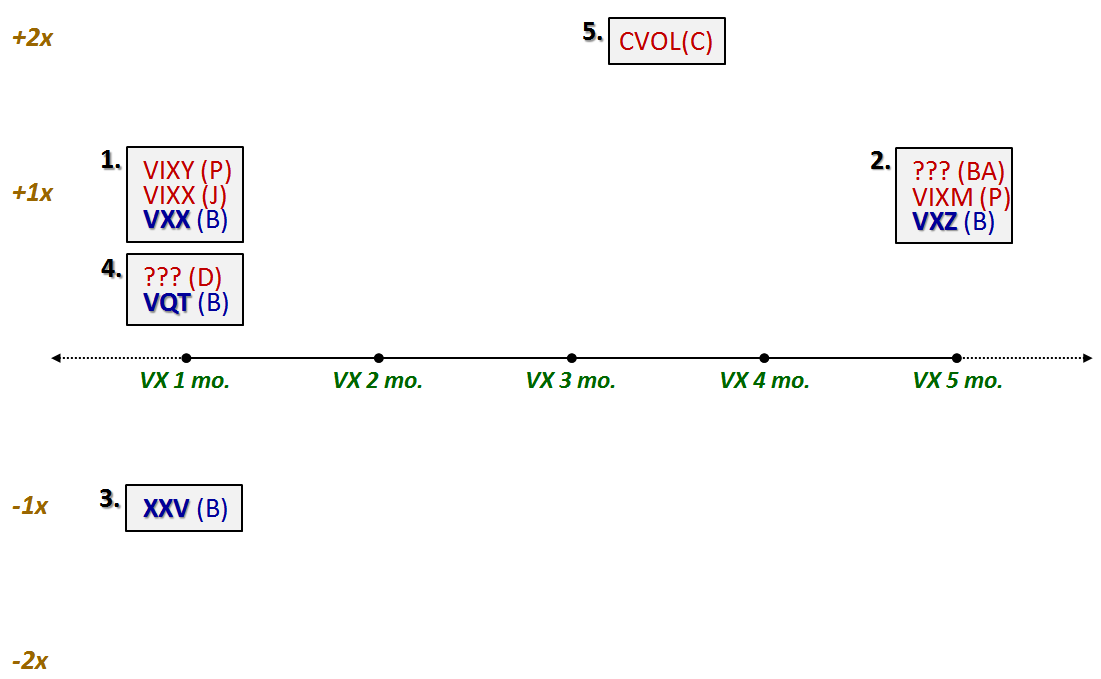
In order to attempt to simplify and catalog the growing universe of available and announced VIX-based ETPs, I have assembled the chart below. The chart uses the y-axis to plot the leverage used (all are standard +1x ETPs, with the exception of the +2x CVOL and the sole inverse product, the -1x XXV) and the x-axis to plot the target maturity. VX 1 mo. is short for VIX futures with a constant maturity of one month, etc.

I have identified each ETP by its ticker (I do not yet have tickers for the Direxion or Bank of America products) and have coded these with a one or two letter suffix to identify the issuer (P for ProShares, D for Direxion, C for Citigroup, J for Jefferies and BA for Bank of America.) ETPs that are currently traded are in bold blue; ETPs that have not yet been launched are in red font.

The final piece of information involves grouping the ETPs into five clusters which represent the five approaches currently being used for VIX-based ETPs. For all intents and purposes, the ETPs in each cluster are (or appear to be, at this juncture) equivalent in construction and should behave in a similar manner. Group #1 for instance, has been the dominant theme in the volatility ETP space to date. The focus here is on VIX futures with a constant maturity of 30 days. VXX was the first to market, but competitive offerings from Jefferies and ProShares are on the way. Group #2 uses a similar approach, but with a 5-month target maturity. Group #3 is the inverse of Group #1.

Group #4 represents what I consider to be a second generation of products, with a dynamic allocation of 2.5% to 40% (see Barclays VEQTOR ETN Begins Trading for details), which is why the group is shown here as having less than +1x leverage.

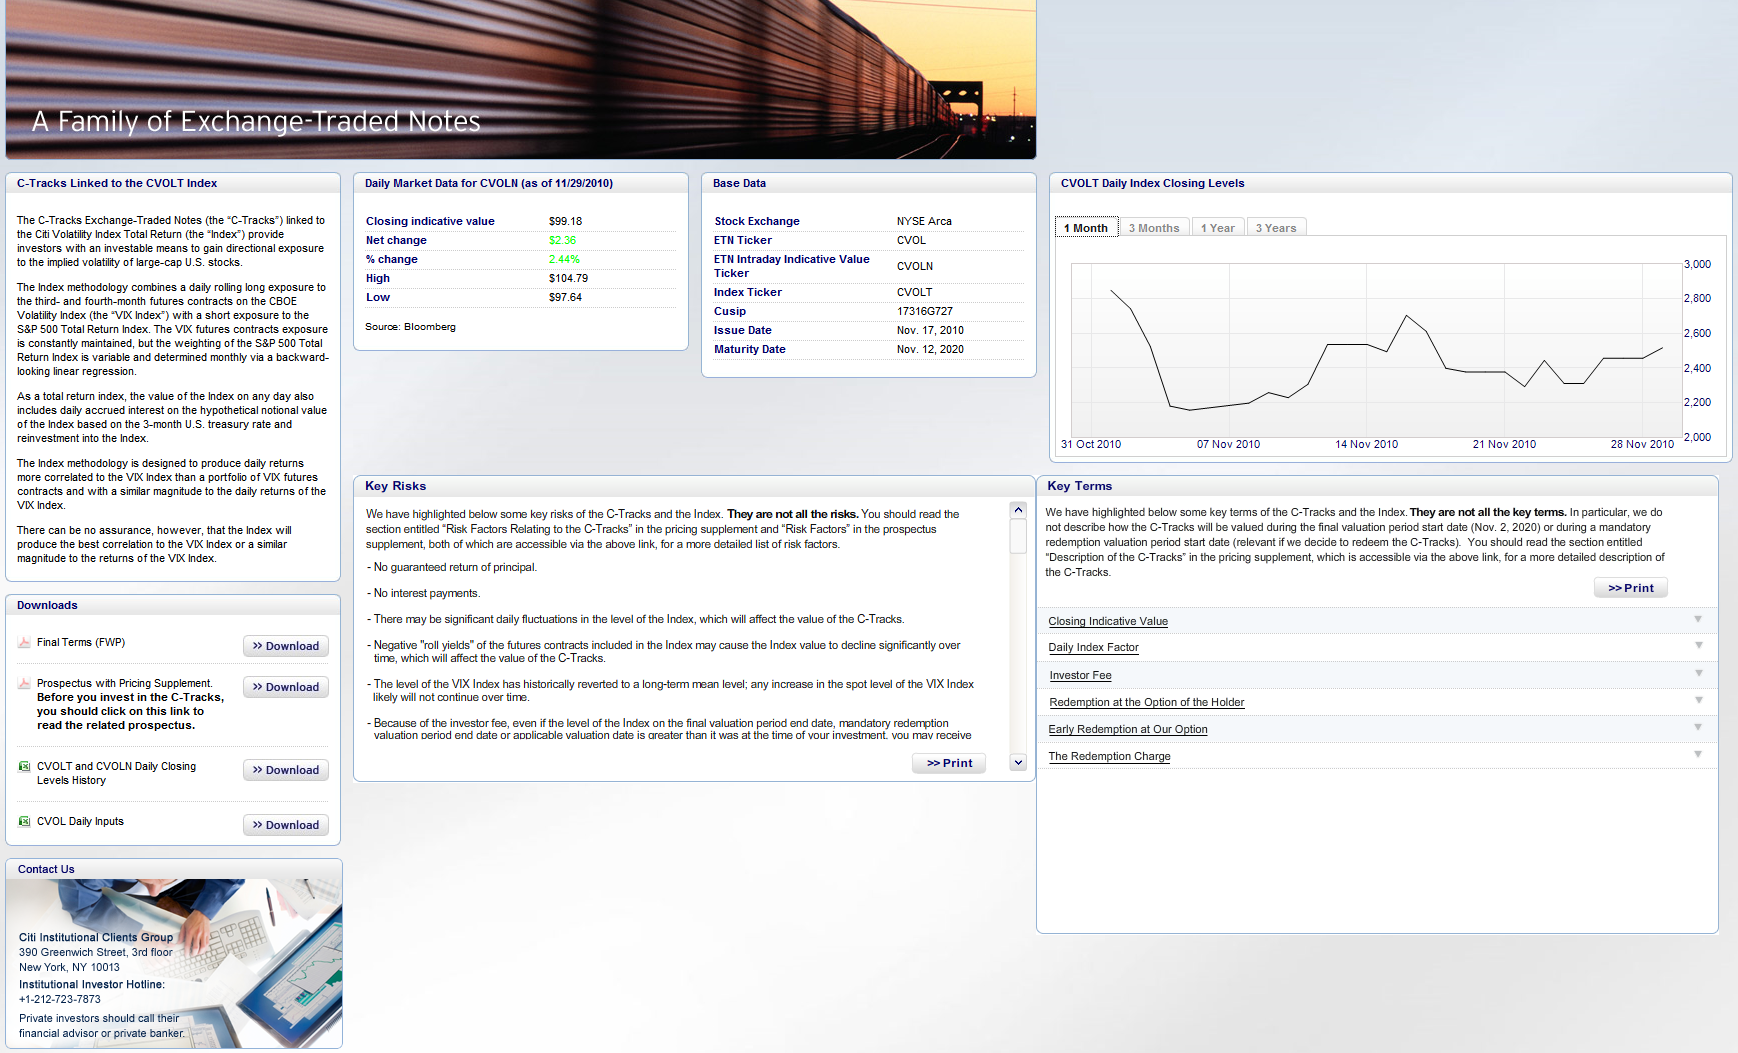
The newest VIX ETP approach comes from Citigroup, where their CVOL product not only targets a new portion of the VIX futures term structure (3-4 months), but adds a +2x leverage component and also includes a “variable weighted short position in the S&P 500 Total Return Index” as well.

Things continue to get more and more interesting in the VIX ETP space. I look forward to the launch of some of these newer products and to seeing how they perform.

It should go without saying that as the VIX ETP landscape continues to evolve, I will do my best to attempt to map it in a meaningful manner.

Related posts:


Disclosure(s): none

DISCLAIMER: "VIX®" is a trademark of Chicago Board Options Exchange, Incorporated. Chicago Board Options Exchange, Incorporated is not affiliated with this website or this website's owner's or operators. CBOE assumes no responsibility for the accuracy or completeness or any other aspect of any content posted on this website by its operator or any third party. All content on this site is provided for informational and entertainment purposes only and is not intended as advice to buy or sell any securities. Stocks are difficult to trade; options are even harder. When it comes to VIX derivatives, don't fall into the trap of thinking that just because you can ride a horse, you can ride an alligator. Please do your own homework and accept full responsibility for any investment decisions you make. No content on this site can be used for commercial purposes without the prior written permission of the author. Copyright © 2007-2023 Bill Luby. All rights reserved.
 
Web Analytics