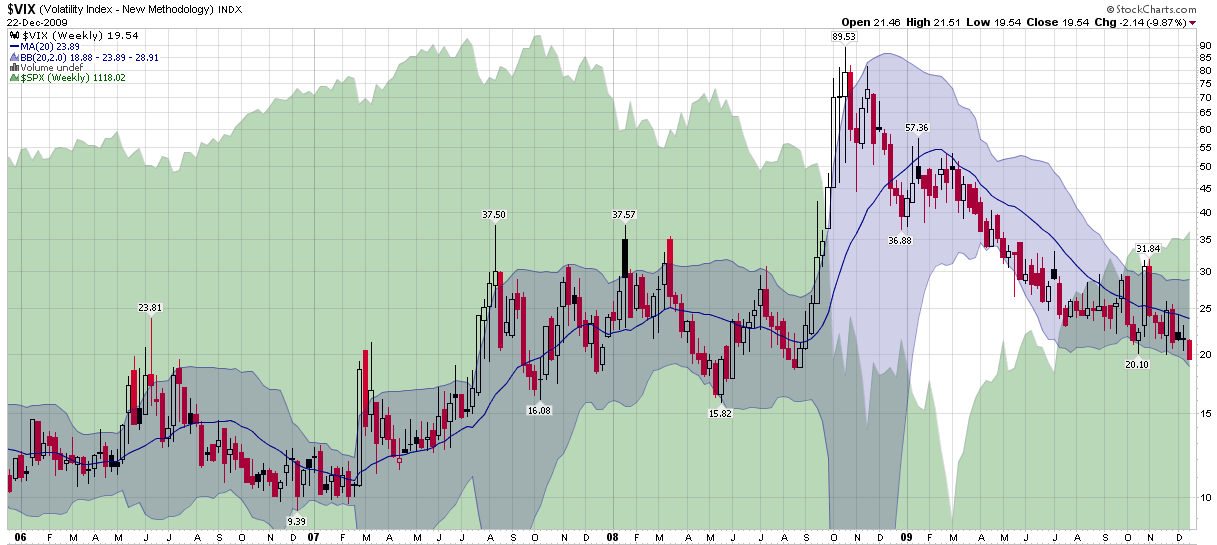
Historical Volatility and Seasonality Push VIX Below 20
The CBOE Volatility Index (VIX) slipped below 20.00 for the first time since August 2008, ultimately closing at a 16 month low of 19.54 today.
When I called for a sub-20 VIX last Wednesday in Historical Volatility Pointing to a Sub-20 VIX, the crux of my argument was that “if HV [historical volatility] continues to fall, the case for a 20+ VIX will deteriorate rapidly. Substantial divergences tend to have a relatively short life. With the current divergence now at six trading days, the VIX can only defy gravity for a short while longer.” I further noted seasonal factors (such as the holiday effect) at work and was also emboldened in my prediction by what I call calendar reversion – the tendency of the VIX to fall an extra 1% or so on Fridays due to market makers adjusting prices ahead of the weekend to compensate for the mismatch between the five day trading week and the seven day calendar week.
Now that the VIX has closed below 20, however, there is no reason to assume it will not go lower. Even without accounting for seasonal factors, which include a 3 ½ day trading week this week followed by a 4 day trading week next week, current historical volatility data suggest a fair value for the VIX in the mid-17s.
While I think we have a while to go before investors are comfortable with a VIX that is more than a point or two away from the 20s, today should go a long way toward muting the cry that a VIX of 20 is sufficiently low to necessitate a selloff in stocks.
For more on related subjects, readers are encouraged to check out:
- Historical Volatility Pointing to a Sub-20 VIX
- VIX Holiday Crush
- VIX of 20 Spurring Market Correction?
- What Is Historical Volatility?

[source: StockCharts]
Disclosure: none

