Showing posts with label calendar reversion. Show all posts

Friday, December 7, 2012

Unusual Twist in VIX Futures Term Structure as of Late

Even with the U.S. fiscal cliff grabbing all the headlines and keeping the VIX from dipping under 15, I still thought I might be able to trot out my annual series of posts on the holiday effect (or calendar reversion):

As it turns out, fears related to the fiscal cliff have trumped the seasonal factors – at least so far – and the VIX futures term structure has twisted and turned in a decidedly unusual manner.

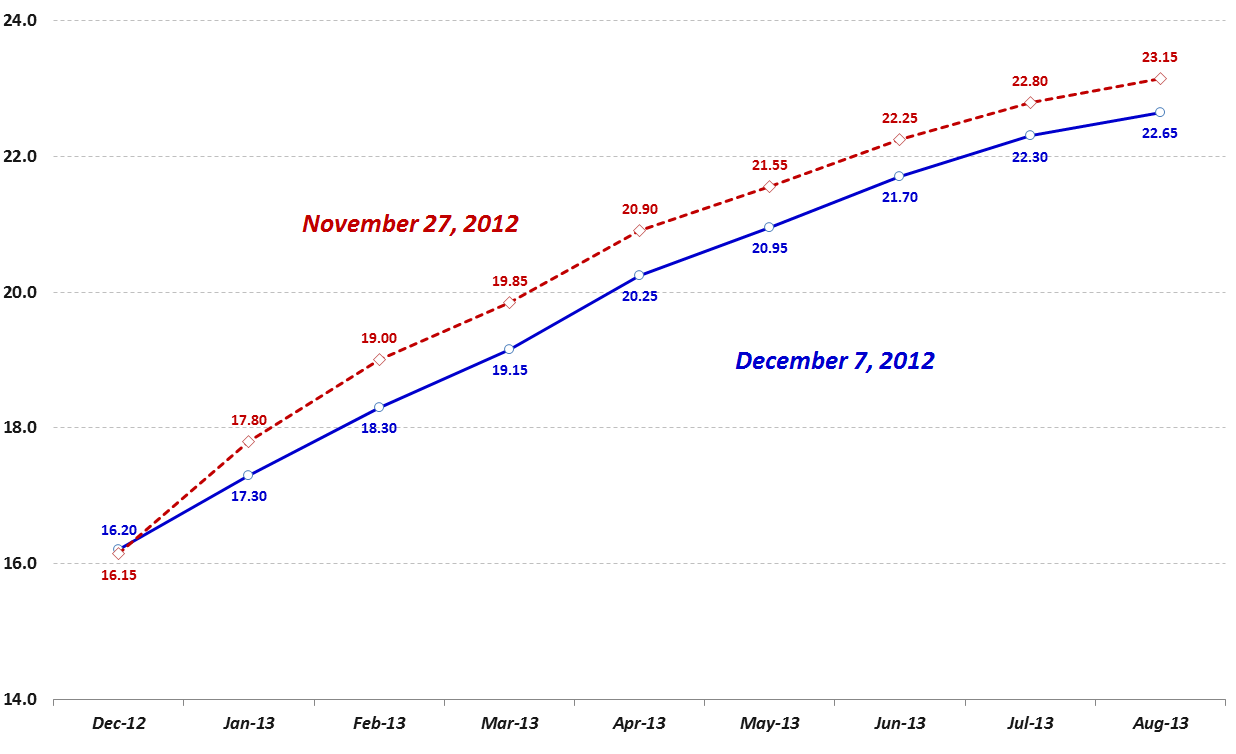
The graphic below shows the VIX futures term structure curve from November 27th (dotted red line) and again today (solid blue line), eight trading days later. Typically when there are changes in the term structure, the most extreme moves are in the front month (Dec) contract, the second largest move is in the second month (Jan) contract and so on down to the back month, which typically moves only about one third as much as the front month.

What makes the graphic below so interesting is that the front month contract is up slightly (actually up 0.05 points) while the market’s estimation of future implied volatility going out all the way to August has dropped at least 2.2% (Jul and Aug) and as much as 3.8% (Feb). What can we conclude about these changes in the VIX futures? Well, most likely investors are buying protection against a move in December (the VIX futures expire at the open on December 19th) and are selling longer-dated VIX futures contracts for February and other months in order to finance the cost of that protection. All things being said, the market is reflecting less risk in 2013, somewhat offset by a slight increase in risk and uncertainty for the next two weeks or so.

[source(s): CBOE Futures Exchange (CFE)]

Related posts:

Disclosure(s): none

Monday, August 13, 2012

How Can the VIX Be 14 and Lower than VIN and VIF?

Many novice and advanced VIX followers are scratching their heads today, wondering why the VIX is down more than 5%, hovering around the 14.00 level, when the SPX is down 0.4% and all the major market averages are deeply in the red. More serious students of the VIX will also note that this drop in the VIX comes on a Monday, when the typical VIX “calendar reversion” is generally responsible for about a 1% pop in the volatility index.

The answer to most of these questions lies in yet another idiosyncrasy of the VIX: the roll. Quoting directly from the source, the CBOE Volatility Index (VIX) White Paper, we find these two important nuggets from pages 4 and 9, which I have presented here sequentially for easier consumption:

“The components of VIX are near- and next-term put and call options, usually in the first and second SPX contract months. ‘Near-term options must have at least one week to expiration; a requirement intended to minimize pricing anomalies that might occur close to expiration. When the near-term options have less than a week to expiration, VIX ‘rolls’ to the second and third SPX contract months. For example, on the second Friday in June, VIX would be calculated using SPX options expiring in June and July. On the following Monday, July would replace June as the ‘near-term’ and August would replace July as the ‘next-term.’”

“At the time of the VIX ‘roll,’ both the near-term and next-term options have more than 30 days to expiration. The same formula is used to calculate the 30-day weighted average, but the result is an extrapolation of σ2 1 and σ2 2; i.e., the sum of the weights is still 1, but the near-term weight is greater than 1 and the next-term weight is negative (e.g., 1.25 and – 0.25).” [Emphasis added]

When I first posted about VIN and VIF back in March 2011 (VIN, VIF and an Obsolete VIX), I was stunned to learn how few investors, including savvy and experienced VIX fanatics, were completely unaware of these indices. At the time, the CBOE did not even refer to VIN and VIF on their web site, but they have since added a splash page for these two indices, along with the following brief comments:

CBOE maintains indexes that track the level of implied volatility from single SPX maturities.

Ticker VIN (VINX on Bloomberg) – nearer term SPX expiration used in VIX calculation

Ticker VIF – farther term SPX expiration used in VIX calculation

Getting back to the roll, the SPX options contract months roll forward one month today, so that the nearer-term month (VIN) moves from August to September and the farther-term month (VIF) moves from September to October. More importantly, per the bolded text from the VIX white paper above, today’s VIX calculations sum more than 100% of the VIN and a negative number for VIF. This is the reason why the VIX is less than the two components used in its calculation: VIN and VIF.  In summary, the bigger the difference between the VIN and the VIF (and right now that difference is a very large 9.4%), the more likely the VIX is going to be substantially depressed following the VIX roll.  Also, as we move toward the expiration of VIX options on August 22nd, the distortions from the negative VIF component used in the VIX calculations should gradually diminish, as the VIF weighting moves toward zero and then becomes a positive number.

For those who are interested in delving into the nuances of the VIX calculations, the CBOE’s VIX White Paper is the best place to start; the links below might also provide additional insight.

Related posts:

Disclosure(s): long VIX at time of writing

Thursday, February 9, 2012

Implications of a Positively Correlated SPX and VIX

For those who missed today’s market action and just looked at the post-mortem reports, today probably looked like just another in a series of uneventful days. For those who were paying attention to the likes of the VIX futures and ETPs based on VIX futures such as TVIX (+10.7%) and VXX (+5.2%), however, the tension in the air was obvious.

But the SPX, DJIA and NASDAQ composite indices were all up today, so what’s the big deal? It turns out that investors are easily spooked if the VIX (+2.6%) and the SPX (+0.1%) both move in the same direction. As the graphic below shows, the VIX and the SPX move in the same direction about 22% of all trading days. I think the real issue behind the concern about the direction of the VIX and the SPX is related to a hypothesis I laid out yesterday in What the VIX Kitchen Sink Chart Says:

“…the general consensus seems to be that stocks just do not deserve their current lofty valuation.  In this type of environment, many investors become particularly susceptible to confirmation bias and scramble to find one or more indicators which will tell them what they have already begun to believe: that a major correction is likely just around the corner.”

The last time I crunched the numbers for VIX and SPX daily correlations, was in May 2007 and in looking at data from 1990-2007, I concluded that a High Positive Correlation Between VIX and SPX Often Signals Market Weakness. When I ran the numbers this time around, it turns out that the market gyrations surrounding the financial crisis of 2008 and subsequent bullish rebound did little to change the overall conclusions.  The full data set (1990-2012) now shows that when both the VIX and SPX are up on the same day, the mean returns for the next 1-100 trading days trail the typical returns for the full data set by a substantial margin and are negative through the first five trading days.

In terms of key takeaways, it now appears that stocks perform best following days when the SPX is down and the VIX is up (the ROI +1 column refers to the performance of the SPX one day hence) and worst on days like today when the SPX is up and the VIX is up.  I have sorted the rows according to ROI +10 and in looking at the date, it is clear to me that some mean reversion is responsible for a good portion of the performance characteristics following the various VIX-SPX daily return permutations.  [For the record, the data in the table below includes Fridays and Mondays, so it is possible that calendar reversion may have had an impact on the results.]

Now I will be the first to admit that stocks are overdue for a pullback, but just because the VIX and SPX both advanced on two consecutive days does not necessarily mean the planets are aligning for an Aquarian selloff. If investors are looking for that market reversal silver bullet, the SPX-VIX correlation data, while bearish, fall short of hinting at a major reversal.

Below is a larger than usual set of links for those who may be interested in digging into the history of some of the SPX-VIX correlation themes in this space.

Last but not least, thanks to sharp-eyed reader Lee, whose sleuthing helped me uncover an errant spreadsheet formula that led to some bad data in an earlier version of this post.

Related posts:

[source(s): CBOE, Yahoo]

Disclosure(s): short TVIX and VXX at time of writing

Tuesday, December 13, 2011

December Is the Cruelest Month…For the VIX

It seems well-nigh impossible for a December to pass without some sort of movements in the CBOE Market Volatility Index (the formal name of the VIX, for those who may have a short memory) that leave investors scratching their heads. In light of this, it appears I will be responsible for at least one December post reminding investors about the idiosyncrasies of implied volatility and the VIX during the holiday season.

There are a number of ways to look at the typical holiday swoon in the VIX, which I have labeled (the holiday effect or calendar reversion) for easy tagging and backtracking. From a strict fundamental perspective, the biggest change during the December/January holidays is fewer trading days, which means a shorter runway for stocks to depart for some unusual destinations. The other big factor is one of seasonality, specifically the tendency for December to be a bullish month for stocks.

I have chronicled how these factors influence the VIX and the strange prints they sometimes leave on the charts in posts from previous years (see links below.)

This year I am offering a chart which shows that in any given year, there is about a 40% chance that the VIX will make its annual low in December and as I discussed last year in VIX and the Week Before Christmas, the bottom usually comes in the last half of the month and most often just before Christmas.

In three trading sessions the VIX is already more than 20% off of its 30.91 close from last Thursday. It seems rather far-fetched to think that the VIX will plummet all the way below the current 2011 low reading of 14.27 from April 28th of this year (a date that is provisionally included in the chart below,) but stranger things have happened.

Even if you think the European sovereign debt crisis will see several more eruptions before the end of the year, don’t be surprised if the VIX is sleeping with the fishes for the next week or two.

Related posts:


Disclosure(s): none

[source:  CBOE, Yahoo]

Monday, December 12, 2011

The Low Fear Selloff

Steven Place of Investing with Options has a video post up this morning, Options Market Does Not Care About Selloff, in which he discusses how the implied volatility in various asset class volatility indices (VIX, GVZ, EVZ) are showing a very muted reaction to today’s selloff in stocks.

As noted here previously, the VIX generally moves about -4x in percentage terms the direction of the SPX. Mondays generally see a slightly larger move in the VIX relative to the SPX (usually an incremental 0.5% - 1.0% increase over Friday’s close) due to calendar reversion or the weekend effect, so today one would expect to see the VIX moving at least 4x in the opposite direction of the SPX.

In fact, as I type this the SPX is down about 1.9% on the day and the VIX is up only 3.9% -- so the VIX is about half as sensitive to changes in the SPX that is typical for a Monday trading session.

This is not to say that investors are oblivious to the risk that remain in Europe (and elsewhere) or that today’s move is just a head fake by stocks, but it does mean that the consensus expectations for immediate downside risk are quite low.

Santa may pay a visit after all, assuming he manages to survive all the austerity measures that I am certain his government has saddled him with…

Related posts:

Disclosure(s): none

Thursday, November 3, 2011

New VIX Backwardation Record

This week marks the first time that the front two months of the VIX futures term structure have been in backwardation each day for more than three consecutive months. In fact, the current streak of 68 days eclipses the old record of 63 days that dates to the 2008 financial crisis.

While the backwardation streak is intact for the front two months, when looking at the full VIX futures term structure, the futures curve has reverted to contango five times over the course of the past three weeks. The primary reason that the front two months have remained in backwardation in defiance of the rest of the VIX futures term structure has to do with something I call the “holiday effect” or “calendar reversion.” Essentially, what happened a little over two weeks ago was that the roll from the October front month to the November front month VIX futures, as well as from the November second month to the December second month VIX futures has added some incremental holiday effect backwardation to the front two months. This is due to the fact that the second month VIX futures have an expiration of December 21st, and these are artificially depressed due to the historically low volatility associated with the holiday season. The impact is being felt by all the short-term VIX futures ETPs that are buying second month (December) VIX futures at artificially depressed levels and selling front month (November) VIX futures as part of the daily rebalancing process.

The graphic below shows the 1.70 point differential between the front month and second month VIX futures. Note that it is not until February 2012 that the term structure starts to flatten out, as investors begin to converge on the idea that the VIX is likely to hug the 30 level for the better part of the first half of next year.

Related posts:

[source: Interactive Brokers]

Disclosure(s): short VIX at time of writing

Friday, August 5, 2011

VIX Term Structure Evolution Over Last Ten Days

If you think the last two weeks have turned the investing world upside down, well you have to look no farther than the VIX futures term structure to see just how accurate that view is. Two weeks ago the VIX was in the 17s and the VIX futures term structure was in contango (upward sloping) and today the VIX closed at 32 and the VIX futures term structure is in backwardation. In fact, the current VIX term structure looks a lot like a mirror image of what it was two weeks ago.

In the graphic below, I have detailed the shift in the term structure from July 22nd to today’s close. During that period, the S&P 500 index has sold off 10.8%, while the VIX has spiked 82.6%. Note that the front month (August) VIX futures have advanced sharply – up 59% during this period – but not as sharply as the VIX. Looking at the back end of the term structure, the March 2012 futures were not traded back on July 22nd, so the February futures are the most distant futures for which we can compare prices. Their move lagged the VIX and front month futures by a large margin and was almost identical in magnitude to that of the SPX, up 10.7% in those two weeks. One can clearly see from the funnel formed by the two term structure lines that for each month farther out in the term structure, the VIX futures were less responsive to the move in the SPX or the VIX.

In addition to annotating the backwardation and contango in the graphic, I have also circled the December VIX futures and options expiration (December 21st) in an effort to preempt some questions about why these futures seem unusually low both now and two weeks ago. The simple answer is the preponderance of holidays toward the end of the year, with fewer trading days translating into fewer opportunities for extended moves in volatility. I have discussed this phenomenon many times in the past (see VIX and the Week Before Christmas, for starters) and have named it the “holiday effect” or “calendar reversion.” Also note that December has a history of being relatively bullish for stocks, with low volatility.

Finally, I have fielded quite a few questions about the implications of yesterday’s 35.4% VIX spike. Here some prior research on the Short-Term and Long-Term Implications of the 30% VIX Spike will undoubtedly be of interest to most readers. The quick takeaway is that this event is bullish for stocks and bearish for volatility. I would expect to see more evidence of this fact beginning to kick in on Monday.

Related posts:


[source: Interactive Brokers]

Disclosure(s):
short VIX at time of writing

Tuesday, January 18, 2011

Chart of the Week: the VIX Since 2007

The Year in VIX and Volatility was such a huge hit two weeks ago that I thought it would be appropriate to address all the angst about low readings in the VIX with a chart of the CBOE Volatility Index (yes, the VIX does have a formal name) that stretches back to the beginning of 2007 and incorporates the 2007 peak in stocks, the 2008 panic, the 2009 bottom and the rally that has dominated the past two years.

Whereas the majority of the charts in this space use daily VIX bars and an occasional chart of VIX macro cycles and the like utilize monthly bars, this time around I am pulling back to a perspective which utilized weekly bars for the VIX. Personally, I like weekly bars because it removes the weekend effect or ‘calendar reversion’ as I like to call it. More importantly, I plan my trading and execute my strategies in weekly time chunks, hence the weekly subscriber newsletter.

The chart below, courtesy of StockCharts.com, is the first I recall ever having seen that uses weekly moving average envelopes (MAEs) for the VIX. In this particular variation, I have used MAEs that cover 13 weeks (one quarter) of VIX data and plotted an envelope which extends 20% above and below that 13-week moving average. The result is a chart which does a good job of capturing outliers that are generally high probability fade trades.

The chart also shows that a break below the 15.00 level will but the VIX back at a level not seen since July 2007, which is, ironically, just about the time that Adam Warner and I had the bright idea to estimate where volatility was going to be. [See Volatility Aces Bloggers for the gory details.]

Getting back to the moving average envelopes, current VIX levels are relatively low in absolute terms, but with the bottom of the weekly 13-20 moving average envelope currently at 14.63, the risk of the VIX punching through the lower envelope appears to be extremely low, at least to this observer.

My best guess is that the next piercing of the envelope is more likely to be associated with a rising VIX than a falling one, but even that scenario may take a while to play out.

Related posts:


[source: StockCharts.com]

Disclosure(s): none

Monday, January 3, 2011

S&P 500 Index 20-Day Historical Volatility Hits 39-Year Low

Since I haven’t seen it mentioned anywhere else, I thought I should note that 20-day historically volatility in the S&P 500 index hit its lowest level since April 1971, the same month that the Rolling Stones released Sticky Fingers and Charles Manson was sentenced to death.

Now there are multiple ways to calculate historical volatility. I outlined my preferred non-centered methodology in Calculating Centered and Non-Centered Historical Volatility, which yielded a 20-day HV of just 4.57 as of Friday’s close, barely 25% of the VIX’s closing value of 17.75 from the same day.

Of course, some of this disconnect is due to the holiday effect or calendar reversion, but given that we are seeing near-record lows in some volatility measures just two years and a couple of weeks removed from a VIX of 80+ should certainly raise some eyebrows.

In terms of implications going forward, today’s big(ger) move should herald the return of more normal volatility, as well as more middling implied and historical volatility measures.

Related posts:

Disclosure(s): none

Wednesday, December 22, 2010

VIX and the Week Before Christmas

I guess I should not be surprised that a VIX of 15.45 – the lowest since July 2007 – has all manner of pundits scrambling to pull some sort of explanation out of a hat and weave it into their favorite bullish or bearish forecast for the markets.

In fact, the new low in the VIX is not a big deal, at least during this time of the year. I have talked about this before on a number of occasions, including in VIX Holiday Crush and earlier this week in Chart of the Week: Historical Volatility Plummets in Seasonal Swoon. Call it the holiday effect or calendar reversion, but when the VIX’s 30-day window includes two holidays and two additional historically slow days in advance of the Christmas and New Year’s holidays, volatility has a tendency to take a vacation.

How strong is the tendency toward a low VIX? Well, consider that in five of the last eight years, the annual low in the VIX fell during the week leading up to Christmas. Last year, some may recall that the VIX made its annual low on Christmas Eve. Back in 2004, the VIX had its low for the year on December 23rd; and in both 2003 and 2006, the VIX bottomed out for the year on December 18th. Today’s low makes it five pre-Christmas bottoms in eight years.

So keep a close eye on the VIX and feel free to marvel at how low it goes, but consider that during the holiday season, experienced investors will give very little credence to the absolute level of expected 30-day implied volatility in S&P 500 options. Only after the first of the year should we take the VIX numbers seriously, regardless of how low prices and implied volatility levels may be marked down in the pre-Christmas shopping rush.

Related posts:

Disclosure(s): none

Monday, December 20, 2010

Chart of the Week: Historical Volatility Plummets in Seasonal Swoon

‘Tis the season for the annual holiday effect in which historical volatility (HV) has a strong tendency to plunge and drag implied volatility down with it. This is a subject I have tackled on a number of occasions in the past (see links below) and is really just a longer variant of what I call calendar reversion – the tendency of the VIX to fall an extra 1% or so on Fridays due to market makers adjusting prices ahead of the weekend. The lack of volatility all boils down to the same root cause: fewer trading days during the 30 calendar day window specified by the VIX (and implied volatility in general) means there are fewer opportunity for stocks to stray significantly from the path projected by efficient markets, standard deviations and the rest of the normalcy regime.

As of Friday’s close the S&P 500 index had a 10-day historical volatility of 5.5, which is the lowest reading since May 2007. In this week’s chart of the week below, I have elected to show the 10-day historical volatility of the Russell 2000 small cap index (RUT), which traditionally has higher volatility than the SPX and is also more susceptible to the winds of economic change and uncertainty. As the chart shows, 10-day historical volatility (white line) sits at a two-year low and has helped to pull the implied volatility (red line) of the index down below 20. Note that last week the CBOE Russell 2000 Volatility Index (RVX) dipped as low as 19.55 and is threatening to drop below the 19.00 level for the first time since June 2007.

After the first of the year I expect to see the holiday effect magically disappear and HV, IV and volatility indices begin to reflect a more accurate view of investor expectations.

Related posts:


[source: Livevol.com]

Disclosure(s): Livevol is an advertiser on VIX and More

Tuesday, December 22, 2009

Historical Volatility and Seasonality Push VIX Below 20

The CBOE Volatility Index (VIX) slipped below 20.00 for the first time since August 2008, ultimately closing at a 16 month low of 19.54 today.

When I called for a sub-20 VIX last Wednesday in Historical Volatility Pointing to a Sub-20 VIX, the crux of my argument was that “if HV [historical volatility] continues to fall, the case for a 20+ VIX will deteriorate rapidly. Substantial divergences tend to have a relatively short life. With the current divergence now at six trading days, the VIX can only defy gravity for a short while longer.” I further noted seasonal factors (such as the holiday effect) at work and was also emboldened in my prediction by what I call calendar reversion – the tendency of the VIX to fall an extra 1% or so on Fridays due to market makers adjusting prices ahead of the weekend to compensate for the mismatch between the five day trading week and the seven day calendar week.

Now that the VIX has closed below 20, however, there is no reason to assume it will not go lower. Even without accounting for seasonal factors, which include a 3 ½ day trading week this week followed by a 4 day trading week next week, current historical volatility data suggest a fair value for the VIX in the mid-17s.

While I think we have a while to go before investors are comfortable with a VIX that is more than a point or two away from the 20s, today should go a long way toward muting the cry that a VIX of 20 is sufficiently low to necessitate a selloff in stocks.

For more on related subjects, readers are encouraged to check out:

[source: StockCharts]

Disclosure: none

Thursday, October 29, 2009

The Calendar Effect and Time Decay

Since the beginning of last year, I have periodically discussed what I call “calendar reversion,” which is essentially a phenomenon caused by the fact that the VIX is priced according to the calendar, but only calculated during trading days. The long and the short of this chronological mismatch is that market makers tend to drop option prices (and implied volatility) on Fridays in anticipation of the coming weekend and raise them on Mondays.

Earlier today, Mark Sebastian of Option911 wrote the best article I have seen on this subject, How Option Time Premium Decays Over the Weekend, in which he detailed his experiences related to weekend time decay and how market makers account for this during the Friday trading day. If you want to understand options pricing dynamics and how to best synchronize a five day clock with a seven day clock, then Mark’s work is absolutely required reading.

Note that Mark’s blog is one of the 15 entries in my new (as of today) Favorite Options Blogs list in the right hand column of VIX and More. In the past couple of months I have found myself going out of my way to assemble a Friday links post in large part to highlight some of the interesting work coming out of several relatively new options blogs. Now that it is no longer just Daily Options Report and VIX and More talking about options, I will do the best I can to incorporate as much of the excellent new information and analysis that can be found in all corners of the blogosphere.

For more on calendar reversion, readers are encouraged to check out:

Friday, May 22, 2009

Big Intraday Surge in VIX While SPX Treads Water

While I tend to shy away from talking too much about intraday moves in the VIX, today has been an unusual day in the VIX.

First, for most Fridays and particularly before long weekends, you should expect the VIX to be (a little more than 1.0%) lower than usual due to what I refer to as calendar reversion, when options are repriced with the assumption of lower volatility in advance of several non-trading days.

As I type this the VIX is almost flat, while all the major indices are in the green.

What is particularly interesting, however, is how the VIX has surged since about 1:00 p.m. ET. In the one minute intraday chart below, note the steady rise in the VIX over the course of the last hour or so, while the SPX has essentially moved sideways.

The action in the VIX could portend a rocky last hour or two or perhaps indicate that traders are becoming more concerned about holding long positions over the holiday weekend. Keep an eye on the VIX – and the weakness in real estate (IYR) and financials (XLF).

[source: BigCharts]

Disclosure: Short XLF, IYR and long VIX at time of writing.

Monday, April 6, 2009

Today’s Jump in the VIX

Lately it seems like I am the only one who is not talking about the VIX. I find it particularly ironic that many of the same people who were pounding the table saying that the market could not bottom unless there was another dramatic VIX spike and high volume capitulation are now insisting that the markets cannot rally from current levels until the VIX continues down. I suspect these pundits will end up going 0 for 2 in their predictions.

For the record, at the very moment the SPX formed the “devil’s bottom” of 666.79 on March 6th, the VIX was at 51.65, which was not even the high for the particular day. By the end of the day, the VIX was down to 49.33 in what looks in retrospect like a classic stealth bottom.

So what is driving the VIX right now? In a previous post, I opined that a simplistic conceptual model of the VIX is one which “incorporates incremental changes in uncertainty and fear on top of recent historical volatility.” Many of the common measures of historical volatility (10, 20, 30 and 50 day) show that historical volatility in the SPX topped in the middle to latter portion of March. Since the 7.08% jump in the SPX on March 23rd, trading has been relatively subdued from a volatility perspective. As that 7.08% jump as well as the 6.37% and 4.07% jumps from March 10th and March 12th begin to scroll off the lookback window, historical volatility numbers should begin to lead the VIX back down.

As far as fear and uncertainty are concerned, the fear of a global systemic bank failure seems to be receding, while concerns about a deepening global recession are lingering and still rising in some quarters. The G-20 meeting underscored the willingness of leaders of the world’s largest economies to coordinate their activities, even if they cannot agree on the details of those coordinated efforts.

Finally, we are in a news cycle lull this week, but earnings season officially kicks off with Alcoa (AA) reporting tomorrow.

The bottom line is that current levels of the VIX are in line with historical volatility readings and changes in the macroeconomic landscape. The fear component of the VIX is clearly on the wane, which should mute any VIX spikes. On the other hand, historical volatility needs to continue to decline and the VIX term structure (which is based on SPX options) and VIX futures need to soften somewhat before the VIX can reasonably be expected to start trading in the 30s on a regular basis.

Many analysts have a tendency to rely too heavily on charts when looking at the future of the VIX. While charts can provide some useful information and it is nice to know that the VIX has recently moved below its 200 day moving average, sometimes putting the VIX in the proper geopolitical and macroeconomic context is a more valuable approach.

So…I think the VIX is about where it should be right now and stocks can resume their move up without the VIX being required to plummet. In fact, if the bulls continue to keep the upper hand, expect the VIX to decline in a decidedly gradual fashion.

Finally, the VIX jumped 3.1% today, while the SPX lost 0.83%. That -4x move is typical of the VIX, but not on Mondays, when ‘calendar reversion’ usually means the VIX jumps about 1.5%. Add to this the 1.53% that the VIX fell during the 4:00 – 4:15 p.m. ET index trading portion of Friday’s session and one could make the argument that the VIX barely moved at all today relative to the SPX.

For another perspective on the recent movements of the VIX, I recommend More Ways to Look at Volatility from Daily Options Report.

Wednesday, March 25, 2009

New Blog: Trading the Odds

Veteran readers of VIX and More will no doubt be familiar with the wealth of statistical knowledge and insight brought to bear by a commenter by the name of Frank.

I was therefore delighted to learn that as of yesterday, Frank has decided to share in more detail some of his analytical work and thinking in a new blog that is going by the name of Trading the Odds. Based on a set of initial posts, it looks as if Frank will be using his considerable statistical data bank to talk about weekly and monthly seasonality, RSI (2), mean reversion, correlation and other related issues. I have a hunch that anyone who appreciates the heavily quantitative and statistical approach to the markets taken by the likes of Quantifiable Edges and MarketSci will find Trading the Odds has a similar appeal.

Given Frank’s body of work solely as a commenter on VIX and More, I would encourage readers to become familiar with his new blog. If anyone needs an additional nudge, note that today Frank addresses one of my favorite VIX quirks, Weekday Seasonality of the VIX, which looks at the ‘calendar reversion’ effect for VIX levels on Fridays and Mondays.

Welcome to the blogosphere, Frank.

Tuesday, December 23, 2008

VIX Holiday Crush

The VIX has been steadily declining during the month of December, from the high 60s on the first day of the month to the neighborhood of 42 as I write this.

Clearly the extraordinary measures taken by the government to pump liquidity into the system have been responsible for some of the shrinking volatility, but since I often talk about the holiday effect on volatility and frequently receive questions on the subject, I thought it would be a good day to share some of my research on the subject.

Since 1990, the month of December has averaged 21.05 trading days. The chart below captures each of those 21 trading days from 1990-2007 in composite form, with the mean for all December VIX values set at 100. In the chart, the pattern of decreasing volatility is most evident from the middle of the month to just before Christmas, during which period volatility drops from 2.4% above the December average (10th trading day) to 4.8% below the December average (17th trading day).

For the record, today is the 17th trading day of December, which makes the the historical low point in volatility for December.

I will not go so far as to say the that calendar suggests today is likely to be the last time the VIX dips under 42 for awhile, but those with an interest in historical context may wish to prepare for an increase in volatility, as the holiday ‘calendar reversion’ effect wears off.

[source: VIX and More]

Monday, October 27, 2008

Fear Is on the Decline

With the VIX currently at 77.13, it may seem like a strange time to talk about fear starting to leave the markets.

As I type this the VIX is down 2.00 and the SPX is down about 15. The fact that the VIX and SPX are both moving down this morning is unusual, but not unheard of. What makes the situation even more interesting is that it is happening on a Monday, when the VIX typically 'springs ahead' to account for the 'calendar reversion' effect in which the VIX is priced according to the calendar, but only calculated during trading days. The long and the short of this is that market makers tend to drop option prices on Fridays in anticipation of the coming weekend and raise them on Mondays.

We now have two Mondays in a row without any of the jaw-dropping end-of-the-world headlines many investors have come to fear. For that and other reasons, there markets seem to be less caffeinated this morning and the VIX is finally starting to feel the effects of gravity.

Friday, August 22, 2008

VIX Slips Below 19

One of the interesting side benefits of having a blog is that you can get a sense of what some investors are thinking just by looking at the Google searches that result in people clicking through to the blog. Today, for instance, I note some have found their way to VIX and More with the following Google searches:

  • “VIX oversold”
  • “VIX call options”
  • “trade using the VIX”
  • “bull call spread VIX”
  • “calendar spread VIX”
  • “predict VIX settlement value”
  • “September VIX futures”

It certainly appears as if quite a few investors are looking at a VIX that is below 19 and trying to understand that number in the context of headlines filled with gloom and doom. One possible conclusion, which I’m sure accounts for a fair number of the Google searches above, is that it is just a matter of time before the VIX spikes to a level consistent with the fear and anxiety which dominates much of the media coverage of the markets at the moment.

While a VIX of 18.92 (as I type this) sounds low, it is only 7.3% below the 10 day simple moving average and 11.8% below the 100 day SMA. Further, because today is a Friday and we have some low volume days approaching in advance of the Labor Day holiday, there are some calendar reversion effects at work, as Adam at Daily Options Report has detailed nicely in VIX Bicentennial Parade and several previous posts.

A look at VIX futures (see futures quotes from optionsXpress below) shows that futures expectations for the VIX for October to May are generally in the range of 22.50 – 23.20. Anyone considering a VIX options trade needs to get a better sense of how VIX options are priced off of and generally move with VIX futures, not the cash or spot VIX index that is four points lower.


That being said, there is also the case to be made that the VIX is not that low at the moment. Looking at a weekly chart, for instance, the VIX is toward the middle of the typical Bollinger band settings. This is the essence of VIX options: when they look like sitting ducks, it is usually an optical illusion.

Still, with a relatively low VIX and relatively low VIX implied volatility (58.2%), VIX options may be inexpensive portfolio insurance and/or a good leveraged bet against further turmoil in the markets. The key concept to remember is that a 3-4 point move in the cash/spot VIX will have little impact on the VIX futures prices on which the VIX options are based.

Wednesday, January 16, 2008

Volatility RIP?

I have talked rather extensively about the surprising lack of volatility in the markets during the past month or so, particularly given the sharpness of the current downturn and the preponderance of gloom and doom news out there. For a little while, at least, it was possible to ignore this phenomenon and chalk it up to “calendar reversion.” Now that the holiday season is behind us, this explanation no long holds water and it seems everyone wants to know why the VIX just sits there in the low to mid-20s.

For those interested in the evolution of my thinking on this subject, I encourage your to consider reading Not a Lot of Fear or Volatility Lately (11/27/07); No Fear (12/19/07); The Incredible Shrinking VIX (12/21/07); VIX Shrinkage Continues… (12/24/07); The Low Fear Selloff (1/4/08); and VWSI at Zero as VIX Meanders (1/14/08).

The bottom line is that I cannot explain why the volatility indices appear to be relatively indifferent to what many think is the beginning of a nasty bear market. Of course, this relative complacency would be possible only if investors as a whole were not worried about a bear market – and when was the last time that investors failed to panic when the markets turned down sharply?

While I have no answers, per se, I do have a few working hypotheses that I tweak from time to time, in no particular order:

  1. increased use of inverse and double inverse ETFs (i.e., QID) for hedging/speculation

  2. the expectation of a forthcoming emergency rate cut limiting upside potential for puts

  3. the possibility that there has been so much advance warning about a potential market meltdown that those who have wanted to protect their portfolio and/or speculate on a downside move have had ample time to do so, at their leisure

  4. a vicious cycle in which the less the VIX moves, the less valuable (reliable) it is as a hedge (or highly leveraged hedge)

If and when I can come up with a better answer to this question, I will cut in with a live feed from Volatility Central…

DISCLAIMER: "VIX®" is a trademark of Chicago Board Options Exchange, Incorporated. Chicago Board Options Exchange, Incorporated is not affiliated with this website or this website's owner's or operators. CBOE assumes no responsibility for the accuracy or completeness or any other aspect of any content posted on this website by its operator or any third party. All content on this site is provided for informational and entertainment purposes only and is not intended as advice to buy or sell any securities. Stocks are difficult to trade; options are even harder. When it comes to VIX derivatives, don't fall into the trap of thinking that just because you can ride a horse, you can ride an alligator. Please do your own homework and accept full responsibility for any investment decisions you make. No content on this site can be used for commercial purposes without the prior written permission of the author. Copyright © 2007-2023 Bill Luby. All rights reserved.
 
Web Analytics