Showing posts with label IYR. Show all posts

Friday, August 17, 2012

What If Stocks Decline?

Successful investors are the ones that are always making plans for all sorts of contingencies, so it stands to reason that they should even prepare themselves for the possibility of stocks actually declining one of these days...

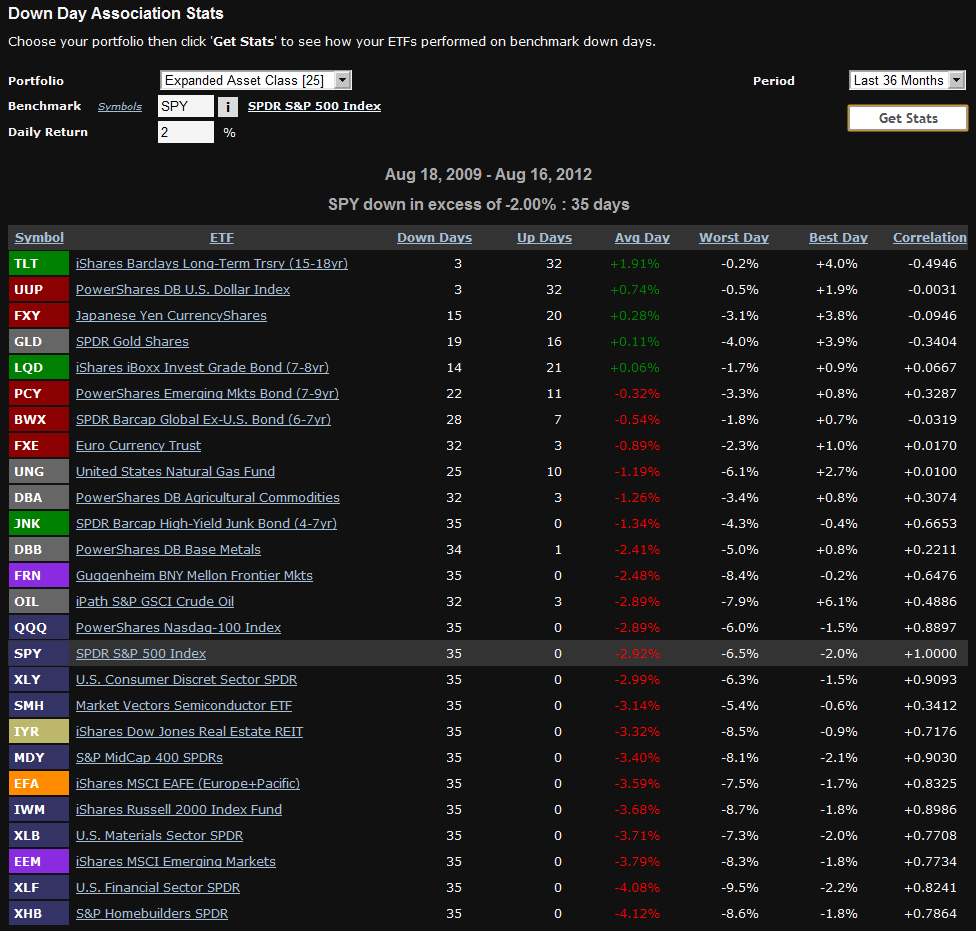
I was thinking about the coming correction in stocks and how to position my portfolio for that moment when equities once again feel the effects of gravity when I stumbled upon an interesting tool at ETFreplay.com that they call their Down Day Association Stats. In a nutshell, it looks at the performance of a group of user-specified exchange-traded products on those days in which a benchmark falls X%.

In the example below, I have chosen SPY as my benchmark, 2% (per day) as my threshold decline and 36 months as my lookback period. I looked at 25 ETPs that cover a wide range of asset classes and investment approaches.

Some of the results from the Down Day Association Stats are not particularly surprising. For instance, the long bond (TLT) and the dollar (UUP) have a strong negative correlation to stocks and generally perform well when SPY declines sharply. Some of the other bond choices (LQD, PCY, BWX) have been better at treading water than countertrending, but also show the benefits of diversification. The commodity choices were somewhat disappointing, generally managing to lose at best half as much as SPY, with crude oil almost matching the declines in the SPY to the penny.

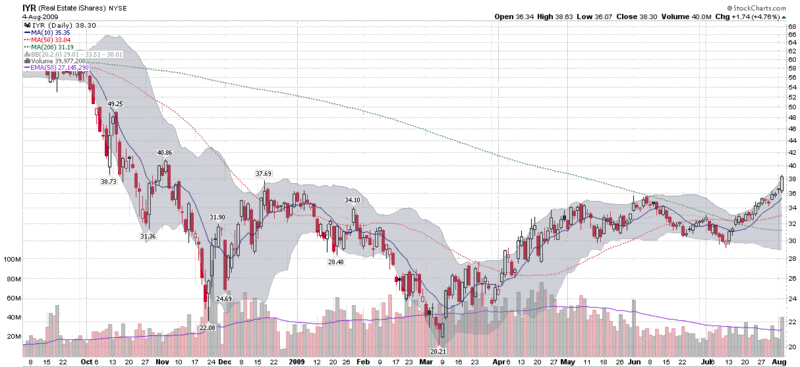
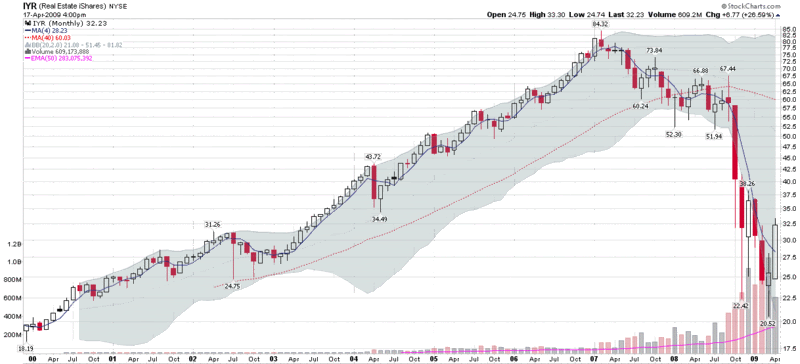
Among the data points that surprised me were that the frontier ETF (FRN) fared better than the SPY in big down days, while real estate (IYR) fared worse.

Of course every decline in stocks has a different set of catalysts and puts different stresses on different asset classes, sectors and geographies, but as stocks continue to grind higher, be sure to make preparations for that eventual pullback, because when it finally does arrive, it will likely do so at an inconvenient time and with surprising swiftness.

Related posts:

[source(s): ETFreplay.com]

Disclosure(s): long LQD at time of writing

Tuesday, August 4, 2009

Real Estate Breaks Out While the Major Indices Pause

A wave of buying in the last ten minutes pushed the major indices to small gains today, following a day of lackluster trading. Stocks caught a bid early in the session following the announcement of a 3.6% increase in pending home sales for the month of June. While the broad indices bounced around near the unchanged mark all day, real estate was strong throughout the day, with IYR, the popular real estate ETF, gaining 4.8% on the day.

The chart below shows today’s action constituted a breakout for IYR, which is now trading at levels not seen since early November. Today’s volume of on volume of 40 million shares was also the highest in more than two months.

Three subsector real estate ETFs posted even more impressive gains than IYR. The FTSE NAREIT Retail Capped Index Fund (RTL) gained 6.0%, while the FTSE NAREIT Industrial/Office Capped Index Fund (FIO) advanced 5.5% and the FTSE NAREIT Residential Plus Capped Index Fund (REZ) added 4.9%. For more on the holdings of these three ETFs, check out Three Commercial Real Estate Sub-Sectors to Watch.


[source: StockCharts]

Friday, May 22, 2009

Big Intraday Surge in VIX While SPX Treads Water

While I tend to shy away from talking too much about intraday moves in the VIX, today has been an unusual day in the VIX.

First, for most Fridays and particularly before long weekends, you should expect the VIX to be (a little more than 1.0%) lower than usual due to what I refer to as calendar reversion, when options are repriced with the assumption of lower volatility in advance of several non-trading days.

As I type this the VIX is almost flat, while all the major indices are in the green.

What is particularly interesting, however, is how the VIX has surged since about 1:00 p.m. ET. In the one minute intraday chart below, note the steady rise in the VIX over the course of the last hour or so, while the SPX has essentially moved sideways.

The action in the VIX could portend a rocky last hour or two or perhaps indicate that traders are becoming more concerned about holding long positions over the holiday weekend. Keep an eye on the VIX – and the weakness in real estate (IYR) and financials (XLF).

[source: BigCharts]

Disclosure: Short XLF, IYR and long VIX at time of writing.

Wednesday, April 29, 2009

Three Commercial Real Estate Sub-Sector ETFs to Watch

I plead guilty to treating commercial real estate as a single homogeneous entity in my two previous commercial real estate posts, Commercial Real Estate Problems Piling Up and Moodys/REAL Commercial Property Price Index.

The truth is that while there are a wide variety of REITs out there that span the full range of commercial real estate activity, my focus is mainly on ETFs and when it comes to ETFs, most of the popular real estate ETFs are of the large catchall variety, such as IYR, ICF, VNQ and RWR.

While I am not aware of any ETFs that are pure plays on shopping center REITs, office REITs or apartment REITs, there are three commercial real estate sub-sector REIT ETFs that can help sort through various sectoral trends within the REIT universe. The three sub-sector ETFs, with their allocations as of April 28th are as follows:

FTSE NAREIT Retail Capped Index Fund (RTL)

  • 52.28% Equity Shopping Centers
  • 35.85% Equity Regional Malls
  • 11.47% Equity Free Standing
  • 0.20% Short-Term Securities

FTSE NAREIT Industrial/Office Capped Index Fund (FIO)

  • 54.87% Equity Office
  • 26.92% Equity Industrial
  • 17.93% Equity Mixed

FTSE NAREIT Residential Plus Capped Index Fund (REZ)

  • 41.98% Equity Apartments
  • 39.02% Equity Health Care
  • 15.35% Equity Self Storage
  • 3.37% Equity Manufactured Homes
  • 0.07% Short-Term Securities

For the record, the limited liquidity for RTL and FIO makes them better indicators than trading vehicles, but REZ is actively traded.

As the chart below shows, the retail and industrial/office REIT ETFs have moved almost in lockstep in the post-Lehman world, while the residential ETF fared better in the downturn, but has been a little more sluggish during the bounce off of the March bottom.

[source: StockCharts.com]

Monday, April 20, 2009

Commercial Real Estate Problems Piling Up

Though it gets little in the way of airplay on the blog, real estate happens to be one of my favorite asset classes. It is volatile, can be highly leveraged and also provides what I call “use value,” meaning that it is not necessarily just a piece of paper you hope will appreciate, but can also be tangible property that you can get some enjoyment out of. For the same reason, I would much rather have a Miró hanging on my wall than an investment in an art ETF.

Getting back to real estate, I theorized in Waiting for the Next Shoe to Drop that either credit card debt or commercial real estate would be the most likely candidates to usher in the next leg of the financial crisis.

Moody’s recently reported that the U.S. credit card charge-off rate rose to a record 8.82% in February and noted that they expect charge-offs to hit a peak of 10.5% during the first half of 2010.

The ticking bomb of commercial real estate may have even more severe consequences as commercial real estate prices continue down over the course of the next few years. A week ago, Fil Zucchi did an excellent job of explaining the problems in commercial real estate at Minyanville in A Commercial Real Estate Comeback? and today he is back with a follow-up piece, Ten Reasons Why Commercial Real Estate Won’t Rebound.

There are many ways to play real estate. The double ETFs, URE (+2x) and SRS (-2x) are a good place to look for trading vehicles. For non-leveraged plays, IYR offers the best liquidity and an active options market to boot. Given the strength of the recent bounce in real estate stocks (more than 50% off of the recent bottom, as the chart below shows), I would favor the short side at least until I get a better sense of how the commercial real estate story will unfold.

[source: StockCharts]

Disclosure: Short IYR at time of writing.

Tuesday, January 6, 2009

Market Rewind on Risk

Since Joe Nocera, Michael Lewis and David Einhorn all had a chance to talk about risk in yesterday’s Required Reading segment, I thought it was timely of Jeff Pietsch at Market Rewind to pick this morning to offer up some of his thoughts on the subject of risk.

In ETF Risk in Review, Pietsch draws on data from his ETF Rewind tool to tackle the subject of risk-adjusted performance and ranks the 2008 performance of various ETFs within their grouping according to a Sortino Ratio (similar to the more familiar Sharpe Ratio, but the Sortino Ratio not penalize performance for upside volatility.) Not surprisingly, consumer staples (XLP) and health care (XLV) turn in the some of the best risk-adjusted performance numbers for 2008, while financials (XLF), emerging markets (EEM) and real estate (IYR) are notable laggards.

One key take away from the analysis is the value of thinking of ETFs in terms of miniature portfolios whose performance can be evaluated on a risk-adjusted basis. We witnessed history in 2008 and as painful as some of that history may have been to live through, hopefully we all enter 2009 with the benefit of a healthier and more sophisticated perspective on volatility and risk.

DISCLAIMER: "VIX®" is a trademark of Chicago Board Options Exchange, Incorporated. Chicago Board Options Exchange, Incorporated is not affiliated with this website or this website's owner's or operators. CBOE assumes no responsibility for the accuracy or completeness or any other aspect of any content posted on this website by its operator or any third party. All content on this site is provided for informational and entertainment purposes only and is not intended as advice to buy or sell any securities. Stocks are difficult to trade; options are even harder. When it comes to VIX derivatives, don't fall into the trap of thinking that just because you can ride a horse, you can ride an alligator. Please do your own homework and accept full responsibility for any investment decisions you make. No content on this site can be used for commercial purposes without the prior written permission of the author. Copyright © 2007-2023 Bill Luby. All rights reserved.
 
Web Analytics