Showing posts with label XLV. Show all posts

Sunday, December 13, 2009

Chart of the Week: A Month of New Sector Leadership

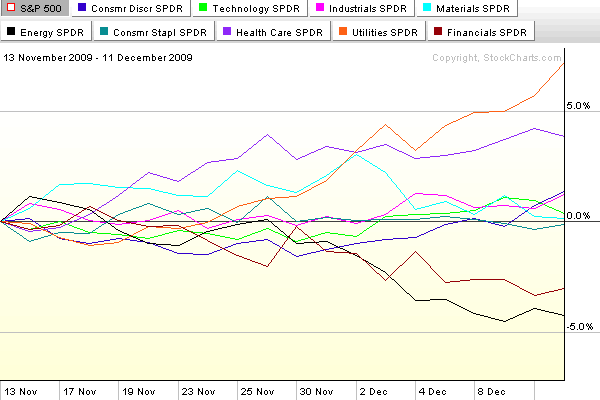
During the course of the past month or two, stocks have drifted sideways, lacking buying conviction and strong leadership.

In this week’s chart of the week below, I have tracked the performance of the nine AMEX sector SPDRs over the course of the past month. Note that former leaders financials (XLF) and energy (XLE) are now lagging, while defensive sectors such as utilities (XLU) and health care (XLV) are leading the way. Now I have nothing against utilities and health care, but the next time these two sectors lead a significant bull rally will be the first time in my memory. One or more of technology (XLK), consumer discretionary (XLY), materials (XLB) or perhaps financials needs to take a leadership role to give the next bullish leg the type of strength that portfolio managers can believe in.

A good defense may win championship, but it will not light a fire under potential buyers.

For more on related subjects, readers are encouraged to check out:

[source: StockCharts]

Disclosure: none
Sunday, October 11, 2009

Chart of the Week: Two Bull Legs and Counting…

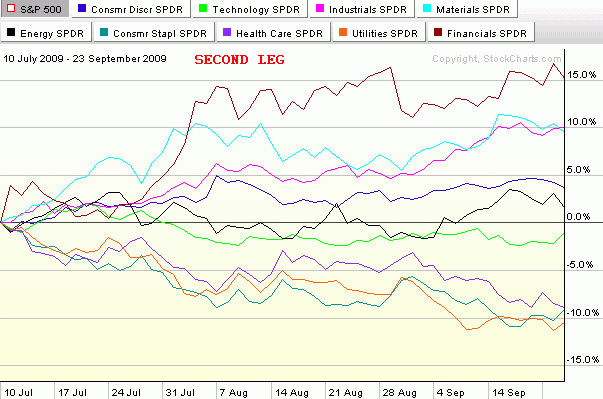
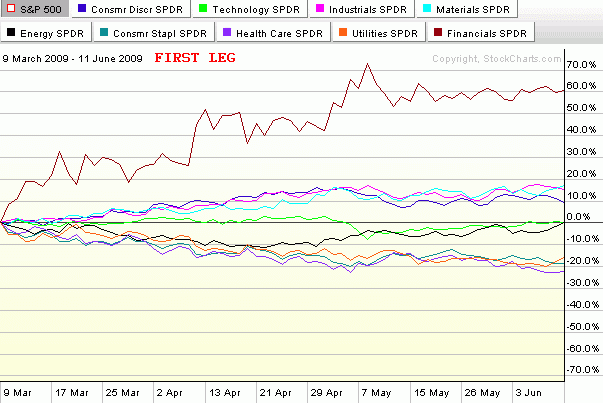
In the seven months since stocks bottomed and rallied some 61% (in the SPX) to current levels, there have been two distinct bull legs. The first leg began with the low close on March 9th (or intraday low on March 6th) and lasted just a little more than three months until the high close on June 11th. After a one month downturn, the second bull leg was launched on July 10th and persisted almost two and one half months until September 23rd. This time the pullback appears to have been more short-lived and has a provisional end date of October 2nd.

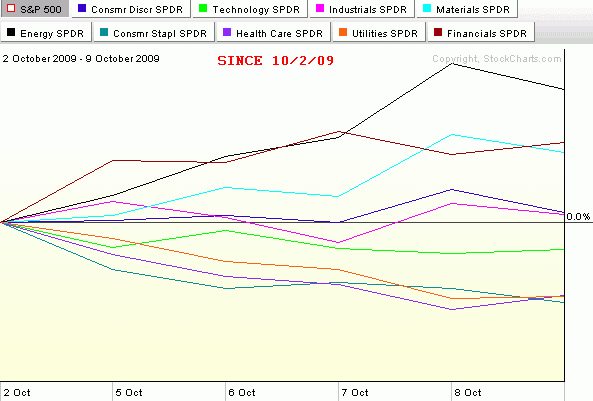
The three charts below – which collectively form this week's chart of the week – capture the sector performance relative to the SPX (the numbers are not in absolute terms) for the first two bull legs and also throws in the first week of what may turn out to be a third bull leg.

Note that in the first two bull legs, financials (XLF) were easily the top performing sector in both instances. Also, on both occasions it was the materials (XLB) and industrial (XLI) sectors that had clear separation from the rest of the sectors and were almost neck and neck for second and third. These three sectors clearly represent a top tier in terms of performance during the most pronounced 2009 bull moves. A second tier of consumer discretionary (XLY), technology (XLK) and energy stocks (XLE) has generally performed slightly above the baseline SPX. The bottom tier consists of three defensive sectors that typically only outperform the SPX in market downturns. In fact, these three sectors, health care (XLV), consumer staples (XLP) and utilities (XLU), were the top three performers during the June 11th to July 10th pullback.

Just for fun, I have added the last week of performance in the bottom chart. It is too early to draw conclusions for one week of upward movement, but so far the leading sector for October is energy. If the markets are to continue to set new highs for 2009, a big question will be whether the same sectors continue to lead or whether new leadership emerges. Personally, I do not expect that the same performance hierarchy that has characterized the last two bull legs to continue during the next month or two of upward moves. In fact, I would expect leadership to shift to the second tier in the form of technology, energy or consumer discretionary stocks. No matter what happens, it will be interesting to see how the broader market performs if financials start to lag the other sectors.

[source: StockCharts]

Sunday, July 19, 2009

Chart of the Week: SPX and NDX

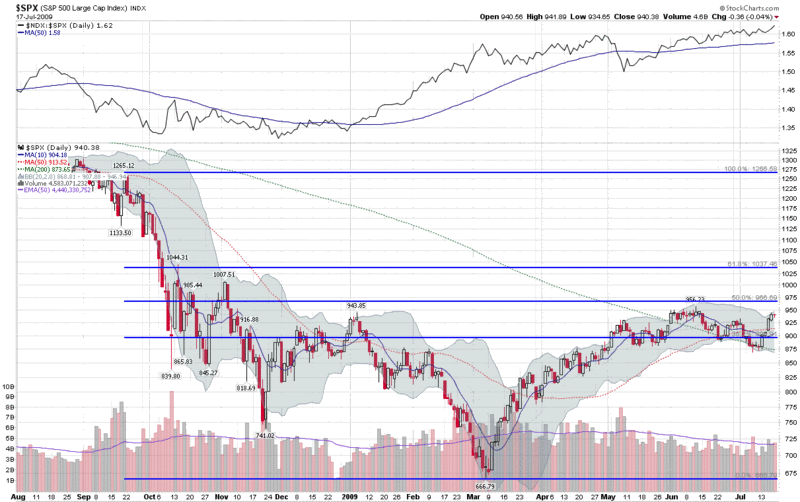
In reviewing previous chart of the week graphics, I was surprised to see that I have featured a chart of the SPX only once in the past five months (Chart of the Week: Lack of Volume and Breadth Threatens Bull Move) and decided that this most important of indices needs to take center stage more often.

Alas, this week’s chart of the week shows a year of SPX daily bars, with some standard moving averages and Bollinger Bands, as well as a set of Fibonacci retracement lines that have generated considerable discussion in the past (SPX and Fibonacci Resistance at 966.) The new twist on this chart is a simple ratio of the NASDAQ-100 (NDX) to the SPX, which is included as a study above the main graph. The NDX:SPX ratio shows that while the SPX was retreating from its June 12th high, the NDX was outperforming the SPX on a relative basis, as has been the case for the past two months. Spurred on by a very strong earnings report from Intel (INTC) the NDX:SPX ratio is currently at its highest level since early 2001 and the NDX is now comfortably above its June high.

It is worth noting that outside of technology, the only other major sector to have topped its June high is health care (XLV) with consumer staples (XLP) just 0.03 below that high water mark. With the leadership role of technology should be considered a positive sign for bulls, the high relative strength of defensive sectors such as health care and consumer staples might be considered a warning sign.

For a related prior chart of the week post, see: Chart of the Week: The Resurgent NASDAQ-100 (4/5/2009)

[graphic: StockCharts]

Tuesday, January 6, 2009

Market Rewind on Risk

Since Joe Nocera, Michael Lewis and David Einhorn all had a chance to talk about risk in yesterday’s Required Reading segment, I thought it was timely of Jeff Pietsch at Market Rewind to pick this morning to offer up some of his thoughts on the subject of risk.

In ETF Risk in Review, Pietsch draws on data from his ETF Rewind tool to tackle the subject of risk-adjusted performance and ranks the 2008 performance of various ETFs within their grouping according to a Sortino Ratio (similar to the more familiar Sharpe Ratio, but the Sortino Ratio not penalize performance for upside volatility.) Not surprisingly, consumer staples (XLP) and health care (XLV) turn in the some of the best risk-adjusted performance numbers for 2008, while financials (XLF), emerging markets (EEM) and real estate (IYR) are notable laggards.

One key take away from the analysis is the value of thinking of ETFs in terms of miniature portfolios whose performance can be evaluated on a risk-adjusted basis. We witnessed history in 2008 and as painful as some of that history may have been to live through, hopefully we all enter 2009 with the benefit of a healthier and more sophisticated perspective on volatility and risk.

Tuesday, September 2, 2008

August Sector Recap

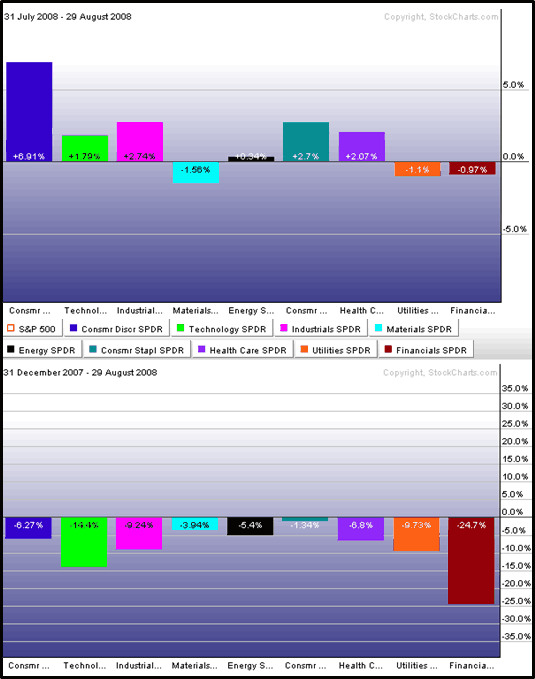
August was a month in which the S&P 500 largely drifted sideways, but there was a good deal going on in the various sectors that make up the index. The graphic below shows sector performance for the nine sector SPDRs for the first eight months of 2008 (bottom) and for the month August (top).

On the plus side, the turnaround in the consumer discretionary sector (XLY) is clearly responsible for much of the recent positive momentum in the SPX. Also worth noting is that four other sectors outperformed the index in August: consumer staples (XLP), health care (XLV), industrials (XLI), and technology (XLK).

As has often been the case during the past few months, when the SPX has been moving up, energy (XLE) and materials (XLB) have been moving in the opposite direction. In August, the financial sector (XLF) was also pulling the index in the wrong direction.

Watch the consumer for more clues about sector leadership and overall market strength in the month of September.


[source: StockCharts]

Sunday, April 8, 2007

NTY Replaced by WCG at Portfolio A1

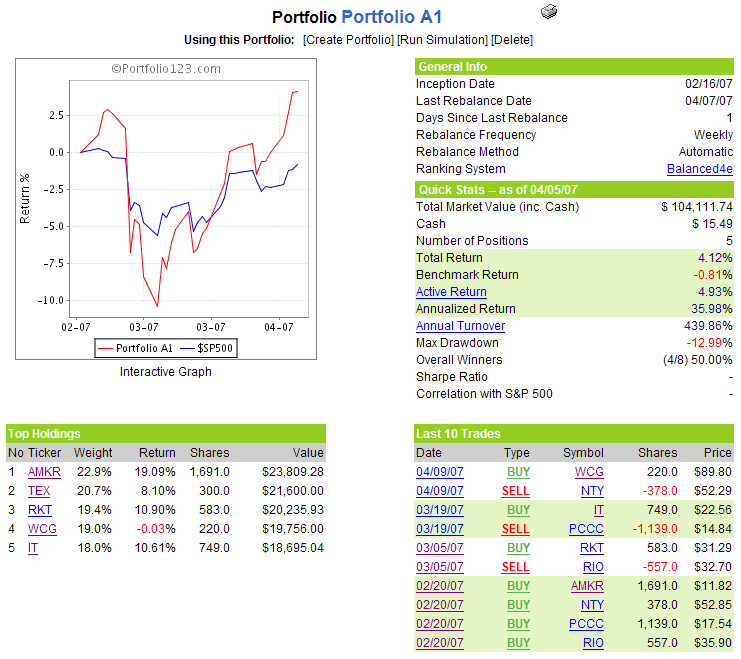
Every once in awhile, a mechanical system does what the muzzled discretionary has secretly been hoping for all along. In this case, I got my wish and Portfolio A1 has dropped NTY and replaced it with WCG, the portfolio’s first foray into health care, a sector that has been performing exceptionally well as of late, as reflected in the XLV ETF, among other barometers.

NTY has been the one laggard in this portfolio, despite the recent run-up associated with possible buyout rumors. Generally, the discretionary trader in me looks to sell long positions on buyout rumors, but in this case Portfolio A1’s stock ranking algorithm dropped NTY due to poor performance relative to the other holdings and to WCG. A close look at the WCG chart shows that the stock’s price action strongly resembles that of a airplane taking off, as the stock as steadily gained altitude in the course of tripling from November 2005 to the present.

Apart from dropping NTY and adding WCG, there are no changes to the portfolio for the coming week.

A snapshot of the portfolio, which now has a solid 5% advantage over the benchmark S&P 500 index, is as follows:

(In other portfolio news, I have slipped to #3846 in the CNBC Million Dollar Portfolio Challenge. This is still in the top 1%, but below my ranking from last Wednesday and still some $700,000 out of the top 20. The good news is that earnings season is beginning this coming week – and with it some opportunities to take some big chances and make some big moves. Hey, if Zach Johnson can win the Masters, anything is possible!)

DISCLAIMER: "VIX®" is a trademark of Chicago Board Options Exchange, Incorporated. Chicago Board Options Exchange, Incorporated is not affiliated with this website or this website's owner's or operators. CBOE assumes no responsibility for the accuracy or completeness or any other aspect of any content posted on this website by its operator or any third party. All content on this site is provided for informational and entertainment purposes only and is not intended as advice to buy or sell any securities. Stocks are difficult to trade; options are even harder. When it comes to VIX derivatives, don't fall into the trap of thinking that just because you can ride a horse, you can ride an alligator. Please do your own homework and accept full responsibility for any investment decisions you make. No content on this site can be used for commercial purposes without the prior written permission of the author. Copyright © 2007-2023 Bill Luby. All rights reserved.
 
Web Analytics