Showing posts with label INTC. Show all posts

Sunday, July 19, 2009

Chart of the Week: SPX and NDX

In reviewing previous chart of the week graphics, I was surprised to see that I have featured a chart of the SPX only once in the past five months (Chart of the Week: Lack of Volume and Breadth Threatens Bull Move) and decided that this most important of indices needs to take center stage more often.

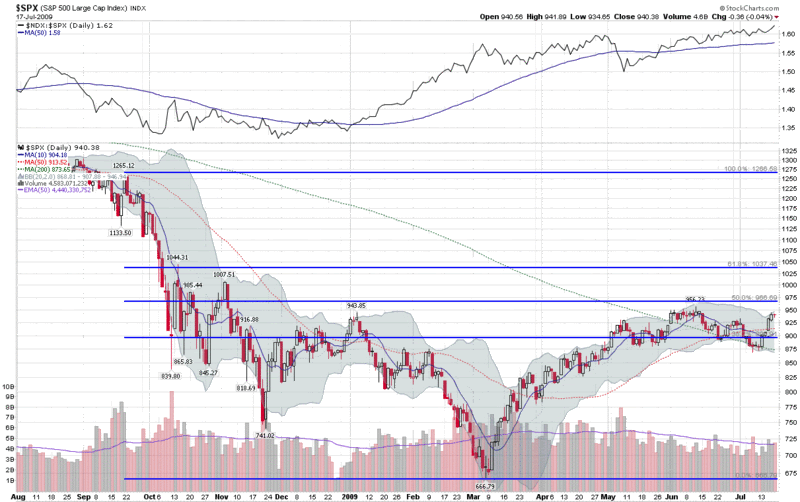
Alas, this week’s chart of the week shows a year of SPX daily bars, with some standard moving averages and Bollinger Bands, as well as a set of Fibonacci retracement lines that have generated considerable discussion in the past (SPX and Fibonacci Resistance at 966.) The new twist on this chart is a simple ratio of the NASDAQ-100 (NDX) to the SPX, which is included as a study above the main graph. The NDX:SPX ratio shows that while the SPX was retreating from its June 12th high, the NDX was outperforming the SPX on a relative basis, as has been the case for the past two months. Spurred on by a very strong earnings report from Intel (INTC) the NDX:SPX ratio is currently at its highest level since early 2001 and the NDX is now comfortably above its June high.

It is worth noting that outside of technology, the only other major sector to have topped its June high is health care (XLV) with consumer staples (XLP) just 0.03 below that high water mark. With the leadership role of technology should be considered a positive sign for bulls, the high relative strength of defensive sectors such as health care and consumer staples might be considered a warning sign.

For a related prior chart of the week post, see: Chart of the Week: The Resurgent NASDAQ-100 (4/5/2009)
[graphic: StockCharts]

Wednesday, July 15, 2009

Some Thoughts on Current Volatility

Being a West Coast guy, I often find myself three hours behind the rest of the blogging world when I stumble out of bed. Once or twice a year, I manage to sleep through the open and generally spend the rest of the day playing catch-up, as has been the case today. Now that I am mostly coherent and have digested the bulk of the news and market movements for the first three hours of today’s session, let me offer some comments.

While stocks are enjoying an Intel (INTC) inside jump, the VIX is up a shade as I type this, seemingly intent on staying above the 25.00 level. On the other hand, three of other major market index volatility measures I follow (VXN, RVX and VXD) are all down in the 5-7% range for the day. The outlier among the secondary volatility indices is VXO, the volatility index for the S&P 100 index (OEX), which is only down about 2% on the day. (I am not sure exactly how to parse this information, but with the meat of second quarter earnings season just around the corner and options expiration only two days away, I would not be surprised to learn that portfolio managers are looking to lock in some profits and add some additional downside protection.)

In the last day or two, a number of other bloggers have commented up on the volatility premium issue. In VIX Predicting the Future…and It’s Cloudy, Jason Goepfert of Sentiment’s Edge has an excellent chart of the premium of the front-month VIX futures to the spot VIX index and points out that a high premium has lately been bearish for stocks. Adam Warner of Daily Options Report picks up the premium theme in While We Were Churning…… as does the Decline and Fall of Western Civilization blog in Volatility Curve Warning Again.

The premise is exactly the same reasoning as is behind the VIX:VXV ratio and the VXX:VXZ ratio: when short-term volatility measures become substantially out of line with longer-term volatility measures, the divergence is most likely to be resolved by the short-term measure ‘correcting’ in the direction of the longer-term measure. With the VIX:VXV ratio recently hovering around 0.85, this means a VIX spike is more likely to take the ratio back toward equilibrium than a substantial drop in the VXV index. By the same token, VXX and VXZ are more likely to converge as a result of a jump in VXX than a decline in VXZ. Of course, the numerator and denominator can always converge at the same rate, but that type of resolution seems to be relatively rare.

For those who may be interested, my various estimates of fair value for the VIX are largely in the range of about 28-29 at the moment, suggesting that short-term volatility is due for a bounce soon.

As a reminder, anyone wishing to speculate on the VIX using options and futures should note that VIX options expire next Wednesday (July 22), with the last day of trading on Tuesday.

Sunday, April 5, 2009

Chart of the Week: The Resurgent NASDAQ-100

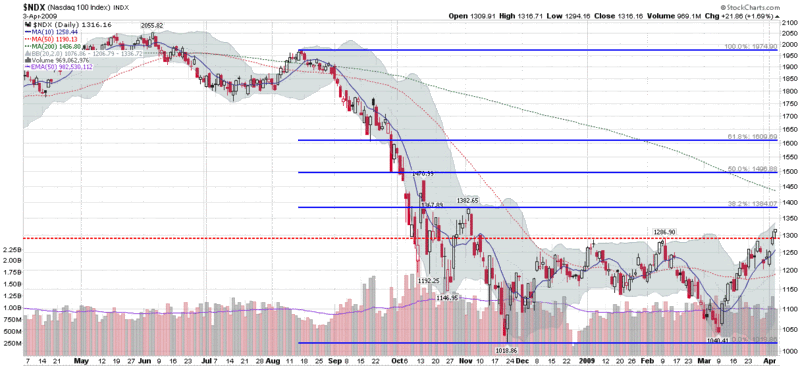
Technology is back and large cap technology is helping to lead the recent rebound in equities.

Even after a four week rally, 2009 has been mostly a sea of red. In fact, the two headline indices, the Dow Jones Industrial Average and S&P 500 index, are down 8.65% and 6.73% so far in 2009. Neither large caps nor small caps are performing particularly well, with the large cap S&P 100 (OEX) down 8.27% and the small cap Russell 2000 (RUT) down 8.67% year to date.

The technology-heavy NASDAQ has been a very different story, with both the NASDAQ composite index (+2.84%) and NASDAQ-100 (+8.63%) in the green.

In the chart of the week below, I have highlighted the NASDAQ-100 index (NDX), which closed at its highest level since early November on Friday, following a strong earnings report and increased guidance from Research in Motion (RIMM). The NDX is a weighted index of the largest 100 companies in the NASDAQ, as measured by market capitalization. As such, the largest weightings read like a who’s who list of large technology companies: Microsoft (MSFT); Google (GOOG); Cisco (CSCO); Apple (AAPL); Oracle (ORCL); Intel (INTC); Qualcomm (QCOM); etc.

Whether or not the resurgent NDX can continue to rally and retrace its steep drop from September and October will go a long way toward determining if the broader markets will be able to gain enough momentum to also finish 2009 in the green.


[source: StockCharts]

Thursday, December 11, 2008

Where Is the Leadership in this Rally?

For the last three weeks, I have been impressed by the confidence and resolve shown by the bulls as they have consistently used pullbacks to flood the market with new long positions. Perhaps algorithms have no fear

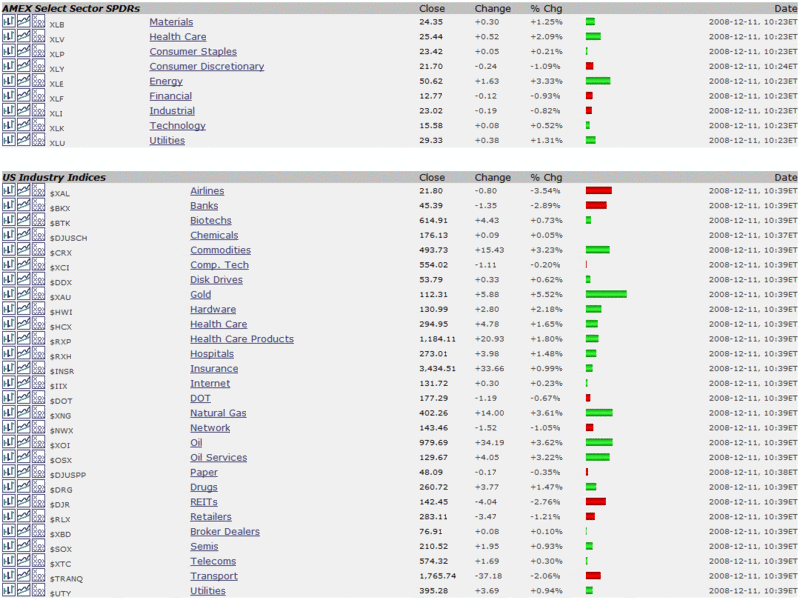
More recently, however, as the bull leg has stalled around the SPX 900 mark, I have found myself thinking about the lack of ‘proper’ leadership. Yesterday and today, the rallies have been led by commodities, with gold and energy equities the top performers.

At the same time, the three sectors I think are most critical to the recovery, my so-called ‘indicator species’ sectors (financials, homebuilders and consumer discretionary stocks), have been unable to get out of the red today.

I am not sure where the leadership will come from that will eventually push the SPX back over 1000. Today large cap technology names First Solar (FSLR), Apple (AAPL), Dell (DELL), Research in Motion (RIMM), eBay (EBAY) and Intel (INTC) are all strong performers. Frankly, I would expect technology to play a strong role in the next big leg up, but leadership may come from a number of other sectors.

There are few guarantees in the stock market, but I can guarantee that gold and energy are not going to pull the SPX up over the 1000 mark and leave financials (XLF), homebuilders (XHB), and consumer discretionary stocks (XLY) behind.

[source: StockCharts]

DISCLAIMER: "VIX®" is a trademark of Chicago Board Options Exchange, Incorporated. Chicago Board Options Exchange, Incorporated is not affiliated with this website or this website's owner's or operators. CBOE assumes no responsibility for the accuracy or completeness or any other aspect of any content posted on this website by its operator or any third party. All content on this site is provided for informational and entertainment purposes only and is not intended as advice to buy or sell any securities. Stocks are difficult to trade; options are even harder. When it comes to VIX derivatives, don't fall into the trap of thinking that just because you can ride a horse, you can ride an alligator. Please do your own homework and accept full responsibility for any investment decisions you make. No content on this site can be used for commercial purposes without the prior written permission of the author. Copyright © 2007-2023 Bill Luby. All rights reserved.
 
Web Analytics