Showing posts with label VXD. Show all posts

Monday, July 12, 2010

Unusual Volatility Index Divergence

Since I have not seen this mentioned elsewhere, I thought I should point out that there was an interesting and very unusual divergence in the major U.S. volatility indices today. As the chart below shows, both VXO and RVX posted substantial gains, up 5.7% and 4.5% respectively. The other three major volatility indices declined, with VXN down 1.9%, VIX down 2.2% and VXD down 3.6%.

With no obvious gaps in any of the charts nor a single index outlier, there are no obvious signs of bad data at work. While correlations among these five indices run in the 97% - 99% range and divergences are largely accounted for by different market capitalizations, the fact that the two gainers were the large cap VXO and the small cap RVX makes today's numbers particularly difficult to explain.

Frankly, I am a loss for a good way to account for the discrepancy. The drop in the VIX futures and VIX ETNs (VXX and VXZ) suggests to me that perhaps VXO and RVX were hit with a similar technical glitch, but I have not seen any public statement to support this.

Anyone care to venture an explanation?

For more on related subjects, readers are encouraged to check out:


[source: Yahoo.com]

Disclosure(s): neutral position via options in VIX at time of writing

Friday, July 31, 2009

Is the VIX Being Gamed?

In Fear Index Now Inverse to VIX, Zero Hedge recently put forth the idea that the VIX is “being gamed by volatility sellers” and may be “the most behind the scenes manipulated index.”

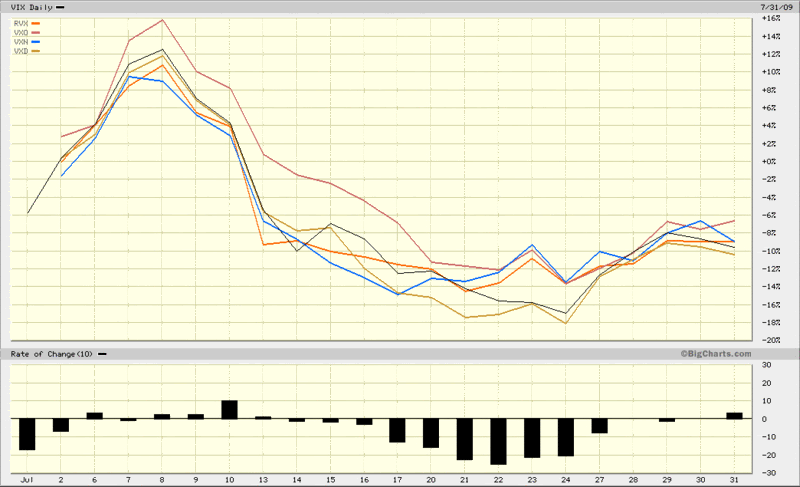
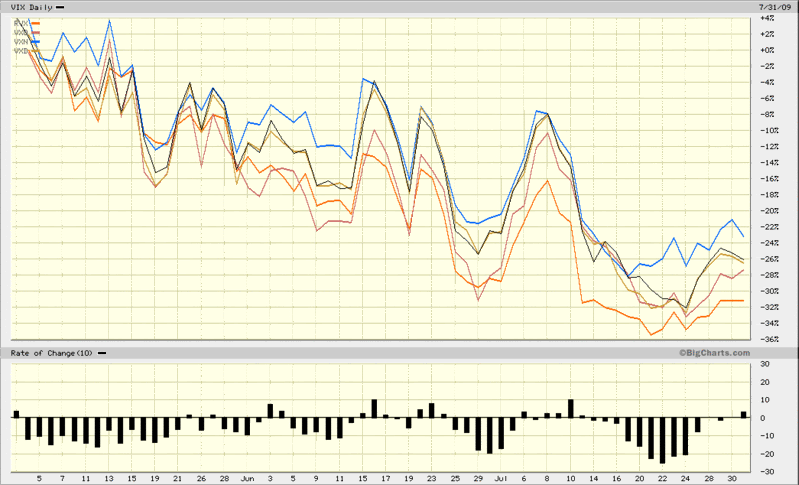
Several readers have asked me to comment on this. In short, I do not believe the VIX is being gamed to any significant extent. Among the volatility data I watch are the correlations across the various major volatility indices, including the VIX, VXN (for the NASDAQ-100), RVX (for the Russell 2000), VXO (for the S&P 100 index) and VXD (for the Dow Jones Industrial Average.) Historically, the lowest of these correlations has been the two market cap extremes, a 97% correlation between the RVX and the VXO. Frankly, I have not seen much of a deviation from historical patterns over the course of the past few weeks. The charts below show all five volatility indices over the course of the past one month (top) and three months (bottom). If there is any evidence to support the VIX as deviating from the other volatility indices, I don’t see it.

Note that because the VXO does not have any options or futures associated with it, gaming that volatility index would likely be the most difficult and expensive of the group. Also consider that because the components of the VXO have the largest market caps of any of the volatility indices, one would expect changes in the VXO to be less dramatic than those of the other indices that are populated by smaller and more volatile companies.

For related posts on the other secondary volatility indices, try:


[source: BigCharts]

Disclosure: Long VIX at time of writing.

Wednesday, July 15, 2009

Some Thoughts on Current Volatility

Being a West Coast guy, I often find myself three hours behind the rest of the blogging world when I stumble out of bed. Once or twice a year, I manage to sleep through the open and generally spend the rest of the day playing catch-up, as has been the case today. Now that I am mostly coherent and have digested the bulk of the news and market movements for the first three hours of today’s session, let me offer some comments.

While stocks are enjoying an Intel (INTC) inside jump, the VIX is up a shade as I type this, seemingly intent on staying above the 25.00 level. On the other hand, three of other major market index volatility measures I follow (VXN, RVX and VXD) are all down in the 5-7% range for the day. The outlier among the secondary volatility indices is VXO, the volatility index for the S&P 100 index (OEX), which is only down about 2% on the day. (I am not sure exactly how to parse this information, but with the meat of second quarter earnings season just around the corner and options expiration only two days away, I would not be surprised to learn that portfolio managers are looking to lock in some profits and add some additional downside protection.)

In the last day or two, a number of other bloggers have commented up on the volatility premium issue. In VIX Predicting the Future…and It’s Cloudy, Jason Goepfert of Sentiment’s Edge has an excellent chart of the premium of the front-month VIX futures to the spot VIX index and points out that a high premium has lately been bearish for stocks. Adam Warner of Daily Options Report picks up the premium theme in While We Were Churning…… as does the Decline and Fall of Western Civilization blog in Volatility Curve Warning Again.

The premise is exactly the same reasoning as is behind the VIX:VXV ratio and the VXX:VXZ ratio: when short-term volatility measures become substantially out of line with longer-term volatility measures, the divergence is most likely to be resolved by the short-term measure ‘correcting’ in the direction of the longer-term measure. With the VIX:VXV ratio recently hovering around 0.85, this means a VIX spike is more likely to take the ratio back toward equilibrium than a substantial drop in the VXV index. By the same token, VXX and VXZ are more likely to converge as a result of a jump in VXX than a decline in VXZ. Of course, the numerator and denominator can always converge at the same rate, but that type of resolution seems to be relatively rare.

For those who may be interested, my various estimates of fair value for the VIX are largely in the range of about 28-29 at the moment, suggesting that short-term volatility is due for a bounce soon.

As a reminder, anyone wishing to speculate on the VIX using options and futures should note that VIX options expire next Wednesday (July 22), with the last day of trading on Tuesday.

Thursday, October 9, 2008

New Record Close for Volatility Indices


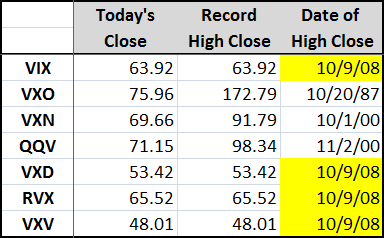
Today’s dramatic last hour selloff resulted in new record high closes in four of the seven major U.S. volatility indices, including the VIX, which exceeded 60 for the first time and established a new record close of 63.92. In addition to the VIX, the VXD (CBOE DJIA Volatility Index) and the RVX (CBOE Russell 2000 Volatility Index) also set new records.

Note that these volatility indices have different life spans and data histories, so the comparisons of all-time record highs across indices are not always particularly relevant. For more information on all of the volatility indices, try Overview of U.S. Volatility Indices.

Tuesday, August 5, 2008

Overview of the U.S. Volatility Indices

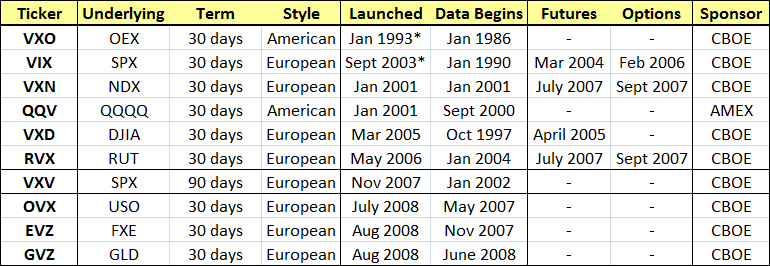
As a companion to yesterday’s The Evolution of the Volatility Index Family Tree post, I thought it might be helpful to include a comparative look at the major U.S. volatility indices, which is what the table below hopes to accomplish.

The main distinguishing factor for these indices is whether or not futures and options are available as a means to trade the underlying. It is also important to note not just the launch date for the index, but also the period for which historical data are available. In some cases (e.g., VIX, VXO, VXD), this extends back several years prior to the official index launch.

Two of the indices stand out from the crowd for a particular unique characteristic: the QQV is the only volatility index that is sponsored by the American Stock Exchange (AMEX); and the VXV is the only index that has a 93 day time horizon rather than the standard 30 days.

Finally, I have covered this in several on the blog, but those who are interested in why there is an asterisk for the VIX and VXO launch dates should be aware that the calculation methodology for the ‘original VIX’ (VXO) was overhauled in 2003, at which point the original methodology was preserved under a new VXO ticker and the new methodology was applied to the VIX ticker. Some additional details are available in Ten Things Everyone Should Know About the VIX.

Wednesday, May 28, 2008

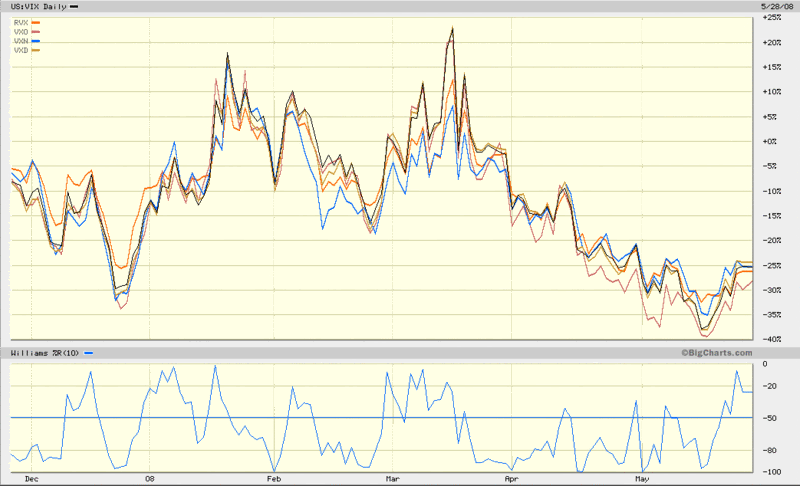
Comparative Volatility Indices

I am a strong believer in simplifying life – and one’s approach to investing – as much as possible. Less is more.

With that thought in mind, I pulled up a six month chart of the five major US volatility indices: VIX, VXO, VXN, RVX, and VXD. The chart, which comes courtesy of BigCharts, shows that over the past six months, the difference between the volatility indices are no more than subtle nuances. Keep in mind that during this period, the financial sector was extremely hard hit. Moreover, financials are overrepresented in the VIX and VXO, underrepresented in the RVX, and absent from the VXN. The sector distinction is all but lost in the charts (except perhaps from mid-February to mid-March) and if there were ever a time for the indices to diverge in a meaningful way, this was it.

The bottom line is that for most market observers, it makes sense to follow only the VIX. Volatility aficionados may also choose to follow the VXN, but after adding a second volatility index to one’s radar, the incremental return on effort and complexity diminishes rapidly.

When there are important divergences between these indices, I will be quick to point these out, but for the most part, expect my comments about the VIX to apply to the entire volatility index family tree as a whole.

Friday, September 7, 2007

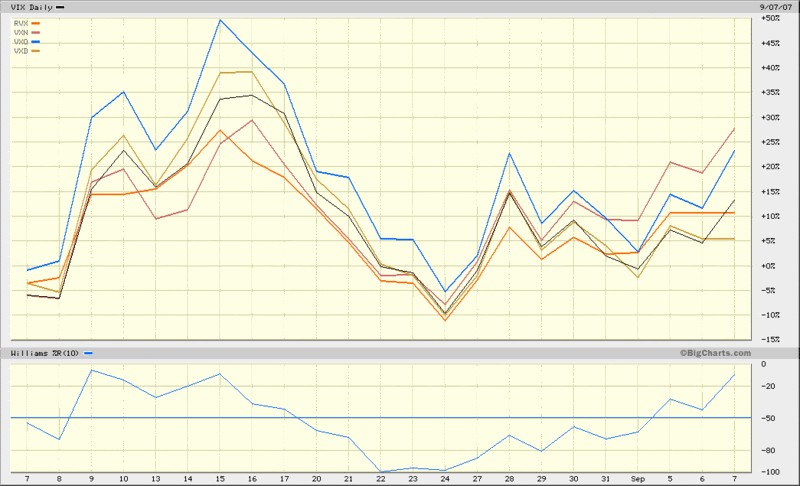
Volatility Index Comparison

I last put up a chart of the five US equity volatility indices in mid-March, following the February 27th VIX spike. Now that we also have about three weeks following the VIX spike, I thought I might put up a similar chart of the volatility indices for the recent market action.

The recent volatility spike (top chart) shows VXO once again leading the charge upward, with VXN the laggard -- just as was the case in March. Interestingly, during the secondary surge in volatility over the past two weeks or so, the VXN has been the most sensitive.

With VXN and RVX options just around the corner, the relative movements of these volatility indices are becoming increasingly more interesting (and important) to watch.


Friday, March 16, 2007

Meet the Spikers

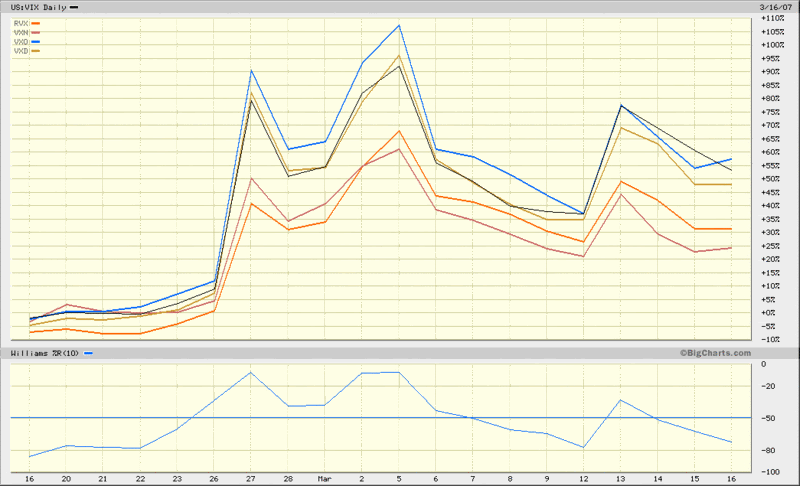
Quadruple witching day seems like as good a day as any to meet the family. Having already introduced VDAX, the VIX’s German cousin, today we look at the US relatives. First, the handy chart:

Due to marriages, divorces, name changes and the like, a more detailed look at the US extended family can get complicated, but here are the five key players, roughly in order of their current significance in the markets:

VIX – measures implied volatility for S&P 500 (SPX) options for all near term at-the-money SPX puts and calls and out-of-the-money puts and calls. Deep-in-the-money options are excluded. The current methodology has been in use since 9/22/03. The VIX was officially introduced on 4/1/93, but the CBOE has calculated synthetic historical VIX data going back to the beginning of 1990.

VXN – measures implied volatility for the Nasdaq 100 (NDX) options for all near term at-the-money NDX puts and calls and out-of-the-money puts and calls. Deep-in-the-money options are excluded. The current methodology has been in use since 9/22/03; the index was originally introduced on 1/22/01.

VXO – is calculated by taking the weighted average of the implied volatility of 8 S&P 100 OEX calls and puts with an average time to expiration of 30 days. Note that this is the methodology that was used to calculate the VIX prior to 9/22/03. On that date, the method used to calculate the VIX was changed and a new ticker symbol and name was introduced to provide continuity with the historical method of calculating the "old VIX" prior to 9/22/03.

From the CBOE site:

"VIX measures market expectation of near term volatility conveyed by stock index option prices. The original VIX was constructed using the implied volatilities of eight different OEX option series so that, at any given time, it represented the implied volatility of a hypothetical at-the-money OEX option with exactly 30 days to expiration.

The New VIX still measures the market's expectation of 30-day volatility, but in a way that conforms to the latest thinking and research among industry practitioners. The New VIX is based on S&P 500 index option prices and incorporates information from the volatility ‘skew’ by using a wider range of strike prices rather than just at-the-money series."

VXD – measures implied volatility for the Dow Jones Industrial Average options for all near term at-the-money DJIA puts and calls and out-of-the-money puts and calls. Deep-in-the-money options are excluded. Introduced on 4/25/05.

RVX – measures implied volatility for the Russell 2000 (RUT) options for all near term at-the-money NDX puts and calls and out-of-the-money puts and calls. Deep-in-the-money options are excluded. Introduced on 5/5/06.

While there is a very high degree of correlation among the volatility indices, like any family, this family does not always move in lockstep fashion, as the graph below demonstrates. In the coming weeks, I will talk more about divergence among the volatility indices and attempt to provide a framework for interpreting them.
DISCLAIMER: "VIX®" is a trademark of Chicago Board Options Exchange, Incorporated. Chicago Board Options Exchange, Incorporated is not affiliated with this website or this website's owner's or operators. CBOE assumes no responsibility for the accuracy or completeness or any other aspect of any content posted on this website by its operator or any third party. All content on this site is provided for informational and entertainment purposes only and is not intended as advice to buy or sell any securities. Stocks are difficult to trade; options are even harder. When it comes to VIX derivatives, don't fall into the trap of thinking that just because you can ride a horse, you can ride an alligator. Please do your own homework and accept full responsibility for any investment decisions you make. No content on this site can be used for commercial purposes without the prior written permission of the author. Copyright © 2007-2023 Bill Luby. All rights reserved.
 
Web Analytics