Showing posts with label VXV. Show all posts

Thursday, October 24, 2013

The New VXST and the VXST:VIX Ratio

At the beginning of the month several interesting announcements came out of the CBOE Risk Management Conference in Portugal. One which particularly caught my interest was the announcement of the launch of the new CBOE Short-Term Volatility Index (VXST), which is essentially identical to the VIX, except that whereas the VIX is looking ahead at a window of 30 calendar days, the VXST measures implied volatility of options on the S&P 500 index (SPX) for the next 9 calendar days.

This means that the CBOE now has three different indices to measure implied volatility expectations in SPX options:

  • 9 days (VXST)
  • 30 days (VIX)
  • 93 days (VXV)

The VXV has been a favorite subject of mine going back to my initial comments on the index and the VIX:VXV ratio I pioneered as an indicator back in December 2007. With the new VXST, investors now have a better gauge of volatility expectations to apply to time frames that are appropriate for weekly options, which are on track to account for about 25% of all options trades by the end of the year.

The launch of VXST options opens up a whole new set of possibilities, not the least of which is a VXST:VIX ratio that offers some possibilities as an indicator that are similar to those of the VIX:VXV ratio. In the chart below, I have mapped not the ratio of VXST:VIX, but the differential between the two indices. With VXST historical data going back to the beginning of 2011, it is worth noting that the VIX has been higher than VXST about 61% of the time. Typically, when volatility spikes, VXST spikes much higher than the VIX, with the bulk of the 39% of the instances in which VXST is higher than VIX occurring mostly during periods of elevated volatility.
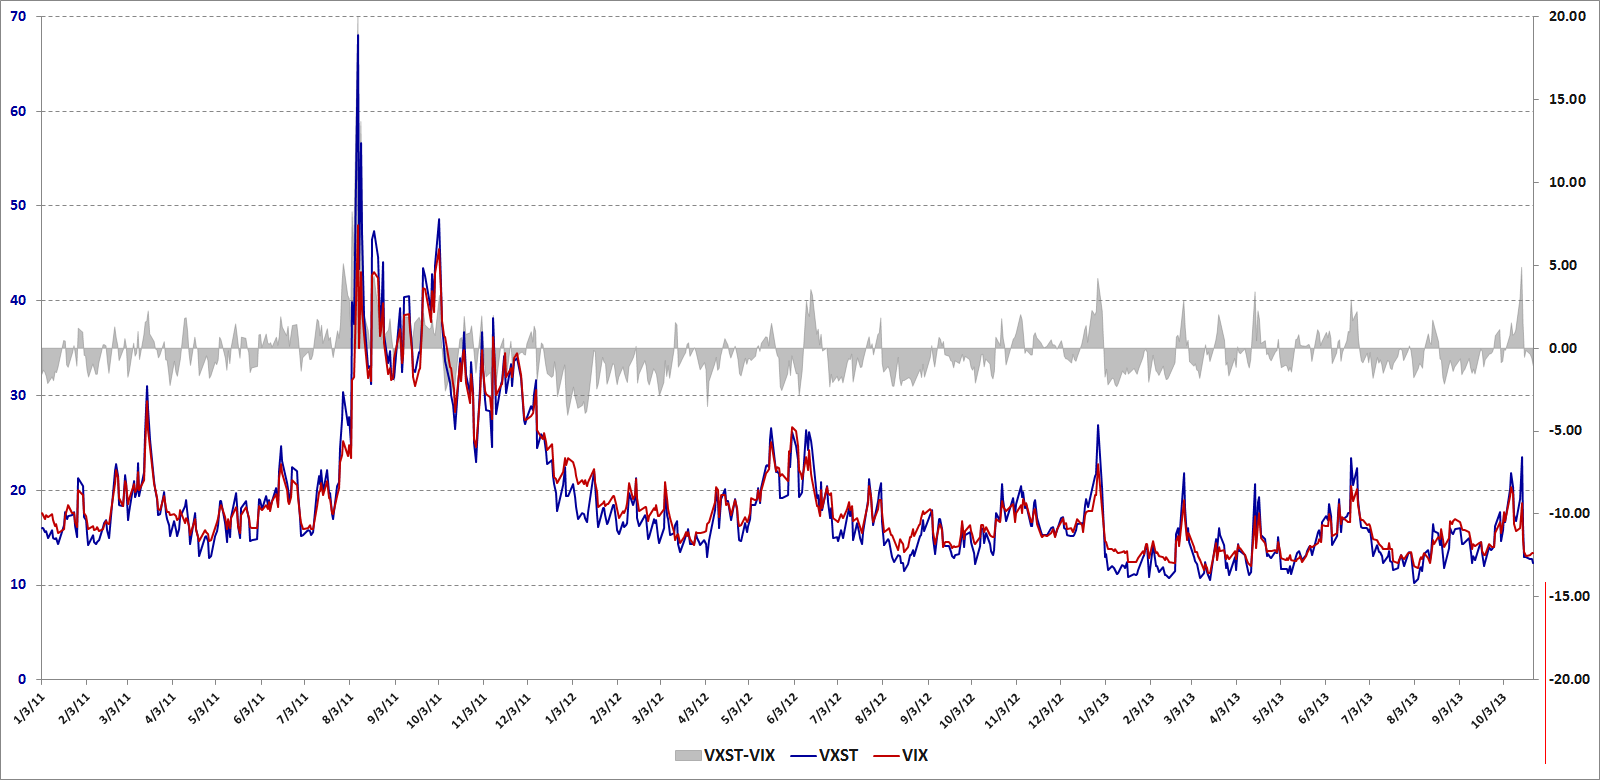
[source(s): CBOE, VIX and More]

I will go into much greater detail regarding VXST:VIX vs. VIX:VXV at a later point. For now it is worth noting that these ratios have some advantage to comparing the VIX futures term structure in that the indices focus on a fixed time period, while the days to expiration of the VIX futures is constantly in flux.

Also of interest, the CBOE press release notes:

“Plans call for CBOE and CBOE Futures Exchange, LLC (CFE®) to introduce VXST Weeklys options and futures. The launch dates for these tradable VXST products are yet to be determined, pending regulatory approval.”

As compelling as VIX products are for trading, I can imagine that VXST options and futures might be even more attractive to certain types of traders. Also, if VXST futures gain some traction, I can envision ETPs based on these that might rival the interest in VXX at some point.

In other words, this could easily turn out to be a huge development in the volatility space.

Related posts:

Disclosure(s): short VXX at time of writing; the CBOE is an advertiser on VIX and More

Saturday, September 14, 2013

Revisiting the VIX:VXV Ratio

Two of my favorite bloggers, who hail from very different corners of the investment landscape, both happened to mention me in reference to the VIX:VXV ratio in the past few days.

On Wednesday, in A Buy Signal from the Option Market, Cam Hui of Humble Student of the Markets, noted that the VIX:VXV ratio had fallen below 0.92, where “it has provided reasonably good long entry points in the past.” Cam linked back to my first post on the VIX:VXV ratio from December 2007, which, I am fairly certain is the first time anyone ever mentioned the ratio and suggested that it might have some value as a market timing signal.

Today Russell Rhoads of the CBOE, whose Trading VIX Derivatives: Trading and Hedging Strategies Using VIX Futures, Options, and Exchange Traded Notes is undoubtedly the best book ever published on the VIX, also mentioned the VXV:VIX ratio in one of his weekly volatility columns, This Week in VIX Options and ETPs – 9/13/2013. Russell’s version of this ratio, VXV:VIX, flips the numerator and denominator, so his comments are the inverse of much of my analysis. “Note on the chart there are a few instances where the ratio of VXV to VIX falls below 1.0. That seems to coincide with a subsequent near term bottom in the stock market as well.”

I have literally dozens of posts on the VIX:VXV ratio going back to 2007 and while I have hand-picked a selection of posts below that focus on this subject, I could easily fill a book with data, interpretative overlays and trading strategy ideas based on VXV (essentially a 93-day version of the VIX) and its relation to VIX and other measures of volatility.

One of the more interesting issues related to the VIX:VXV ratio is how that ratio has moved up and down over the course of various volatility regimes. In the first two years of the ratio (2007 and 2008), the average (mean) ratio was 0.97 and 1.02; during the past two years, however, the average (mean) ratio has fallen all the way down to 0.87 and 0.90.

For about 1 ½ years following the launch of VXV, using absolute levels in the VIX:VXV ratio as bullish and bearish signals worked almost perfectly. One only has to look at VIX:VXV Ratio Moving Toward Bearish Zone to understand why it quickly gained so many fans. When the 2008 financial crisis hit and in the aftermath of the crisis, the VIX:VXV ratio began to look like just another broken indicator. Since that time, the VIX:VXV ratio has continued to be a very useful indicator, yet its value has been greater when studied in relative terms than absolute terms. Old rules, such as increasing long equity exposure when VIX:VXV fell to 0.92 or 0.90, proved to be of little help when the average of the ratio hovered around 0.90 instead of 1.00.

During the last two years, the VIX futures term structure has departed significantly from historical norms, as I have demonstrated in the likes of The 2012 VIX Futures Term Structure as an Outlier. Frankly, the 2013 version of the VIX futures term structure looks a lot more like the outlier 2012 data set than any previous year.

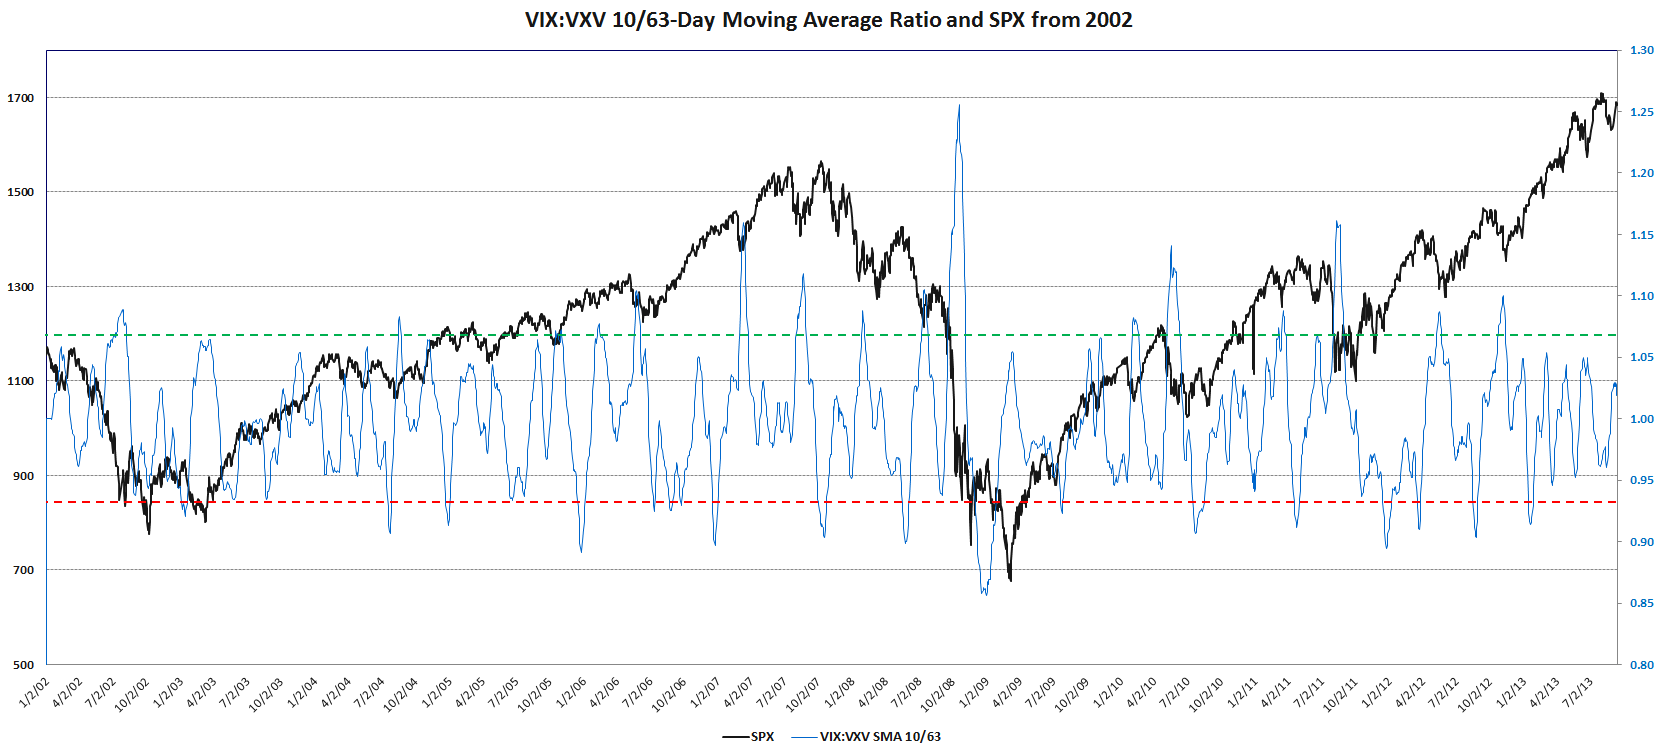
There are many ways to think about a ratio in relative terms. Using percentiles, standard deviations and short-term vs. long-term moving averages are just some of the ways that one can rethink the VIX:VXV ratio in relative terms. In the chart below, for instance, I have calculated the two-week moving average of the VIX:VXV ratio relative to the moving average for the past quarter. This keeps the data standardized around a mean of 1.00 and allows for a way to evaluate the ratio on a relative basis, regardless of whether the current volatility regime has depressed or lifted the ratio data for the full lookback period.  Note how extremes in this ratio of ratios has been an effective market timing signal over the course of the past eleven years.

[source(s): CBOE, VIX and More]

Given the scope of the issues that are related to VXV and the VIX:VXV ratio, I pledge to devote a good deal more space to these issues going forward, including the twists and turns in the VIX futures term structure, the use of the VIX:VXV ratio in determining the dynamic allocations for XVZ, etc.

For those who are doing some of their own research into these and some tangential subjects, the links below are an excellent point of departure.

Related posts:

[source(s): CBOE, Yahoo, VIX and More]

Thursday, July 19, 2012

Crazy VIX:VXV Ratio Chart

There was a point in the history of VIX and More that I gave serious consideration to a regular feature in which I unveiled “Strange and Unusual Charts” that presumably had, apart from their novelty, the ability to shine some new light on at least one corner of the investment universe. That being said, I have always had an affinity for presenting charts that show unusual ratios, non-standard time frames and such and while the likes of Chart Porn and Unusual Chart of the Month: VXO and RVX did get me started down a slippery slope, I never quite fell into the habit of tilting wildly at windmills on the plains of StockCharts.com and their brethren.

One rabbit hole that I was definitely the first down and pursued the most aggressively was the VIX:VXV ratio, which one blogger insisted was sure to ultimately be my investing legacy. In all fairness, for the first year following the launch of VXV (essentially a 93-day version of the VIX), the VIX:VXV ratio performed as if it was going to make all other indicators obsolete. Of course, then the financial crisis of 2008 hit and the ratio began sprouting warts all over. While I talk about the VIX:VXV ratio only rarely in this space nowadays, the general idea of which the VIX:VXV ratio is just one instance of what has become one of the main themes of this blog: the idea that an understanding of the VIX futures term structure is critical to understanding the valuation of and trading opportunities available for all VIX products, including futures, options and exchange-traded products.

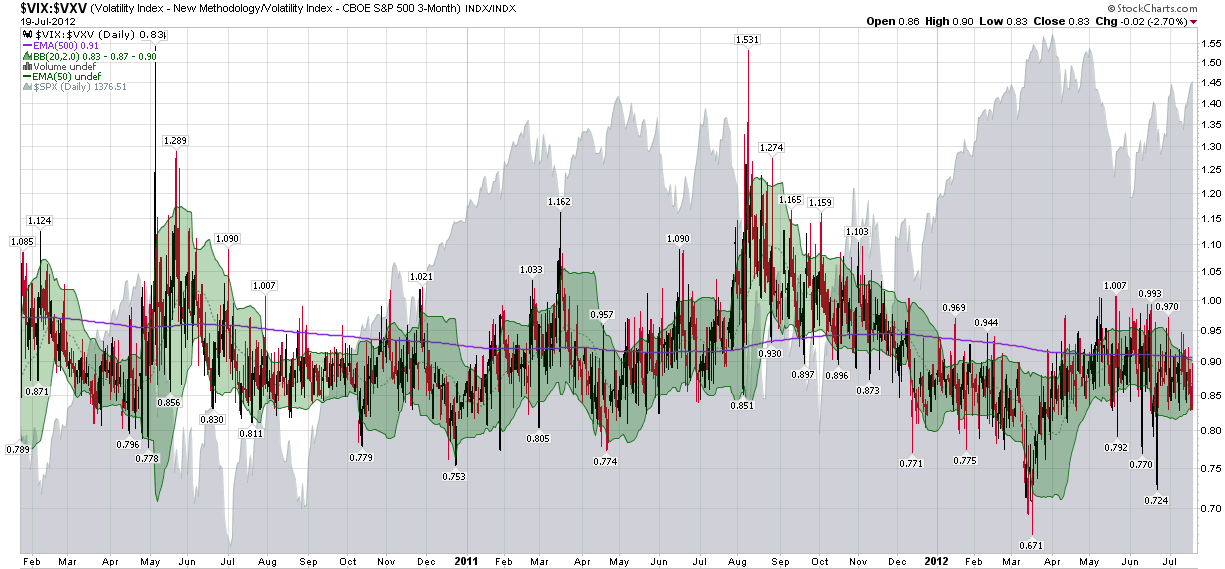
All of which brings me – somewhat belatedly, perhaps – to today’s chart, which is right out of the same cauldron that produced some of the curiosities of yesteryear. The chart below captures 2 ½ years of daily bars in the VIX:VXV ratio and adds some green Bollinger bands for color and context, along with a gray area graph of the SPX. Finally, I have included a purple line for the VIX:VXV ratio that reflects a 500-day exponential moving average (EMA) in order to show the long-term average of the ratio.

While there are many interesting nuggets buried in this chart, first note that the long-term average of the VIX:VXV ratio is not 1.00, but generally hovers in the 0.90 – 0.95. This reflects the fact that the VIX futures term structure has historically been in contango (upward sloping, with nearer months less expensive than more distant months) 75-80% of the time. Second, note that spikes in the ratio tend to coincide with bottoms in stocks and vice versa. Finally, note that even with the crazy VIX spike last August and September (and record backwardation, i.e. high VIX:VXV ratios), the ratio has been depressed since December and the 500-day EMA is now making all-time lows.

What does this mean? Lots of things, but in simple terms investors continue to believe that the VIX is unnaturally low given the scope and magnitude of the future threats to equities. Should the ratio continue at its current 0.83, I would be very concerned about the possibility of a bearish reversal.

[In order to keep this post to a manageable length, I have skipped over a bunch of related issues, but readers should feel free to wander down some of the same rabbit holes I have preserved in the links below.]

Related posts:

[source(s): StockCharts.com]

Disclosure(s): long VIX at time of writing

Sunday, March 4, 2012

Volatility Indices vs. Futures

The CBOE Volatility Index, also known as the VIX, is the most famous and widely quoted of all the volatility indices. It measures the market’s expectations of the volatility in the S&P 500 index (SPX) for the next 30 calendar days. Unbeknownst to many (despite my efforts), the VIX also has a lesser known sibling that measures the volatility expectations in the SPX for the next 93 calendar days: VXV.

In addition to the volatility indices, there are also markets for VIX futures; lately these have extended out eight or nine months into the future. Whereas the VIX and VXV evaluate volatility over the full course of a future window, the VIX futures are the market’s best guess at what the VIX will be at various snapshots into the future.  [The distinction is not that dissimilar to the snapshot of a balance sheet vs. the flows in an income statement or a cash flow statement in accounting.]  For this reason, it is certainly possible that an index which measures volatility over the next 93 calendar days may come up with a different value than a VIX futures product in which market participants attempt to estimate what the VIX will be at a specific point in time some 93 days later.

For the most part, the relationship between the VIX and VXV (which are calculations based on the implied volatility of a strip of SPX options) and the VIX futures (whose values are based on market prices) holds together fairly well.

Lately, however, the volatility index values have been much cheaper than the futures values for comparable time periods. In the graphic below, the VIX futures term structure (or at least the first eight months of it) is represented by the blue line, while the VIX and VXV are the red dots and dotted connecting line resting substantially below the VIX futures values.

Savvy traders may be able to find ways to take advantage of this and some related price discrepancies. Everyone, however, is free to ponder the source of the disconnect between SPX options traders and VIX futures traders.

Related posts:

[source(s): CBOE Futures Exchange (CFE), CBOE]

Disclosure(s): the CBOE is an advertiser on VIX and More
Friday, January 6, 2012

VXV Heralding a Return to Normalcy

With the political season heating up, it seemed like an opportune time to work “normalcy” into one of my posts again and what better way to do that than by putting under the microscope one of my favorite overlooked indices: the CBOE S&P 500 3-Month Volatility Index, which I typically reference with the more pithy VXV ticker symbol.

For those not familiar with VXV, I am fairly sure I was the first person to discuss this index back in 2007, talk about the merits of the VIX:VXV ratio (which is a great way for someone without VIX futures quotes to keep on top of the VIX futures term structure), devote an entire Barron’s column to the subject (Take a Longer View on Volatility) and promote VXV as a better reflection of long-term and structural/systemic volatility than the VIX, which is better suited to measuring short-term event volatility.

For those who desire some additional background and context, there are shiploads of prior posts on the subject and the links below should provide for some excellent jumping off points.

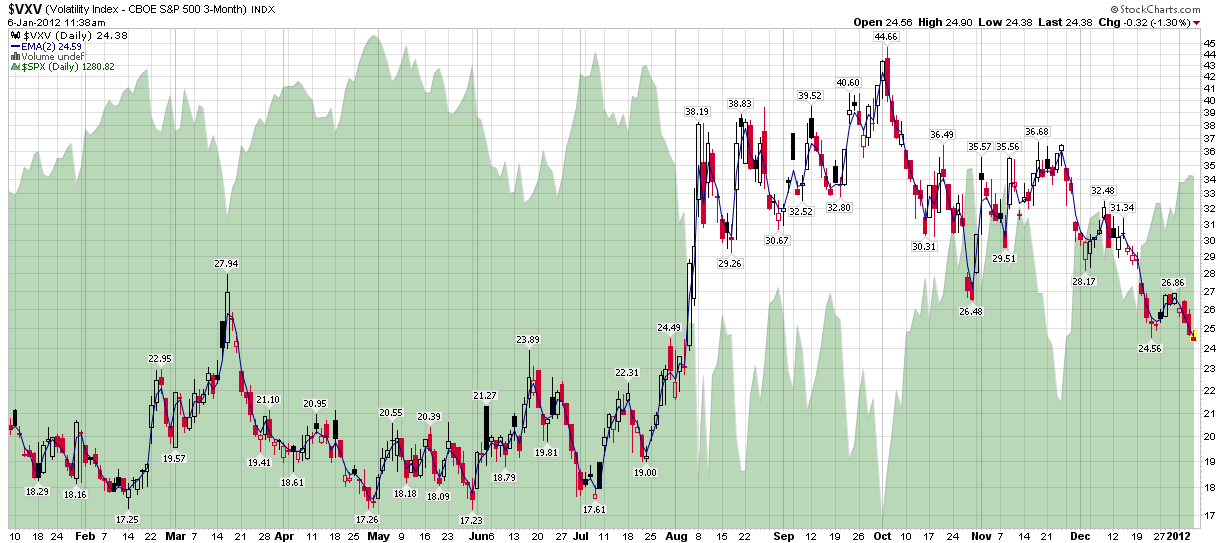
Getting back to VXV, I think it is important to note that while the VIX remains above its December lows, VXV has now moved below those lows and it plumbing levels that have not been seen since early August – and as VXV is a better gauge of structural and systemic risk than the VIX (not to mention largely untouched by the holiday effect), I think this is an important development to watch.

Frankly, the VXV chart looks a lot like it did back in early April 2009, when I penned Chart of the Week: VXV and Systemic Failure.  At that time I concluded, “The key takeaway: systemic healing is continuing and the risk of systemic failure is diminishing.” Based on the VXV chart, it appears as if we are at a similar moment in time right now.

Related posts:

[source(s): StockCharts.com]

Disclosure(s): The CBOE is an advertiser on VIX and More
Monday, April 25, 2011

Chart of the Week: VXV at Critical Juncture

It seems almost like heresy to consider something other than silver or the VIX as a candidate for the Stock of the Week, but since there have been so many posts and charts about both subjects, I thought I might offer a slightly different twist.

Yes, it is time for me to trumpet the importance of VXV once again. For those who may have forgotten, VXV’s formal name is the CBOE S&P 500 3-Month Volatility Index. The CBOE describes the index in detail here, but the key takeaway is that VXV is essentially a 93-day version of the 30-day VIX. In other words, whereas VIX looks out at just one month of potential volatility and disruptions to the financial markets, VXV has a time horizon of one quarter. This means, among other things, that while both capture the essence of the Q1 earnings reporting season, VXV includes three FOMC meetings and three nonfarm payroll reports, among other things. And whereas there may be no significant developments regarding Greek debt restructuring, it is unlikely that this issue will not be addressed in the next three months.

For these and other reasons, I have always felt that VXV provided a better reflection of long-term and structural/systemic volatility than the VIX, which is better suited to measuring short-term event volatility.

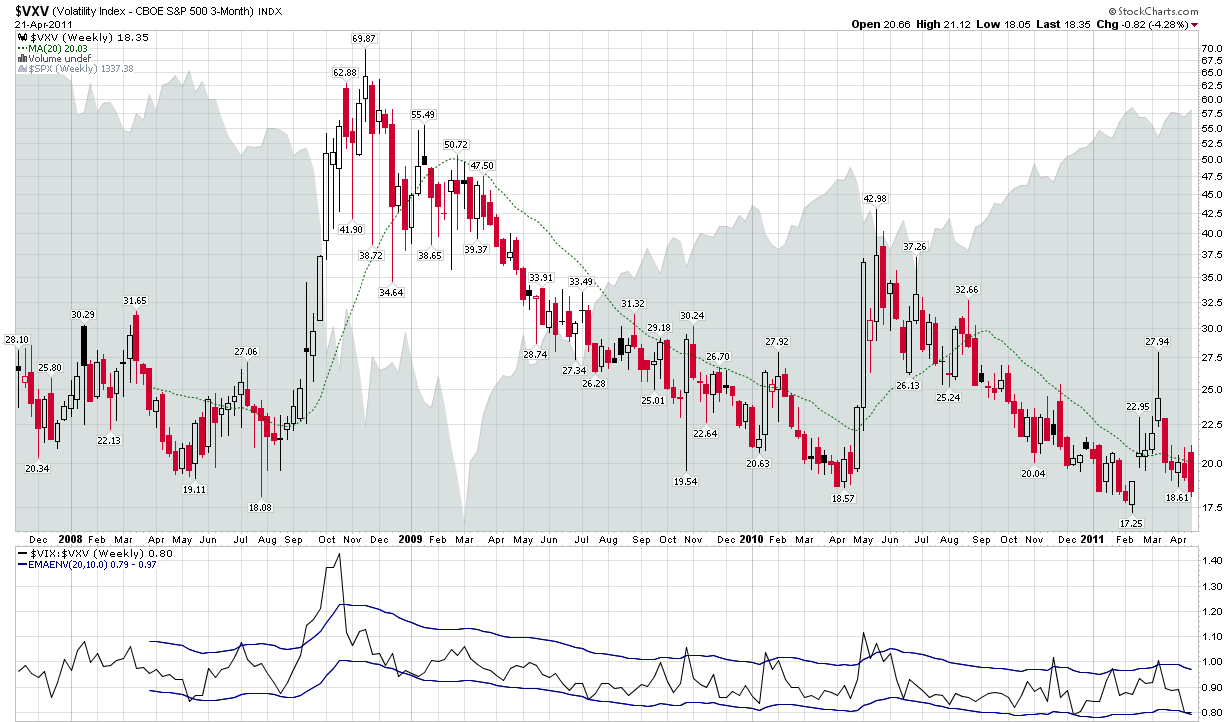
Looking at a weekly chart of VXV since its October 2007 launch, one cannot help but notice a pattern of historical support in the 17.50 – 18.00 zone. Friday’s close took VXV down to 18.35. A couple of closes below could signal not just a change in structural volatility and longer-term risk, but also the arrival of a new volatility regime.

Related posts:


Disclosure(s): neutral position in VIX via options at time of writing

[graphic: StockCharts.com]

Thursday, July 22, 2010

XXV and the New VIX ETN Landscape

While I was out of pocket for a few days, Barclays had the temerity to launch a new VIX ETN. Not only that, but this new volatility product is the first inverse VIX ETN to hit the market. It goes by the formal name of Barclays ETN+ Inverse S&P 500 VIX Short-Term Futures ETN and has a ticker of XXV.

Others have already weighed in on XXV, including excellent coverage of the potential of this ETF from Adam Warner at the Daily Options Report, particularly in To Err is Blog-Human and XXV Finale. Another interesting post comes from Volatility Futures & Options and attempts to reconstruct the historical performance of XXV in XXV – Inverse VXX ETF First Day of Trading. Not to be outdone, Ron Rowland of Invest with an Edge asks some pointed questions of the branding approach at Barclays in XXV: Barclays Abandons iPath Brand with Inverse Volatility ETN.

Frankly, there are a lot more questions than answers for XXV at this stage. My initial impression, however, is a positive one. Both VXX and XXV are ideally suited for the day trading crowd and are useful for swing trades of several days or so. As far as longer holding periods are concerned, I am partial to XXV over VXX, as XXV should benefit from the same term structure rebalancing anomalies that have plagued VXX and have resulted in negative roll yield. In the case of XXV, the daily portfolio balancing should be a net plus over the course of long-term holding periods.

Several more VIX ETNs are in the works. In the graphic below, I attempt to outline the VIX futures (with the VX prefix) and ETN landscape, along with the two SPX implied volatility indices. Note that the volatility indices (VIX and VXV) both have a constant duration, as do the VIX ETNs: VXX; VXZ; and XXV. The duration of the VIX futures, however, decreases one day at a time (and jumps forward on weekends and holidays), which means that their time horizon continues to decline over the course of each VIX options (and futures) expiration cycle, which are represented by the large green arrows in the graphic. The bottom line is that when you have constant duration products, such as the VIX ETNs, which are priced off of declining duration products (VIX futures), then there will always be friction from the result of the portfolio rebalancing used to maintain a constant duration. The exact impact of the rebalancing depends upon whether the VIX futures are in contango or backwardation and the slope of the term structure. As a rule of thumb, the ETNs with the shortest duration (to the left in the chart below) will be impacted the most by contango and backwardation, while the ETNs with the longest duration (to the right) will be affected to a smaller degree by roll yield.

Finally, it is important to note that more VIX ETNs are on the way. The Jefferies S&P 500 VIX Short-Term Futures ETF (VIXX) targets a constant 30-day duration and has a great deal in common with VXX, while Bank of America’s Investable Volatility Index ETN (no ticker designated, to my knowledge) appears to be targeting VIX options (a first for this product category) with an average maturity of five months. CBOE has some skeleton information on their Investable Volatility Index (VOL), but I look forward to more digging up more details on the forthcoming ETN and sharing them when I do.

For more on related subjects, readers are encouraged to check out:


Disclosure(s): long XXV and short VXX at time of writing

Wednesday, July 15, 2009

Some Thoughts on Current Volatility

Being a West Coast guy, I often find myself three hours behind the rest of the blogging world when I stumble out of bed. Once or twice a year, I manage to sleep through the open and generally spend the rest of the day playing catch-up, as has been the case today. Now that I am mostly coherent and have digested the bulk of the news and market movements for the first three hours of today’s session, let me offer some comments.

While stocks are enjoying an Intel (INTC) inside jump, the VIX is up a shade as I type this, seemingly intent on staying above the 25.00 level. On the other hand, three of other major market index volatility measures I follow (VXN, RVX and VXD) are all down in the 5-7% range for the day. The outlier among the secondary volatility indices is VXO, the volatility index for the S&P 100 index (OEX), which is only down about 2% on the day. (I am not sure exactly how to parse this information, but with the meat of second quarter earnings season just around the corner and options expiration only two days away, I would not be surprised to learn that portfolio managers are looking to lock in some profits and add some additional downside protection.)

In the last day or two, a number of other bloggers have commented up on the volatility premium issue. In VIX Predicting the Future…and It’s Cloudy, Jason Goepfert of Sentiment’s Edge has an excellent chart of the premium of the front-month VIX futures to the spot VIX index and points out that a high premium has lately been bearish for stocks. Adam Warner of Daily Options Report picks up the premium theme in While We Were Churning…… as does the Decline and Fall of Western Civilization blog in Volatility Curve Warning Again.

The premise is exactly the same reasoning as is behind the VIX:VXV ratio and the VXX:VXZ ratio: when short-term volatility measures become substantially out of line with longer-term volatility measures, the divergence is most likely to be resolved by the short-term measure ‘correcting’ in the direction of the longer-term measure. With the VIX:VXV ratio recently hovering around 0.85, this means a VIX spike is more likely to take the ratio back toward equilibrium than a substantial drop in the VXV index. By the same token, VXX and VXZ are more likely to converge as a result of a jump in VXX than a decline in VXZ. Of course, the numerator and denominator can always converge at the same rate, but that type of resolution seems to be relatively rare.

For those who may be interested, my various estimates of fair value for the VIX are largely in the range of about 28-29 at the moment, suggesting that short-term volatility is due for a bounce soon.

As a reminder, anyone wishing to speculate on the VIX using options and futures should note that VIX options expire next Wednesday (July 22), with the last day of trading on Tuesday.

Thursday, July 2, 2009

Guest Columnist for Steven Sears at Barron’s Today

Thanks to Steven Sears at Barron’s for giving me an opportunity to contribute to his excellent options column, The Striking Price Daily, while he is on vacation.

It should surprise very few readers that I elected to write about a subject that has garnered a great deal of attention on this blog, the CBOE S&P 500 Three-Month Volatility Index. Of course we just call it VXV here. The Barron’s column, Take a Longer View on Volatility, is available to subscribers and non-subscribers alike.

Thursday, June 25, 2009

VIX:VXV Ratio Sell/Short Signal

The VIX closed at 26.36 today, down 15.4% from Monday’s close of 31.17 to the lowest closing level since the 25.66 close on September 12, 2008 – the last trading day before the Lehman Brothers bankruptcy was announced.

According to the classic 10 day simple moving average measure, which has the VIX currently sitting 11.7% below that level, the VIX is now in an ‘oversold’ position according to the TradingMarkets 5% Rule as well as a more stringent 10% threshold used by other traders.

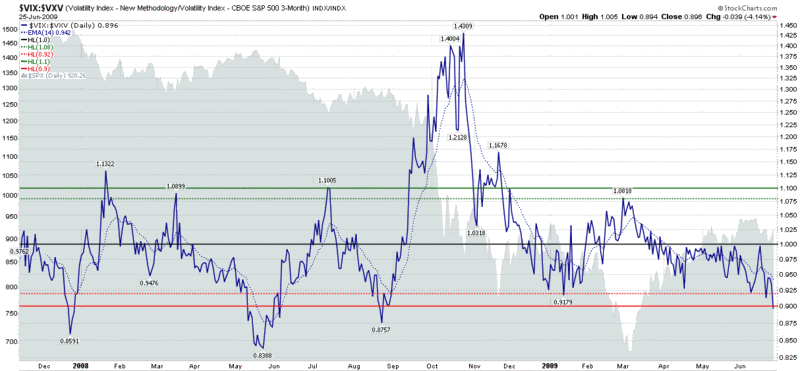
From a volatility term structure perspective, the VIX is also oversold. Notably, the VIX:VXV ratio, which compares 30-day volatility of SPX options to 93-day volatility (using the VXV index), closed today at 0.896 today. In the chart below, you can see that when this ratio closes at 0.92 or below, the bears tend to have an upper hand for at least several weeks. When the ratio drops below 0.90, as was the case today, the odds shift even more favorably in the direction of the bears.

In brief, the low current levels in the VIX:VXV ratio suggest that options traders are too bullish and complacent in their 30 day outlook (event volatility) relative to their 93 day outlook (structural volatility.) While these two volatility measures can be brought back into line by lowering estimates of long-term structural volatility, the path of least resistance is for short-term event volatility to rise. This means the odds favor that the VIX will move in the direction of the VXV, which closed at 29.41 today. Of course rising volatility tends to favor the bears at the expense of the bulls. Even with today’s exceptionally strong close, longs should consider taking profits and/or initiating short positions.

[source: StockCharts]

Disclosure: Long VIX at time of writing.

Wednesday, June 17, 2009

VXX:VXZ Ratio

Since its launch on January 30th, the iPath S&P 500 VIX Short-Term Futures ETN (VXX) has generated an enthusiastic following, with an average volume of 400,000 shares traded each day. The same claim cannot be made of VXX’s more problematic sibling, the iPath S&P 500 VIX Mid-Term Futures ETN (VXZ), where 100,000 share days are more the exception than the rule.

In spite of the lack of popularity, VXZ, which attempts to replicate the changes in VIX futures approximately five months out, should not be overlooked. In fact, comparisons between the movements of VXZ and VXX provide some interesting insights into the ebb and flow of volatility expectations.

Take the VXX:VXZ ratio, for instance. In some respects this indicator is similar to the VIX:VXV ratio I introduced back in 2007. There are some important differences between the two ratios, however, which are worth noting. First and foremost, you can trade both VXX and VXZ; neither VIX nor VXV can be traded directly. Second, and related, both VXX and VXZ are exchange-traded notes (ETNs), while VIX and VXV are indices. Finally, whereas VXX and VXZ look out one month and five months, the VIX and VXV indices look out one month and three months.

For those seeking to compare near-term volatility expectations with volatility expectations several months out, both the VIX:VXV ratio and the VXX:VXZ ratio are excellent tools. From a data perspective, the index ratio has 19 months of real-time historical data. Unfortunately, the VXX:VXZ ratio has only 4 ½ months of real-time (i.e., non-reconstructed) data to draw from. On the other hand, data for the VXV index is sometimes difficult to come by, while VXX and VXZ data are widely distributed.


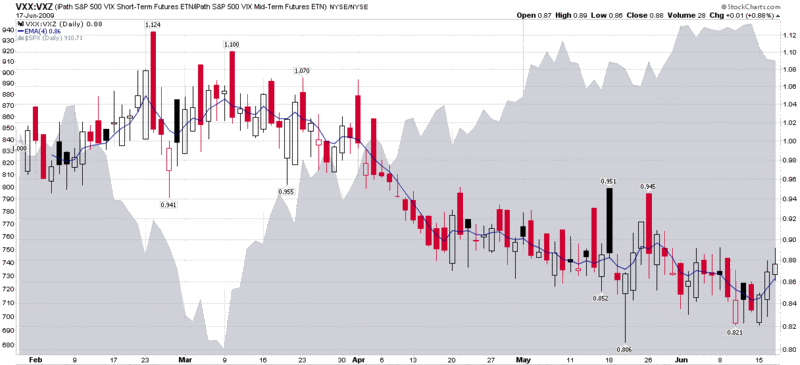
The chart below shows the full history of the VXX:VXZ ratio, using a 4-day EMA (blue line) as a smoothing factor. While this indicator is still quite youthful, I find it encouraging that the recent bottom in the ratio coincided with a topping pattern in the SPX. Further, the double top in the ratio that completed on March 9th also coincides with the bottom in the SPX.

Going forward, I will compare the VXX:VXZ ratio to the VIX:VXV ratio and subject both ratios to some additional scrutiny.


[source: StockCharts.com] 

Disclosure: Long VXX and neutral position in VIX via options at time of writing

Thursday, May 21, 2009

VIX:VXV Ratio Moving Toward Bearish Zone

Lately I have received quite a few requests to talk about the VIX:VXV ratio, something that I first blogged about back in December 2007, shortly after the VXV volatility index was launched.

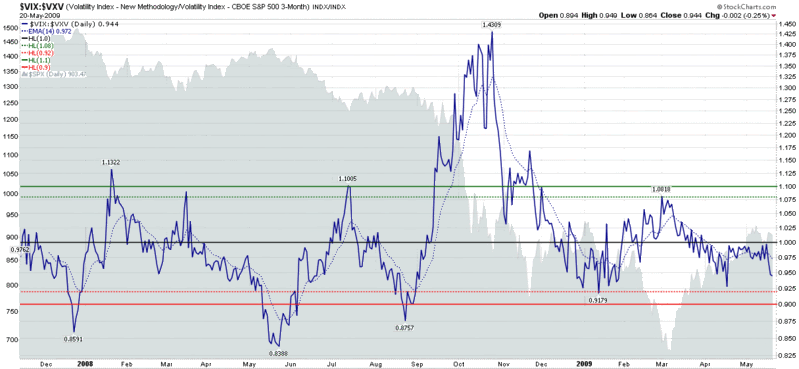
The chart below is my standard VIX:VXV ratio chart and uses the 1.08 and 0.92 end of day closing levels as basic long and short signals. The last signal on the chart is a March 1st long signal that preceded the March bottom by a week. On April 19th the VIX:VXV ratio closed at .9276, but was below the 0.92 signal line on an intraday basis.

Yesterday, I saw some data that showed the VIX:VXV ratio below 0.92 during the trading session, but a review of the intraday chart tells me that while the VIX:VXV ratio was in the 0.9150 to 0.9200 area from about 9:50 a.m. to 10:10 p.m. ET, any lower numbers were likely to have been the result of bad prints.

For the record, while yesterday’s 0.944 close suggests a bearish bias, my reading of the ratio is that the preferred entry point for shorts positions would require waiting for a close of 0.92 or below.

[Note that while this basic interpretation of the VIX:VXV ratio sets parameters for long and short entries, it does not include recommendations about exits or how to incorporate the VIX:VXV ratio into a trading system.]


[source: StockCharts]

Disclosure: Long VIX at time of writing.

Wednesday, April 22, 2009

How to Create Your Own Portable VXV

I recently received a question from a reader who was looking to create a homemade version of the VXV that he could apply to the Nifty (formally known as the S&P CNX Nifty), which is an index of 50 large capitalization companies on the National Stock Exchange of India. Specifically, the reader wanted to know if it would be possible to use a 93 day moving average of the India VIX to create an index that would be analogous to the VXV.

Actually, VXV ignores all historical volatility readings and utilizes implied volatility instead. It is the blending of implied volatility for the options from the months that are closest to 93 days into the future.

Refer to the graphic below and I will create a “quick and dirty” version of VXV that can be used on any underlying that has options. The example here is for the SPX, but the same process can yield a VXV proxy for any underlying.

The steps are as follows:

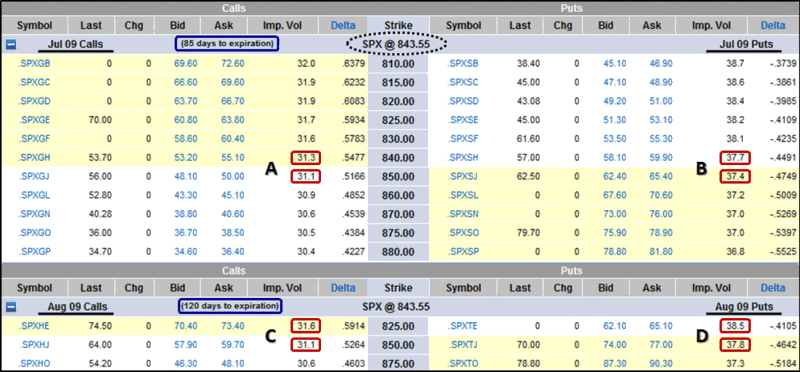
  1. Determine the two options expiration months whose time to expiration is closest to 93 days (the term for the VXV). In this case we are using July, with 85 days until expiration and August, with 120 days until expiration. Of course once each month there will be one month with exactly 93 days until expiration.

  2. Determine the last close in the SPX and the series immediately above and below the last close for each of the two months. Here the last close is 843.55. For July, the series for the calculations are 840 and 850. For August, we use 825 and 850.

  3. Determine the implied volatility levels for both the puts and calls for the relevant series for each of the two months. These are highlighted in red in the optionsXpress graphic below.

  4. Interpolate the implied volatility for the SPX close from the two July calls (A), July puts (B), August calls (C) and August puts (D). In this case the interpolation is done by assuming the proportions for the SPX close are the same as they are for the implied volatility values. For example:
    A = 31.1 + (6.45/10)*(31.3-31.1)
    A = 31.229

  5. Now that we have implied volatility levels for the SPX close, we need to average these across both puts and calls for each month. July = (A + B) / 2 and August = (C + D) / 2

  6. Finally, interpolate the July and August results from the step above to estimate 93 day implied volatility. The easiest way to do this is to start with the nearer month and then add the appropriate fractional portion of the later month that lifts the blended average to 93. The approach is analogous to the interpolation above and yields and equation that looks like this:
    VXV = [(A + B) / 2] + [(93-85)/(120-85) * ((C + D) / 2) – ((A + B) / 2)]

This is not the same approach that is used by the CBOE, which is more complex and is detailed in the CBOE S&P 500 3-Month Volatility Index Description. This quick and dirty variant can be calculated quickly and is portable across any underlying with options, including the Nifty.

[source: optionsXpress]

Friday, April 10, 2009

Chart of the Week: VXV and Systemic Failure

When it comes to the chart of the week, anything goes. Now it its six month, this regular feature can highlight anything from an important economic data release to interest rates, bonds, index performance, market internals and even my strange and unusual ratios. My intent has been to keep volatility in the loop, but generally cast a wide net each week.

This week I am focusing on volatility, but probably not a measure that many readers pay attention. Specifically, I am speaking of the VXV. This index is essentially a 93 day version of the VIX, but for those who are interested in further digging, a good place to start is with my December 2007 Thinking About the VXV.

One reason I think the VXV is worth following is that I believe it gives a better perspective on structural volatility and systemic risk than its short-term counterpart, the VIX. For more on this subject, I encourage readers to check out my November 20, 2008 post, The VXV and Extreme Structural Volatility Risk.

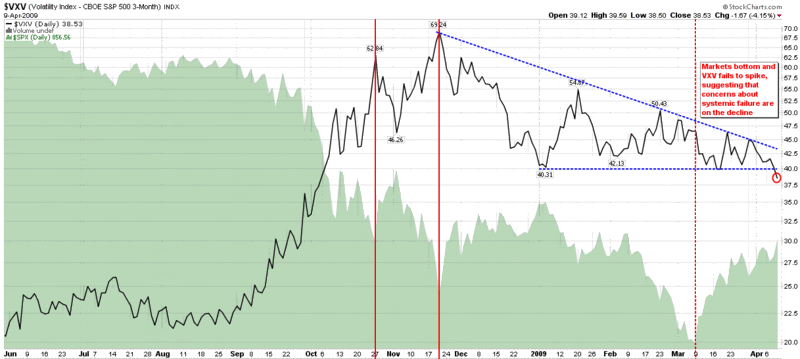
All this brings us to the chart below. The quick takeaway is that according to the VXV, structural volatility and systemic risk peaked on November 29th and has been in a decline ever since, as the dotted blue descending triangle reflects. I have also included three vertical red lines to show significant market bottoms. The first two generated significant VXV spikes and were eventually violated. The most recent bottom, which resulted in the SPX hitting 666, is shown with a dashed vertical red line. An important feature of that bottom is that the VXV did not spike, suggesting that there was no increase in systemic risk – perhaps part of the reason why the 666 bottom has held.

Finally, note that as of Friday (red circle), the VXV has dropped to levels not seen since the first week in October. The key takeaway: systemic healing is continuing and the risk of systemic failure is diminishing. When the VXV is able to make it back below 30, I suspect this will be an indication that systemic risk is once again at a manageable level.

[source: StockCharts]

Thursday, November 20, 2008

New VIX Record Close: 80.86

Today's intra-day high of 81.48 was the third highest ever recorded for the VIX.

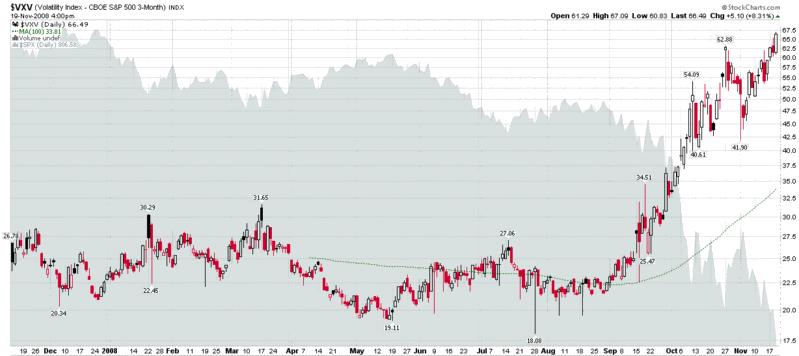
For those who follow the VXV, today's close of 69.24 is also a new record.

The VXV and Extreme Structural Volatility Risk

In early October I set forth some of my ideas around how to think about volatility in A Conceptual Framework for Volatility Events. Today I want to briefly touch upon a topic that is tangential to that conceptual framework and closely linked to the VIX:VXV ratio that I talk about on a regular basis.

My thesis is simply this: the VIX looks out 30 days into the future and captures “event volatility” – or the volatility that is associated with events that are expected to occur in the next 30 days. These include Fed meetings, important economic data releases (employment report, consumer prices, retail sales, durable goods orders, GDP, etc.), earnings from bellwether stocks, even hurricanes, geopolitical crises and other events which can expect to cast a shadow over the course of the next 30 days.

The other half of the thesis is that the VXV (essentially a 93 day version of the VIX) always incorporates a full earnings cycle and a full economic data release cycle – so these events have very little impact on the VXV. As a result, the volatility that is relevant to the VXV is structural or systemic.

If this thesis is correct, it has some interesting implications for interpreting the VIX:VXV ratio and the VXV in isolation. For instance, yesterday’s new highs in the VXV, which occurred without the VIX even coming close to a new record, suggests that traders are currently pricing in record amounts of structural or systemic risk. In the long run, this "structural volatility" is a lot more dangerous than the event risk associated with the VIX.

[source: StockCharts]

Thursday, November 13, 2008

VXV Is One Year Old

One year ago the CBOE launched the VXV, which is a variant of the VIX that calculates implied volatility in SPX options over the course of the next 93 days instead of the 30 day time window used by the VIX.

In December 2007, with the VXV less than one month old, I went out on a limb and suggested in The VIX:VXV Ratio that comparing the relative levels in the VIX and VXV might serve as an important market timing signal in a way that is analogous to VIX term structure data.

Much to my delight, from November 2007 through the Lehman Brothers bankruptcy in September 2008, the VIX:VXV ratio performed nearly flawlessly, generating timely buy and sell signals. In a post-Lehman world, however, the VIX:VXV ratio has struggled with a bullish bias as the markets have headed down.

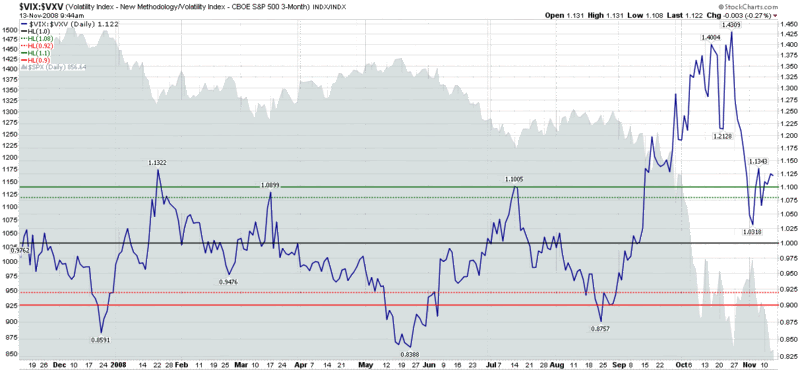
In the chart below I present my original thinking from December 2007 of how the VIX:VXV might be applied. Since that time, I have made a number of enhancements for my personal use that I have yet to post about on the blog. A couple of those enhancements now suggest that the pre-Lehman threshold levels such as 1.10 and 0.90 are once again relevant. This would make the current VIX:VXV ratio of 1.12 an excellent buying opportunity.

For a long time, I was the only person who talked about the VIX:VXV ratio. Over the course of the past year, however, it has generated a strong following. Now that readers have a year of data to digest and a broad range of market conditions in which to evaluate the indicator, what enhancements or modifications to the VIX:VXV ratio would you suggest? Feel free to discuss this in the comments section below.

[source: StockCharts]

Thursday, October 9, 2008

New Record Close for Volatility Indices


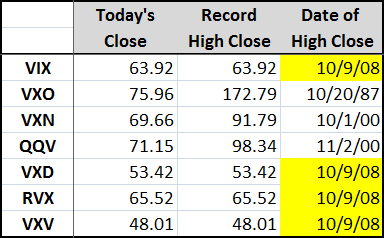
Today’s dramatic last hour selloff resulted in new record high closes in four of the seven major U.S. volatility indices, including the VIX, which exceeded 60 for the first time and established a new record close of 63.92. In addition to the VIX, the VXD (CBOE DJIA Volatility Index) and the RVX (CBOE Russell 2000 Volatility Index) also set new records.

Note that these volatility indices have different life spans and data histories, so the comparisons of all-time record highs across indices are not always particularly relevant. For more information on all of the volatility indices, try Overview of U.S. Volatility Indices.

Thursday, September 18, 2008

VIX:VXV Ratio at New End of Day High

As far as I know, I was the first person to show interest in the VXV as a market timing indicator and the first to talk about the VIX:VXV ratio when I posted on these subjects back in early December in The VIX:VXV Ratio.

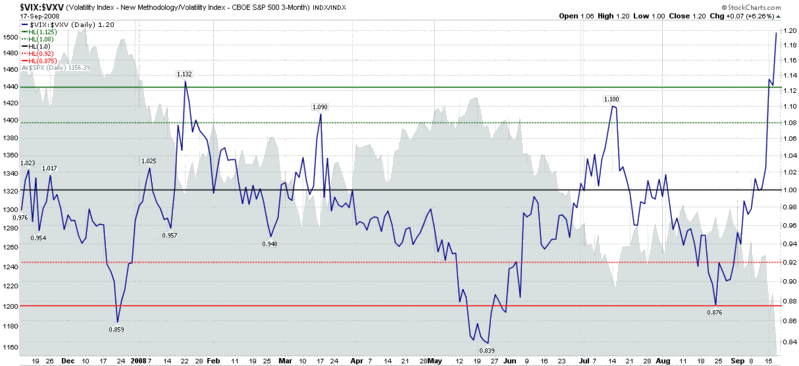
Fast forward nine months and the VIX:VXV ratio has an admirable market timing record and a very strong following, here and elsewhere. Last night it set a new end of day high when the ratio closed at 1.20. So far, readings of 1.08 and above have been good long entry points. Using the same logic, a long entry at 1.20 should be an even better trade. I will be interested to see how last night’s signal turns out.


[source: StockCharts, VIX and More]

Tuesday, August 5, 2008

Overview of the U.S. Volatility Indices

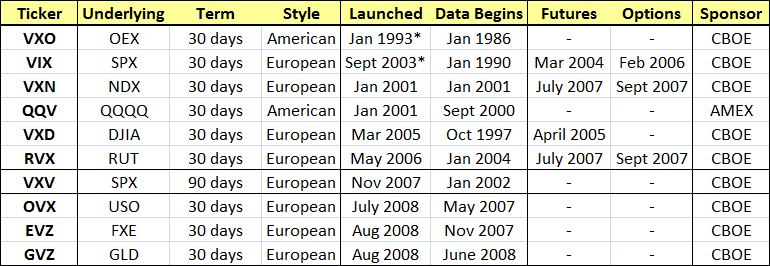
As a companion to yesterday’s The Evolution of the Volatility Index Family Tree post, I thought it might be helpful to include a comparative look at the major U.S. volatility indices, which is what the table below hopes to accomplish.

The main distinguishing factor for these indices is whether or not futures and options are available as a means to trade the underlying. It is also important to note not just the launch date for the index, but also the period for which historical data are available. In some cases (e.g., VIX, VXO, VXD), this extends back several years prior to the official index launch.

Two of the indices stand out from the crowd for a particular unique characteristic: the QQV is the only volatility index that is sponsored by the American Stock Exchange (AMEX); and the VXV is the only index that has a 93 day time horizon rather than the standard 30 days.

Finally, I have covered this in several on the blog, but those who are interested in why there is an asterisk for the VIX and VXO launch dates should be aware that the calculation methodology for the ‘original VIX’ (VXO) was overhauled in 2003, at which point the original methodology was preserved under a new VXO ticker and the new methodology was applied to the VIX ticker. Some additional details are available in Ten Things Everyone Should Know About the VIX.

DISCLAIMER: "VIX®" is a trademark of Chicago Board Options Exchange, Incorporated. Chicago Board Options Exchange, Incorporated is not affiliated with this website or this website's owner's or operators. CBOE assumes no responsibility for the accuracy or completeness or any other aspect of any content posted on this website by its operator or any third party. All content on this site is provided for informational and entertainment purposes only and is not intended as advice to buy or sell any securities. Stocks are difficult to trade; options are even harder. When it comes to VIX derivatives, don't fall into the trap of thinking that just because you can ride a horse, you can ride an alligator. Please do your own homework and accept full responsibility for any investment decisions you make. No content on this site can be used for commercial purposes without the prior written permission of the author. Copyright © 2007-2023 Bill Luby. All rights reserved.
 
Web Analytics