Showing posts with label structural volatility. Show all posts

Friday, January 6, 2012

VXV Heralding a Return to Normalcy

With the political season heating up, it seemed like an opportune time to work “normalcy” into one of my posts again and what better way to do that than by putting under the microscope one of my favorite overlooked indices: the CBOE S&P 500 3-Month Volatility Index, which I typically reference with the more pithy VXV ticker symbol.

For those not familiar with VXV, I am fairly sure I was the first person to discuss this index back in 2007, talk about the merits of the VIX:VXV ratio (which is a great way for someone without VIX futures quotes to keep on top of the VIX futures term structure), devote an entire Barron’s column to the subject (Take a Longer View on Volatility) and promote VXV as a better reflection of long-term and structural/systemic volatility than the VIX, which is better suited to measuring short-term event volatility.

For those who desire some additional background and context, there are shiploads of prior posts on the subject and the links below should provide for some excellent jumping off points.

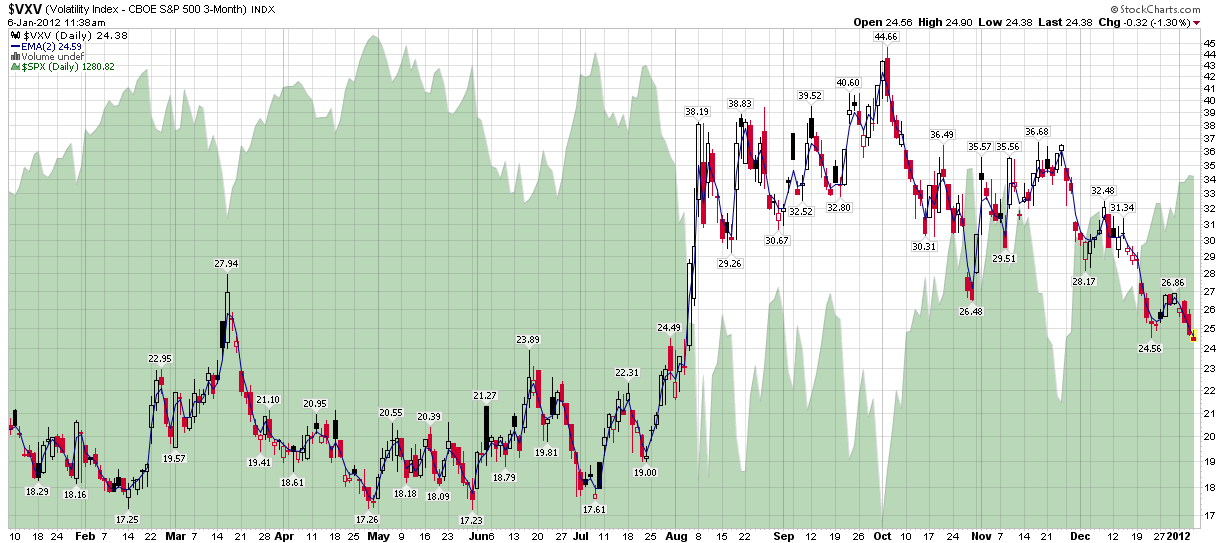
Getting back to VXV, I think it is important to note that while the VIX remains above its December lows, VXV has now moved below those lows and it plumbing levels that have not been seen since early August – and as VXV is a better gauge of structural and systemic risk than the VIX (not to mention largely untouched by the holiday effect), I think this is an important development to watch.

Frankly, the VXV chart looks a lot like it did back in early April 2009, when I penned Chart of the Week: VXV and Systemic Failure.  At that time I concluded, “The key takeaway: systemic healing is continuing and the risk of systemic failure is diminishing.” Based on the VXV chart, it appears as if we are at a similar moment in time right now.

Related posts:

[source(s): StockCharts.com]

Disclosure(s): The CBOE is an advertiser on VIX and More

Monday, April 25, 2011

Chart of the Week: VXV at Critical Juncture

It seems almost like heresy to consider something other than silver or the VIX as a candidate for the Stock of the Week, but since there have been so many posts and charts about both subjects, I thought I might offer a slightly different twist.

Yes, it is time for me to trumpet the importance of VXV once again. For those who may have forgotten, VXV’s formal name is the CBOE S&P 500 3-Month Volatility Index. The CBOE describes the index in detail here, but the key takeaway is that VXV is essentially a 93-day version of the 30-day VIX. In other words, whereas VIX looks out at just one month of potential volatility and disruptions to the financial markets, VXV has a time horizon of one quarter. This means, among other things, that while both capture the essence of the Q1 earnings reporting season, VXV includes three FOMC meetings and three nonfarm payroll reports, among other things. And whereas there may be no significant developments regarding Greek debt restructuring, it is unlikely that this issue will not be addressed in the next three months.

For these and other reasons, I have always felt that VXV provided a better reflection of long-term and structural/systemic volatility than the VIX, which is better suited to measuring short-term event volatility.

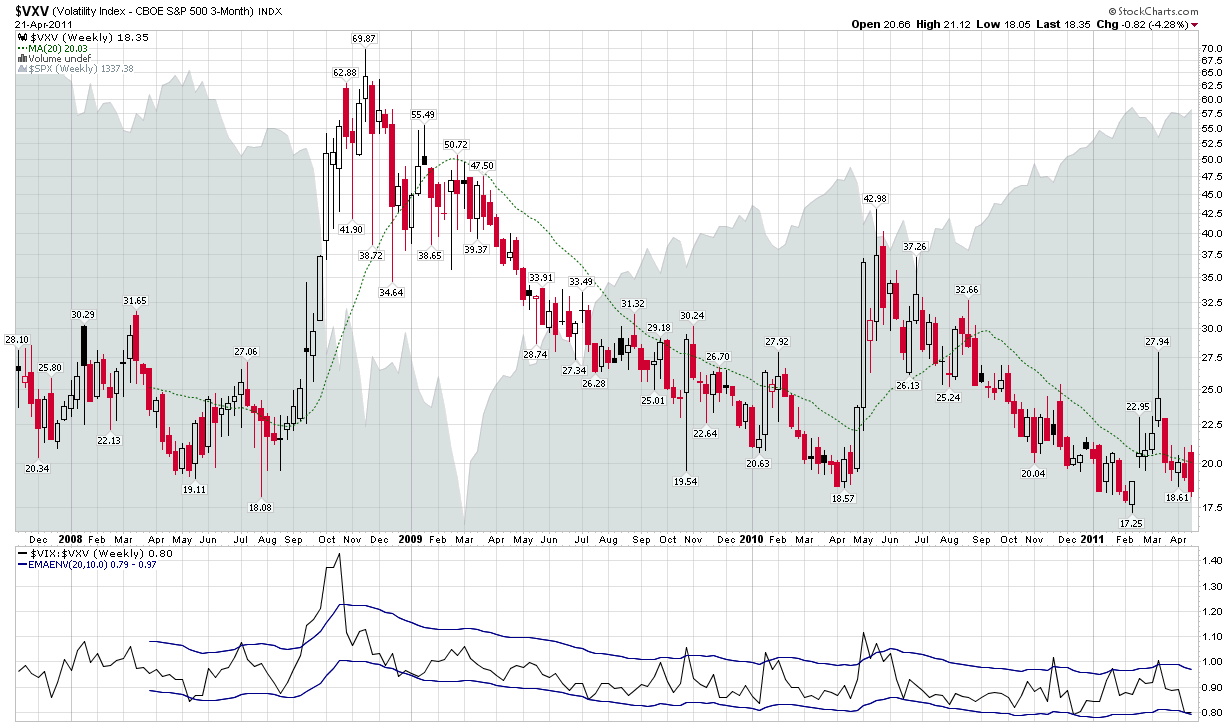
Looking at a weekly chart of VXV since its October 2007 launch, one cannot help but notice a pattern of historical support in the 17.50 – 18.00 zone. Friday’s close took VXV down to 18.35. A couple of closes below could signal not just a change in structural volatility and longer-term risk, but also the arrival of a new volatility regime.

Related posts:


Disclosure(s): neutral position in VIX via options at time of writing

[graphic: StockCharts.com]

Tuesday, April 27, 2010

Short-Term and Long-Term Implications of the 30% VIX Spike

Today the VIX spiked 30.6% and closed over 22.00 (22.81) for the first time since the middle of February. While 22.81 is not the kind of number that suggests panic is in the air, it should be noted that since the VIX was officially launched in 1993, the VIX has spiked 30% in one day on only seven prior occasions. Those prior spikes were in the throes of some volatility events that posed serious systemic threats – or what I call structural volatility. Prior 30% spikes occurred at the height of the 2008 financial crisis (twice), during the 1997 Asian financial crisis and in the wake of the 9/11 World Trade Center attacks in 2001. In this context, the current threat to Europe in the form of deficit problems in Greece, Portugal and the rest of the PIIGS strikes me as a less significant structural risk, at least for now.

Readers who have followed this blog for a long time will know that I am a proponent of fading most volatility spikes with short volatility positions such as short VIX options (e.g., calls and call spreads), short VIX futures, short VXX, short various index/ETF strangles and straddles, etc. In the 38 times the VIX has spiked at least 20% in a single session since 1990, the volatility index has been, on average, down 7% three days later and down 9% five days later. Approximately 75% of the time the VIX is down three and five days following a 20% one day spike. Even during the last three months of 2008, when the risk to the financial system was the highest it has ever been and stocks were on a steep downward trajectory, going long SPX/SPY on a 30% VIX spike was profitable for the 3-5 day holding period.

Fading VIX spikes over a longer holding period is a little more problematic. Set aside the 2008 data and the long-term results of fading a VIX spike are extremely promising. Include the 2008 data, however, and the fat tails make a longer-term holding period into the teeth of a crisis an unprofitable venture. The bottom line is that whether this is a quick storm or the beginning of a major crisis, a 3-5 day holding period should provide a statistical edge. Of course, if you can be certain that a major crisis will not develop, then a longer-term holding period will generate larger profits.

For those trying to put the fundamentals of the European debt situation and volatility risk into perspective, some time with A Conceptual Framework for Volatility Events and Forces Acting on the VIX may be helpful. Readers who are more interested in the numerical context of history may wish to study Elast-o-VIX and VIX Spike of 35% in Four Days Is Short-Term Buy Signal from the list below.

For more on related subjects, readers are encouraged to check out:

Disclosure(s): Short VIX and VXX at time of writing

Sunday, July 26, 2009

Chart of the Week: Volatility and Mean Reversion in 1987-88 and 2008-09

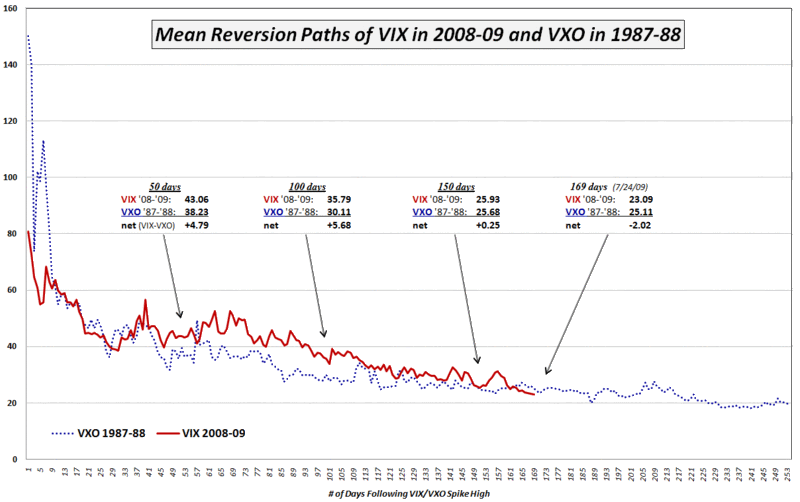
In this week’s chart of the week, I have elected to compare the aftermath of volatility spikes in 1987 and 2008. For the 1987 series, which begins with Black Monday, I have chosen to use a reconstruction of the ‘original VIX’ which has been tracked under the VXO ticker since 2003 and peaked at approximately 172; for 2008 I begin on November 20th, which the close of 80.86 is the highest VIX close ever.

The key takeaway is that for the first six months after the volatility spike high, post-spike volatility fell faster in 1987-88 than it did in 2008-09. This is not surprising in that the consensus of opinion is that there was much less structural volatility and a much shorter period of extreme risk during 1987-1988 than in 2008-09. Interestingly enough, however, now that we are eight months and 169 trading days removed the November 20th VIX spike, it turns out that volatility has fallen to much lower levels in the current environment than in the eight months following the 1987-88 volatility spike.

The graphic highlights that volatility remained at a higher level in 2008-09 than 1987-88 throughout the 50, 100 and 150 day milestone. In the last month, however, the absolute level of volatility for 2009 has been consistently lower than the readings from 21 years ago. Whether there is indeed less risk in 2009 than 1988 or whether the current period is simply characterized by higher levels of complacency remains to be seen.

For those who may want to chime in about comparing the VIX to the VXO, please note that the VIX closed at 23.09 on Friday and the VXO closed at 23.06. Using VXO data for 2008-2009 would result in the same takeaways and only slightly different data.

For a related post, see:

[source: Yahoo]

Friday, July 24, 2009

Forces Acting on the VIX

I have received quite a few requests to comment on the recent falling VIX, which stands at 23.23 as I write this, as well as the VIX:VXV ratio, how far I expect the current bull leg to run, etc.

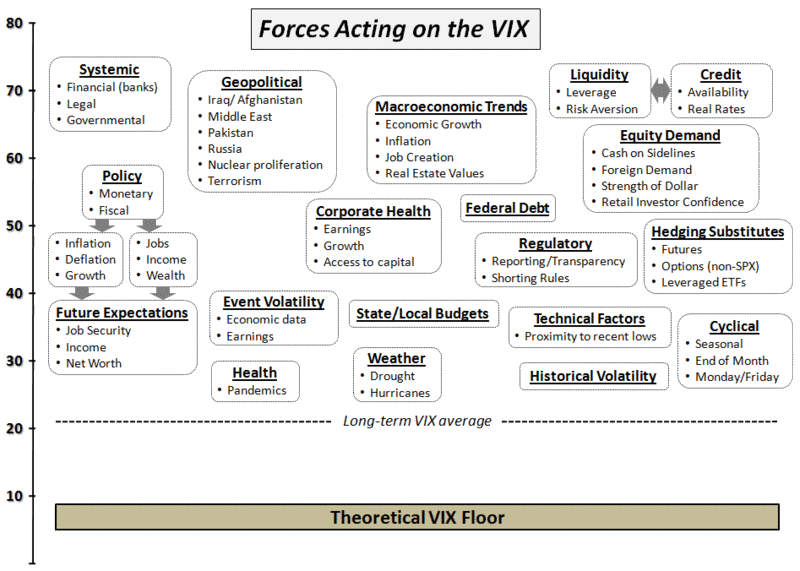
I will get to most of this over the weekend (and newsletter subscribers will invariably get a much more detailed sense of my thinking), but I thought this might be a good time to put up a graphic that attempts to capture some of the many forces that act on the VIX. Going forward, I believe having a framework to refer to when talking about the VIX might help ground some of the dialogue.

When all is said and done, the VIX reflects supply and demand for options on the S&P 500 index. The factors that affect movements in the VIX from day to day or week to week, however, are always in flux. The graphic below is the result of a brain dump I did this morning in an effort to put some of these factors onto a single page. I started in on grouping the forces that act on the VIX and using some arrows to indicate relationships between the various factors, etc., but this clearly requires a little more soak time before it will look like a finished product. For that reason, I thought I might post this graphic here and ask for reader feedback.

[Note that the relative positions of the shapes on the VIX axis are not necessarily indicative of the potential effect they might have on the VIX. At first I wanted the graphic to encapsulate each factor on a relative importance scale and yet also have grouping and arrows that helped to described the relationships across factors. I think this might have been a little too much wishful thinking in just two dimensions, so the graphic below has some of the relative importance and some of the relationships, but is far from the last word on the subject.]

Thursday, June 25, 2009

VIX:VXV Ratio Sell/Short Signal

The VIX closed at 26.36 today, down 15.4% from Monday’s close of 31.17 to the lowest closing level since the 25.66 close on September 12, 2008 – the last trading day before the Lehman Brothers bankruptcy was announced.

According to the classic 10 day simple moving average measure, which has the VIX currently sitting 11.7% below that level, the VIX is now in an ‘oversold’ position according to the TradingMarkets 5% Rule as well as a more stringent 10% threshold used by other traders.

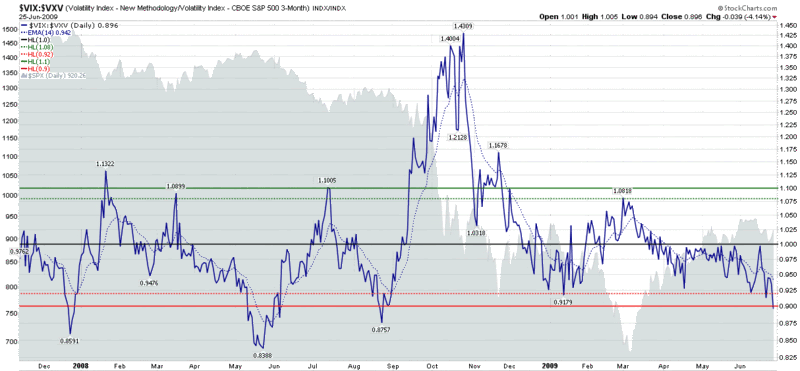
From a volatility term structure perspective, the VIX is also oversold. Notably, the VIX:VXV ratio, which compares 30-day volatility of SPX options to 93-day volatility (using the VXV index), closed today at 0.896 today. In the chart below, you can see that when this ratio closes at 0.92 or below, the bears tend to have an upper hand for at least several weeks. When the ratio drops below 0.90, as was the case today, the odds shift even more favorably in the direction of the bears.

In brief, the low current levels in the VIX:VXV ratio suggest that options traders are too bullish and complacent in their 30 day outlook (event volatility) relative to their 93 day outlook (structural volatility.) While these two volatility measures can be brought back into line by lowering estimates of long-term structural volatility, the path of least resistance is for short-term event volatility to rise. This means the odds favor that the VIX will move in the direction of the VXV, which closed at 29.41 today. Of course rising volatility tends to favor the bears at the expense of the bulls. Even with today’s exceptionally strong close, longs should consider taking profits and/or initiating short positions.

[source: StockCharts]

Disclosure: Long VIX at time of writing.

Tuesday, May 19, 2009

Where Will the VIX Bottom?

As I write this, the VIX is at 28.80, after making an intraday low of 28.51 earlier in the session. Since this is the first time the VIX has traded below 30.00 since the middle of September, I am finding there is a great deal of interest in and speculation surrounding where the VIX will ultimately bottom – and what the implications are for equities.

In both How Low Can the VIX Go? and The New VIX Macro Cycle Picture, I predicted that the VIX is not likely to drop below the 25-26 level – and I am standing by that prediction. Actually, in my newsletter I have been a little more precise, saying during the past few weeks that I do not anticipate the VIX falling below 28.00 “for this leg of the bull market.” Frankly, this leg looks a little long in the tooth to me at the moment, but based on the recent price action, the current phase has more of the appearance of consolidation than reversal or impending reversal.

I have weighed in on several occasions about the perils of using the full technical analysis toolbox on the VIX, largely because there is no underlying one can buy and sell, given that the VIX is really just a calculated value. For these reasons – and given the VIX’s tendency toward mean reversion – I tend to shy away from momentum indicators and oscillators when evaluating the VIX and treat moving averages and support and resistance with several grains of salt.

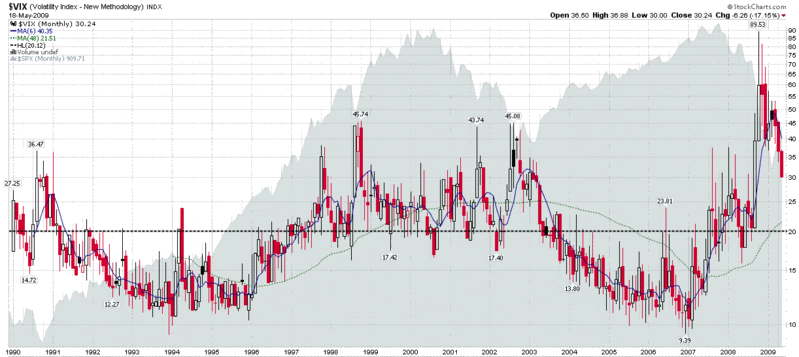
Let me take a minute and put a VIX of 25 into some historical context. First, the historical average of the VIX for 20 years of data extending back to 1990 is 20.12 (dotted black line in the chart below.) The mean VIX for all of 2008, which includes a relatively calm April through August, is 32.68. Looking back at the five year period of 1998-2002, which included the Long-Term Capital Management debacle and the end of the 1990s bull market, the average VIX during this period was 25.27. Current data show S&P 500 historical volatility for the 10, 20 and 30 day lookback periods at 30.88, 27.24 and 30.53, respectively.

The bottom line: 25.00 is a low number for a volatile period.

The VIX may be better analyzed in a macroeconomic and geopolitical context than in terms of technical analysis. Ultimately, the VIX is only rarely a fear index. Most of the time, the volatility index is more accurately a measure of uncertainty or investor anxiety. With the bank stress test results behind us, concerns about structural volatility and systemic risk are now receding and being supplanted by lower anxiety concerns that I like to refer to as event volatility. Sure, the economy may have another significant misstep ahead, but talk of wholesale bank nationalization and the prospect of 15% unemployment have been replaced by discussions of green shoots, bottoming and recovery.

[As an aside, for awhile now I have been thinking about constructing something akin to a Beaufort scale for volatility so we can put absolute measures of volatility into a broader context.]

Regarding the current volatility environment, while confidence and liquidity are returning to the markets, keep in mind that for many investors, the financial and psychological scars are still in the healing process. As long as events and markets continue to improve, that healing process will continue. Should events take a sudden turn for the worse, however, I would expect to see volatility spike dramatically in a case of echo volatility, much like what I described in What My Dog Can Tell Us About Volatility.

In the absence of another spike in volatility, I would also expect to see a dramatic decline in the rate that volatility is decreasing, as we begin to approach a floor in volatility. Even as fears dissipate, there is still uncertainty about the strength of the recovery in addition to the normal uncertainty about the direction of the economy and the markets that would be associated with a period of relative market calm.

Historical volatility, therefore, should provide a volatility floor and with historical volatility currently unable to drop below the low to mid-20s, we should begin to see evidence of that volatility floor shortly. I have seen some investors call for the flood of liquidity to push the VIX under 20. I just don’t see it, at least for now. There is the possibility that stocks enter into an extended period of range-bound trading that brings volatility down to the low 20s, but I would be surprised to see a sub-20 VIX by the end of the year.

In 2007, the VIX ended the year at 22.50. While my crystal ball generally does not extend more than a month or two, my best guess is that we see the VIX in the 22.50 to 25.00 range at the end of 2009.

[source: StockCharts]

Friday, April 10, 2009

Chart of the Week: VXV and Systemic Failure

When it comes to the chart of the week, anything goes. Now it its six month, this regular feature can highlight anything from an important economic data release to interest rates, bonds, index performance, market internals and even my strange and unusual ratios. My intent has been to keep volatility in the loop, but generally cast a wide net each week.

This week I am focusing on volatility, but probably not a measure that many readers pay attention. Specifically, I am speaking of the VXV. This index is essentially a 93 day version of the VIX, but for those who are interested in further digging, a good place to start is with my December 2007 Thinking About the VXV.

One reason I think the VXV is worth following is that I believe it gives a better perspective on structural volatility and systemic risk than its short-term counterpart, the VIX. For more on this subject, I encourage readers to check out my November 20, 2008 post, The VXV and Extreme Structural Volatility Risk.

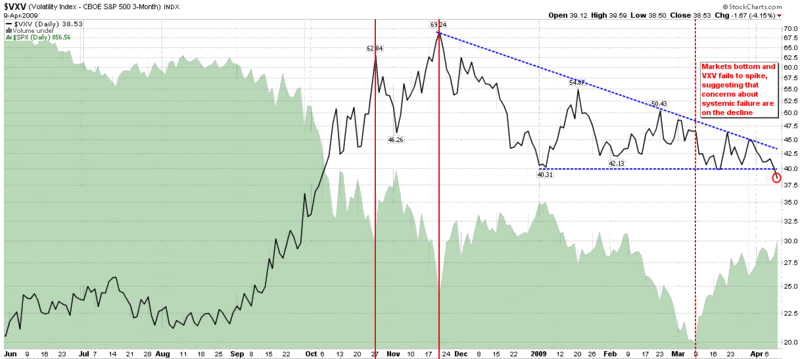
All this brings us to the chart below. The quick takeaway is that according to the VXV, structural volatility and systemic risk peaked on November 29th and has been in a decline ever since, as the dotted blue descending triangle reflects. I have also included three vertical red lines to show significant market bottoms. The first two generated significant VXV spikes and were eventually violated. The most recent bottom, which resulted in the SPX hitting 666, is shown with a dashed vertical red line. An important feature of that bottom is that the VXV did not spike, suggesting that there was no increase in systemic risk – perhaps part of the reason why the 666 bottom has held.

Finally, note that as of Friday (red circle), the VXV has dropped to levels not seen since the first week in October. The key takeaway: systemic healing is continuing and the risk of systemic failure is diminishing. When the VXV is able to make it back below 30, I suspect this will be an indication that systemic risk is once again at a manageable level.

[source: StockCharts]

Wednesday, March 11, 2009

More Volatility + Less Fear = Lower VIX?

Yesterday’s rally resulted in a 6.4% jump in the SPX and pulled the 10 and 20 day historical volatility in the SPX up to levels not seen since December. While very few investors are convinced that last week’s bottom is now safe, there is a growing sense that the markets may have backed far away enough from the precipice for everyone to be able to take a few deep breaths.

So we have more volatility and less fear – and the VIX falling 10.7% on yesterday’s rally.

Of course the VIX is all about forward-looking volatility and is less concerned with historical volatility, even though there is a high degree of correlation between the two.

In my opinion, the reason why violent upside moves in the SPX tend to result in a lower VIX even in the face of rising volatility is due to several factors. As noted above, one of those factors is a smaller fear component of the VIX when markets are rising. Another important factor that depresses the VIX during a large jump in the SPX is the much smaller number of investors who rush to buy put protection without giving much concern to price. Finally, history demonstrates that for the most part, markets tend to fall more sharply than they rise, so statistical measures of volatility are likely to show greater volatility when the SPX is making a large move down than when it is moving up sharply.

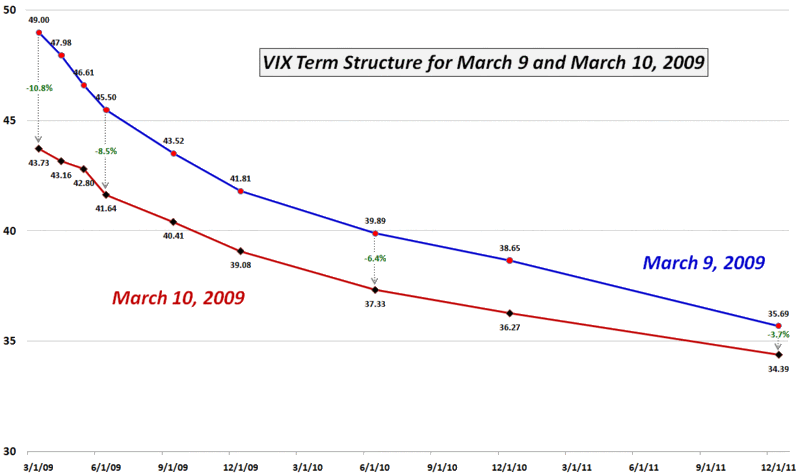
The chart below shows the changes in the VIX term structure from Monday’s close to yesterday’s close. As usual, the biggest drop in the VIX is in the front months with the two front months show volatility dropping about 10%. On the other hand SPX options 15 months out shows volatility dropping 6.4%, a relatively high ratio when compared to the front months. I submit that the distant months are reflecting not just a change in short-term concerns, but a sense that structural volatility and systemic risk are much less of an issue at the present time than had previously been believed.

[source: CBOE, VIX and More]

Thursday, November 20, 2008

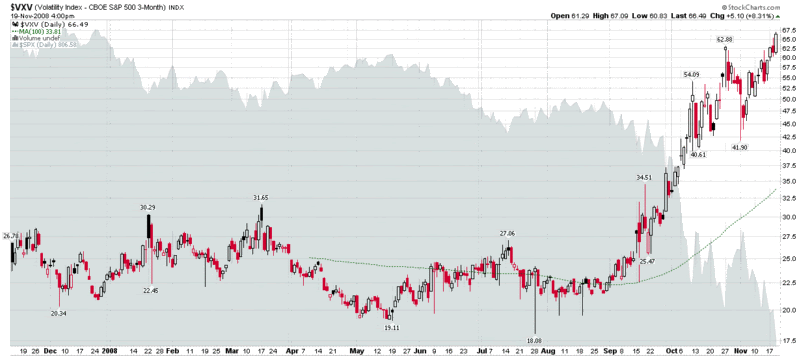
The VXV and Extreme Structural Volatility Risk

In early October I set forth some of my ideas around how to think about volatility in A Conceptual Framework for Volatility Events. Today I want to briefly touch upon a topic that is tangential to that conceptual framework and closely linked to the VIX:VXV ratio that I talk about on a regular basis.

My thesis is simply this: the VIX looks out 30 days into the future and captures “event volatility” – or the volatility that is associated with events that are expected to occur in the next 30 days. These include Fed meetings, important economic data releases (employment report, consumer prices, retail sales, durable goods orders, GDP, etc.), earnings from bellwether stocks, even hurricanes, geopolitical crises and other events which can expect to cast a shadow over the course of the next 30 days.

The other half of the thesis is that the VXV (essentially a 93 day version of the VIX) always incorporates a full earnings cycle and a full economic data release cycle – so these events have very little impact on the VXV. As a result, the volatility that is relevant to the VXV is structural or systemic.

If this thesis is correct, it has some interesting implications for interpreting the VIX:VXV ratio and the VXV in isolation. For instance, yesterday’s new highs in the VXV, which occurred without the VIX even coming close to a new record, suggests that traders are currently pricing in record amounts of structural or systemic risk. In the long run, this "structural volatility" is a lot more dangerous than the event risk associated with the VIX.

[source: StockCharts]

DISCLAIMER: "VIX®" is a trademark of Chicago Board Options Exchange, Incorporated. Chicago Board Options Exchange, Incorporated is not affiliated with this website or this website's owner's or operators. CBOE assumes no responsibility for the accuracy or completeness or any other aspect of any content posted on this website by its operator or any third party. All content on this site is provided for informational and entertainment purposes only and is not intended as advice to buy or sell any securities. Stocks are difficult to trade; options are even harder. When it comes to VIX derivatives, don't fall into the trap of thinking that just because you can ride a horse, you can ride an alligator. Please do your own homework and accept full responsibility for any investment decisions you make. No content on this site can be used for commercial purposes without the prior written permission of the author. Copyright © 2007-2023 Bill Luby. All rights reserved.
 
Web Analytics