The New VIX Macro Cycle Picture
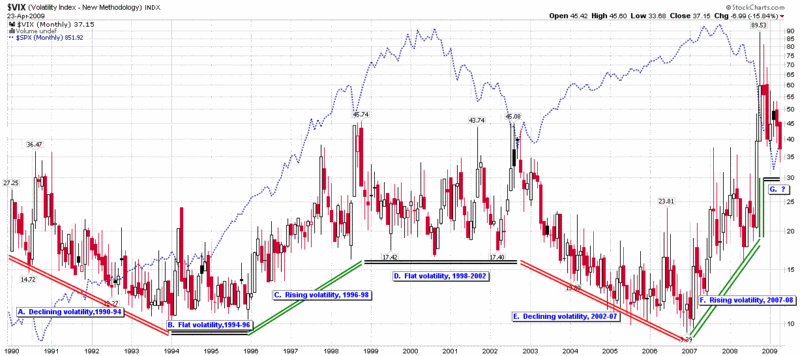
Since the dawn of VIX data, which extends back to 1990, the VIX has shown a tendency to move in cycles of 2-4 years that I refer to as VIX macro cycles.
The chart below shows six distinct VIX macro cycle periods of declining, rising or flat volatility. For now I have assigned a letter to each period, but at some point I may go back and name each of them, describe the various influences on volatility during the period and set about establishing a fundamental and technical basis for classification.
My goals for today are much more modest. For the moment I am establishing January 2007 to November 2008 as the official endpoints of the most recent period of rising volatility. As of December, we are in a new VIX macro cycle. While the first few months of this new volatility era showed a dramatic decline in volatility, I suspect that volatility will flatten out relatively soon, as was the case when the volatility spikes of 1994 and 1998 ushered in a period of relatively flat volatility.
Note from past volatility spikes that the initial snap back to lower levels of volatility typically last from 4-6 months after peak volatility. If this pattern were to be repeated once again, then I would expect volatility to put in a new bottom in no more than the next 2-3 weeks.
Guessing where volatility will find a new plateau is not easy, but for now I am establishing a provisional bottom of 30. Ultimately, I would not be surprised if I move the bottom down to somewhere in the 25-27 range, but there is a lot of work to be done before that much fear and volatility can be driven from the collective investor psyche and markets are able to establish a degree of comfort with the various financial and economic institutions that will shape the major events and policies of the next few years.

[source: StockCharts]


0 comments:
Post a Comment