VIX High or Low? It Depends…
The question of whether the VIX, which closed at 36.53 on Thursday, is high or low, depends a great deal upon the historical backdrop one uses to make the comparison.
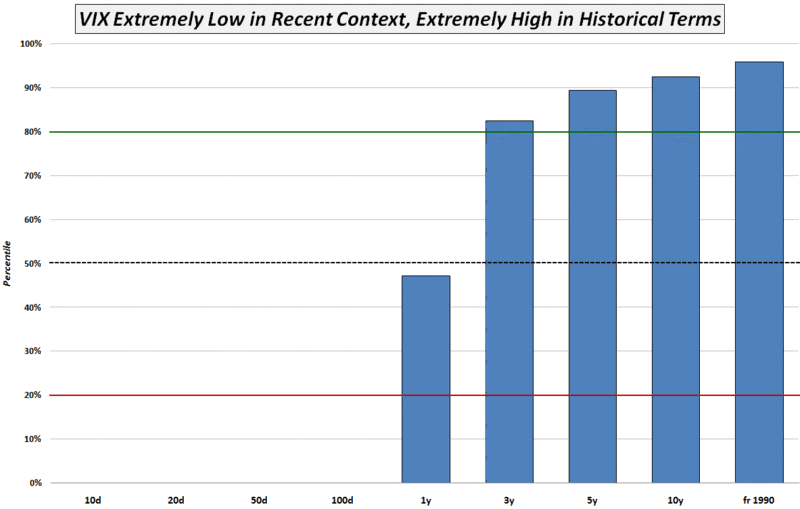
In the chart below, I have represented 36.53 as a percentile based upon prior VIX readings of 10 days, 20 days, 50 days, etc. going back all the way to the beginning of VIX historical data in January 1990. The chart paints an interesting story. As the VIX is the lowest it has been in more than 100 trading days, Thursday’s close puts it at the 0.0 percentile level for all periods up to and including 100 days.
If, however, you place the current VIX in the context of 20 years of historical data going back to 1990, suddenly the VIX is in the 95.8 percentile. As the chart shows, even looking at three years of historical data puts the VIX at an 82.4 percentile level.
Finally, one year of data suggests that the VIX is in the 47.4 percentile, right in the middle of its recent historical range.
So…the VIX is both extremely high and extremely low in historical terms, depending upon the lookback period. For short-term trades, I find the 10 day and 20 day data to be most useful in helping to create profitable mean-reversion setups, though long-term investors should probably look at the VIX relative to a multi-year history as being the most relevant indicator of the future direction of volatility.

[source: VIXandMore]


7 comments:
Bill,
I discussed the same idea today: Is it time to buy or sell vega, based on it's Friday close under 37.
Hi Mark,
For me the choice has been an easy one since November, but now I am neutral on volatility. More accurately I think volatility lifts for the next two weeks or so, then starts back down again...but it's anyone's guess at this stage.
Cheers,
-Bill
P.S. I finally got around to ordering your book from Amazon and am looking forward to reading it.
Bill, I have to respectfully disagree that this is a good way to look at mean reversion for the VIX. I have to admit I haven't done a careful analysis of historical volatility, but I did glance at a chart once and it seemed to support my general impression of the VIX data.
Pretty much the idea is that there is something "special" about the 30-40 range. I'm not sure if it's mathematical or psychological, but the market really doesn't like being in that range and it's some sort of switching mechanism that was really only broken once in the post-WWII period with the 87 crash and the Great Depression volatility looks similar to today.
In my (admittedly qualitative) viewpoint, you can't model that region with a mean reversion type process, and in nonlinear systems vocabulary it's more of a bifurcation. I'd be very surprised if the VIX meandered very long where it is, I think it'll either jump back above 40 in the next few weeks and continue upwards dynamics there, or (what I have money on) is for it to collapse very quickly in two-three weeks as the rally days get taken off HV.
i think vix has more room to go lower. my lowest target range is 30. i also think the market will tank soon after vix reaches its low.
This may or may not be the place to ask the question, but can you comment on the Credit Suisse Fear Barometer? Can it be used with the VIX to extract more information out of the data?
Another Bill
I view the 40 line as resistance in a bull market and support in a bear market.
It is harder to push a cart up a hill so the rate of ascent is slow and steady; typical of a bull market. On the descent it is more difficult to control the cart's speed as its weight contributes to the downward momentum; action typical of a bear market.
Forty is the new zero for the VIX!
Bill
Can I suggest another way of viewing whether the VIX is high or low? How about comparing the VIX with what you think it 'should' be given the fundamentals / economy etc. On that basis I think that the VIX is extremely.....low.
Douglas
Post a Comment