Today’s 34% VIX Spike and What to Expect Going Forward
One of the top posts of 2013 was All-Time VIX Spike #11 (and a treasure trove of VIX spike data), in which I sliced and diced the twenty largest one-day VIX spikes in the history of the VIX. Nineteen of those spikes were in excess of 30% and with all-time #5 arriving later in 2013 and all-time #15 and #16 following in 2014, I was compelled to comment that despite the seemingly low VIX and concerns about complacency, 2014 Had Third Highest Number of 20% VIX Spikes.
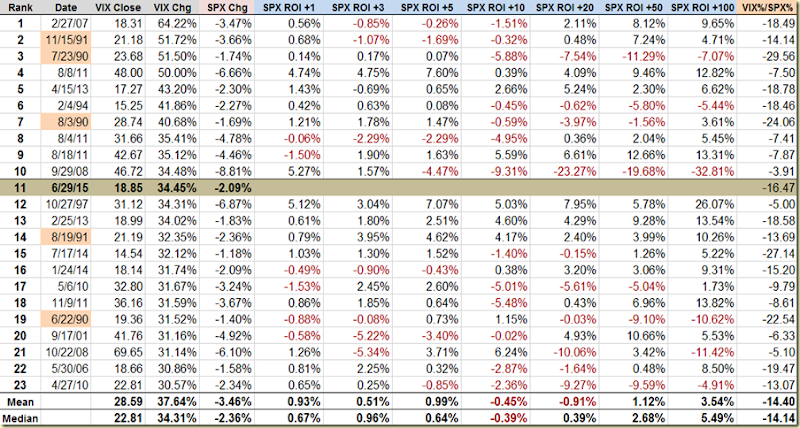
Fast forward to the present and for all the talk of a low VIX, some forget that the second day of 2015 had a 28.1% VIX spike and then today, we saw a 34.5% VIX spike, the eleventh largest in the history of the VIX and enough to trigger an update to the table of largest one-day VIX spikes below.
[source(s): CBOE, VIX and More]
Note that based on the data for the 23 VIX spikes in excess of 30%, the SPX has a tendency to outperform its long-term average over the course of the 1, 3 and 5-day periods following the VIX spike. Also worth noting that that 10 and 20 days following the VIX spike, the SPX has a tendency not only to underperform, but decline. Further, while the huge decline following 9/29/2008 VIX spike tends to dwarf the other data points, even when you remove the 9/29/2008 VIX spike it turns out that the SPX still loses money in the 10 and 20-day period following a VIX spike. When the analysis is extended out 50 trading days, the SPX is back to being profitable, but performing below its long-term average. On the other hand, when the analysis includes 100 days following the VIX spike, the SPX is back to outperforming its long-term average.
With the caveat that this is a limited data set, it is still worth flagging the pattern in which following a 30% one-day VIX spike, there appears to generally be a tradable oversold condition in stocks that lasts approximately one week, followed by a period of another month or so in which the markets typically has difficulty coming to terms with the threat to stocks. One quarter later, however, all fears are generally in the rear view mirror and stocks are likely to have tacked on significant gains.
This type of pattern supports the idea of both short-term and longer-term mean reversion, but calls into question the role of mean reversion in the 10-20 days following a VIX spike, perhaps has fundamental factors begin to win out over a technically oversold condition in stocks.
Now that we have a template, let’s see how well it works for the current market environment.
Since the events of the day have given all of us a fair amount to think about, I have included a larger than usual number of related and tangential links below for those who wish to do a little extra reading.
Related posts:
- 2014 Had Third Highest Number of 20% VIX Spikes
- All-Time VIX Spike #11 (and a treasure trove of VIX spike data)
- The Biggest VIX Spike Ever: A Retrospective
- VIX Sets Some New Records, Suggesting Volatility Near Peak
- Highest Intraday VIX Readings
- Short-Term and Long-Term Implications of the 30% VIX Spike
- VIX Spike of 35% in Four Days Is Short-Term Buy Signal
- Lessons from the Post-2/27 VIX Price Action
- VIX Approaches Pre-2008 Record Highs
- VXO Chart from 1987-1988 and Explanation of VIX vs. VXO
- Volatility History Lesson: 1987
- Volatility During Crises
- Chart of the Week: VXV and Systemic Failure
- Euro Volatility and Risk
- The Evolution of European Equity Risk
- Forces Acting on the VIX
- A Conceptual Framework for Volatility Events
Disclosure(s): short VIX at time of writing; the CBOE is an advertiser on VIX and More


