VIX Spike of 35% in Four Days Is Short-Term Buy Signal
It has been awhile since I posted one of my VIX studies and given the recent spike in the VIX, today’s action seemed like a good excuse to revisit the idea of VIX spikes as contrarian bullish mean reversion buying opportunities.
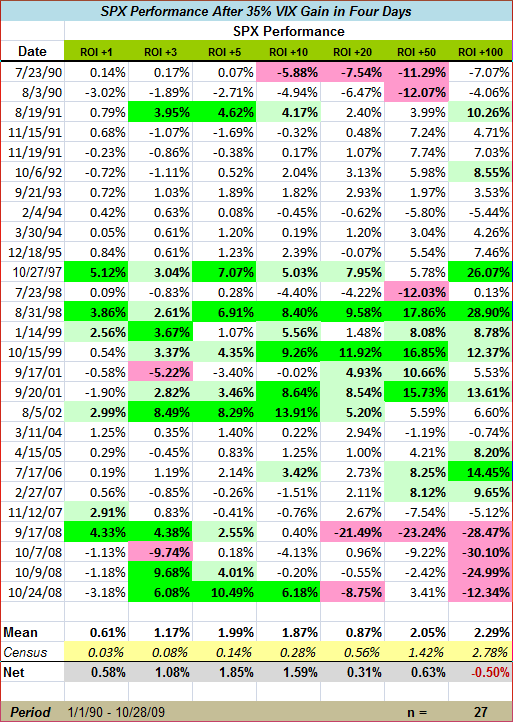
Today the VIX closed at 27.91, which is up 34.9% in the four trading days since Thursday’s close of 20.69. Over the course of the 20 year history of the VIX, the volatility index has posted close-to-close four day gains of 35% on 42 occasions. If you strip out the consecutive instances of +35% days, this leaves 27 instances in which the VIX crossed above +35% in four days. I have reproduced the full table of these 27 instances below for several reasons. First, the key takeaway is that from a timing perspective, a long SPX position entered after a 35% spike will generally perform best over the course of a five day time horizon. In the graphic below, the 27 instances average a five day gain of 1.99% vs. a typical five day SPX return of 0.14%, for a 1.85% net differential. While the net differential peaks at five days, it is apparent in just one day and persists for at least fifty trading days.
Not surprisingly, since we are talking about extremely volatile periods, quite a few of the returns are at the tail end of the distribution and are highlighted in green and red. In particular, this contrarian long strategy did an excellent job of timing the bounces off of the lows during the Asian financial crisis in 1997, the Russian financial crisis and Long-Term Capital Management crisis in 1998, the 9/11 World Trade Center attacks in 2001, as well as the technology bottom following the WorldCom bankruptcy filing in 2002.
In contrast to the excellent market timing above, it should also come as no surprise that the four long signals from September and October 2008 turned out to be disasters in the 20-100 day time frame. Over the course of a 3-10 day time horizon, however, these were excellent short-term trading opportunities from the long side. I do wish to point out, however, that if one strips out the last four rows of the tables, suddenly the 100 day time frame has a return of 6.86%, which is 2 ½ times that of the baseline (“census”) return. The obvious conclusion is that the VIX spike buy signal is quite reliable for the short-term, but not as reliable for over longer time frames. This is the key take away from the table and the reason I included the full data set. The secondary conclusion is that VIX spikes are generally good long setups as well, but here the risk is that it precedes a once in a generation or two meltdown that erases a decade or more of returns.
Finally, while it is nice to throw statistics at analogous historical situations, it is important to consider that all it takes is one rogue GDP number to throw a monkey wrench into an attractive set of statistics. Tomorrow should be interesting – and I expect the bulls will be putting a great deal of capital to work no matter how the GDP data falls.
For posts on related subjects, readers are encouraged to check out:
- VIX Jumps 10% on Consecutive Days
- Long the SPX on New VIX Record Closes
- Lessons from the Post-2/27 VIX Price Action

Disclosure: Short VIX at time of writing.

