Pullbacks in the 2009 Bull Market
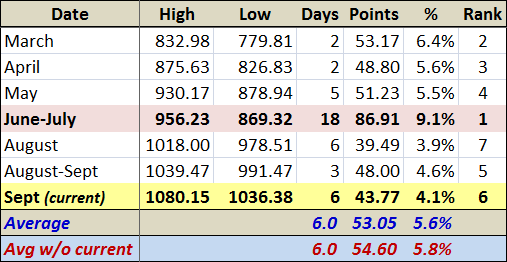
Nearing the halfway point in today’s trading session, the S&P 500 index has made an intraday low of 1036.38, which is below the recent September 25th low of 1041.17 and about 4.1% below the September 23rd high of 1080.15.
This 4.1% pullback is the seventh significant pullback since the current bull market began back in March. The table below summarizes all the pullbacks of 3.9% or more from the intraday highs to the intraday lows. The current pullback, highlighted in yellow, represents the second longest in terms of duration from the high to the low. As far as the magnitude of the pullback, however, 4.1% ranks sixth out of seven. The average (mean) pullback prior to the current one has been 5.84%. Applying an average pullback to the 1080.15 high would imply a pullback to about SPX 1017.
Some other technical factors have me looking for support in the 1020-1025 area. Should that support fail to materialize, I would not be surprised to see SPX 1017 taken out quickly and the SPX test 1000 in short order.
All things being equal, however, there is no reason to assume that the recent history of short and relatively shallow pullbacks should not continue into the future, with SPX 1100 a more likely next stop than SPX 1000.


3 comments:
Thanks Bill - My charting shows support for SPY between 102-103. Today's close will be important to see if we will need and ABC correction or we can just rally from here. Earning season is upon us starting with AA Oct 7th.
I disagree, technically there are a lot of reasons why the market would pull back to at least 950 and possibly form a decisive top. I´m looking at the recent and incoming withdrawl´s of free money support from the Fed as a cue, as well as looming unwindings in derivatives caused by a CIT bankrupcty or about 20 other possible major bankruptcies.
But hey, this is the market, its beautiful. I tend to bet on volatility and think the markets are in for a profound downtrend pretty soon, and you sell volatility and think we´re in a bull market, we´re both free to put our money where our mind is.
Regarding SPX 1100, we need to see what happens with the bear wedge and weekly moving average supports, today´s action may be the start, the market needs to paint a fractal overnight and then get broken through during London or tomorrow morning. Maybe we´ll see a big rally or a slow grind down, but I think a sharp break is more likely should today´s lows be breached.
Good points, Patrick. I am particularly concerned about the turning down or off of the liquidity faucet.
On the technical side, 1080 may be formidable resistance, but so far 1020 has held as support.
Earnings season will certainly put pressure on one or both sides of this range.
Cheers,
-Bill
Post a Comment