Implied Volatility Flat Ahead of Bank Earnings
With some very important earnings in the financial sector coming up this week (JPM on Wednesday; C and GS on Thursday; BAC and GE on Friday), I have been watching implied volatility (IV) in the sector very closely. Much to my surprise, implied volatility has not increased ahead of earnings, as is typically the case.
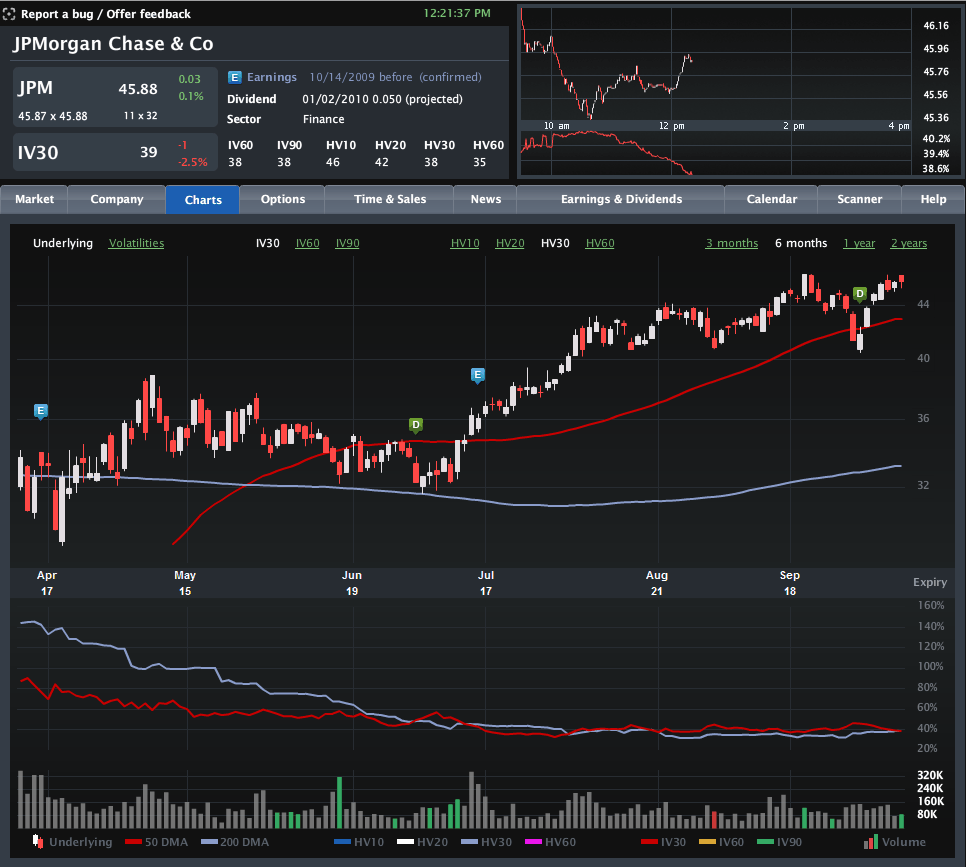
The chart below, courtesy of Livevol, shows six months of price and volatility activity in JPMorgan Chase (JPM), with the upper portion chart highlighting the last two earnings releases with the blue “E” icon. The bottom half of the chart plots 30-day implied volatility (red line) against 30-day historical volatility (light blue line) during the same period.
Note that just prior to the last two earnings reports, implied volatility rose due to the uncertainty and potential for higher volatility associated with an earnings surprise. This time around, however, the lack of movement in implied volatility – as well as the proximity of the IV level to historical volatility – suggests that investors are not expecting any surprises at all. In fact, this situation is not specific to JPMorgan, but is also mirrored at Citigroup, Bank of America, Goldman Sachs and even quasi-financial General Electric. Not surprisingly, the bank ETFs, such as KBE, and the financial sector ETF, XLF, show a similar pattern.
No matter how the current earnings season unfolds, it is difficult to imagine that there will not be any surprises. Investors who think implied volatility is underestimating the surprise potential for the banks may look to initiate long straddles or long strangles to take advantage of a potential increase in implied volatility – and hence options prices.
For some related posts on implied volatility in financials, readers are encouraged to check out:
- Implied Volatility of 19 Large Financial Institutions: Now vs. 52 Week Highs
- FAS Is Now XLF
- Are FAS Options Cheap with an Implied Volatility of 232?

[source: Livevol Pro]

