Showing posts with label GS. Show all posts

Thursday, May 10, 2012

Looks Like Apple VIX (VXAPL) Futures Are Coming Soon

In case anyone missed it, I wanted to highlight a report yesterday from Reuters which quoted  Edward Tilly, President of CBOE Holdings, as saying that not only is the VIX product line ripe for expansion, but:

“We have benchmarks on a number of other products. I would point out one that is a favorite of mine that I wouldn't be surprised if I saw us launch in the near future - futures on Apple VIX.”

The Apple VIX (VXAPL) was launched in January 2011 along with similar single stock volatility indices for the following:

  • Amazon (AMZN): volatility ticker: VXAZN
  • Google (GOOG): volatility ticker: VXGOG
  • Goldman Sachs (GS): volatility ticker: VXGS
  • IBM (IBM): volatility ticker: VXIBM

A successful launch of futures on VXAPL might open the door for futures on one or more of the other single stock volatility indices above.

The chart below, courtesy of Livevol (StockCharts.com, you really should have VXAPL in your database) shows that VXAPL has tended to remain in the mid-30s, but has ranged between the high teens to the high 50s in the first 17 months of its life.

Recall that the CBOE Futures Exchange (CFE) launched futures on the emerging markets volatility index (VXEEM) in December 2011 and followed up by launching options on VXEEM at the end of January. The CFE also launched futures based on VXEWZ (CBOE Brazil ETF Volatility Index, which is based on EWZ) on February 21 and added options to VXEWZ on March 6.

If you enjoy trading volatility products, it looks like we may be entering the golden era of shrink-wrapped volatility indices, which can serve as a product platform for futures, options and even exchange-traded products. If you think VIX-based ETPs are fun, just wait until a VXAPL-based ETP is rolled out. Of course, if there is not enough demand for the futures and options, some of these ETPs may never see the light of day, so early adopters, don’t shy about hitting some of those bids.

Finally, on a somewhat tangential note, I think I received more emails on The Case for Selling Apple Puts than on any other post in the history of VIX and More. To all those who wrote, including those who elected to sell Apple (AAPL) puts, the current environment may be suitable for a revisiting this trading strategy.

Related posts:

[source(s): LivevolPro.com]

Disclosure(s): long AAPL at time of writing; Livevol and the CBOE are advertisers on VIX and More

Wednesday, January 5, 2011

CBOE to Publish VIX-Style Volatility Indices for Individual Stocks

The volatility space continues to expand in the direction of the atomic level, with today’s announcement by the Chicago Board Options Exchange (CBOE) that it will begin disseminating implied volatility data utilizing the VIX calculation methodology for five stocks as of Friday, January 7th.

The five stocks are:

My initial thought include some of the following:
  • It will be interesting to see how much divergence there will be between the CBOE NASDAQ 100 Volatility Index (VXN) and the volatility indices for some of the key components of the NASDAQ-100 index, notably Apple, Google and Amazon
  • A Goldman Sachs volatility index will be particularly useful in terms of financial crisis
  • IBM is an interesting choice for a fifth wheel here, as IBM does not have the same bellwether status that it once did
  • Finally, first with weekly options and now with volatility indices for individual stocks, the CBOE has managed to shorten the scope of volatility analysis both at the issue level and in terms of the time frame. I’m calling this the march toward atomic volatility.
Related posts:
Disclosure(s): the CBOE is an advertiser on VIX and More

Sunday, April 18, 2010

Chart of the Week: Goldman Sachs

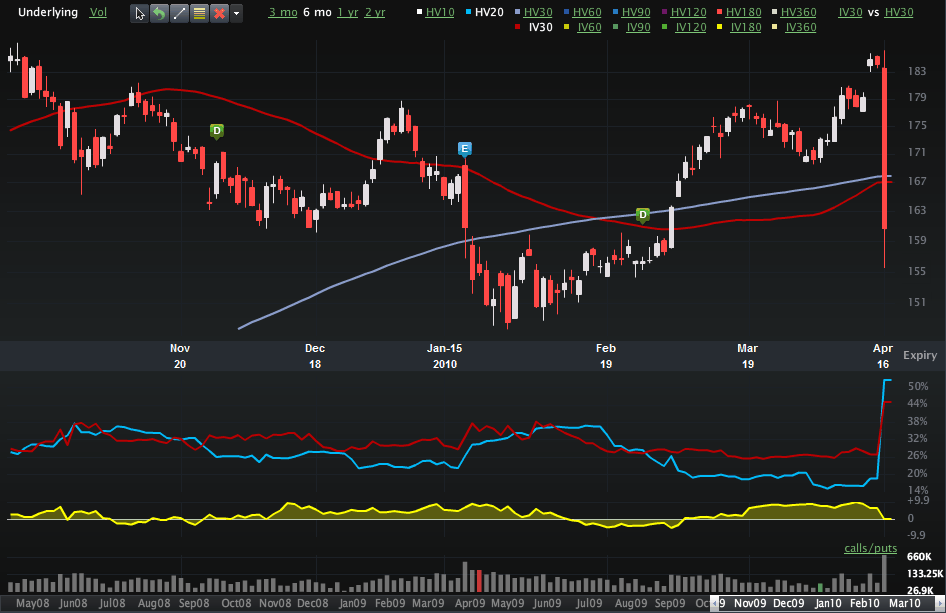
There is no reason to get fancy with this week’s chart of the week. The big story of the week was accusations of fraud at Goldman Sachs (GS), with the SEC claiming Goldman misrepresented the selection process for some collateralized debt obligations (CDOs) resulting in a fraud worth $1 billion.

The chart below captures six months of price action in GS and shows how Friday’s selloff erased most of the gains in the stock from the last three months. Of particular interest is the spike in both historical volatility (HV20) and implied volatility (IV30), with historical volatility now higher than its forward-looking implied volatility counterpart. With elevated volatility, options traders are loving GS for now, whether they have thoughts about the future direction of GS stock or are just looking to sell options to capture the extra premium.

Note that Goldman is scheduled to report earnings before the market opens on Tuesday.

For more on related subjects, readers are encouraged to check out:


[source: Livevol Pro]

Disclosure(s): Livevol is an advertiser on VIX and More

Monday, October 12, 2009

Implied Volatility Flat Ahead of Bank Earnings

With some very important earnings in the financial sector coming up this week (JPM on Wednesday; C and GS on Thursday; BAC and GE on Friday), I have been watching implied volatility (IV) in the sector very closely. Much to my surprise, implied volatility has not increased ahead of earnings, as is typically the case.

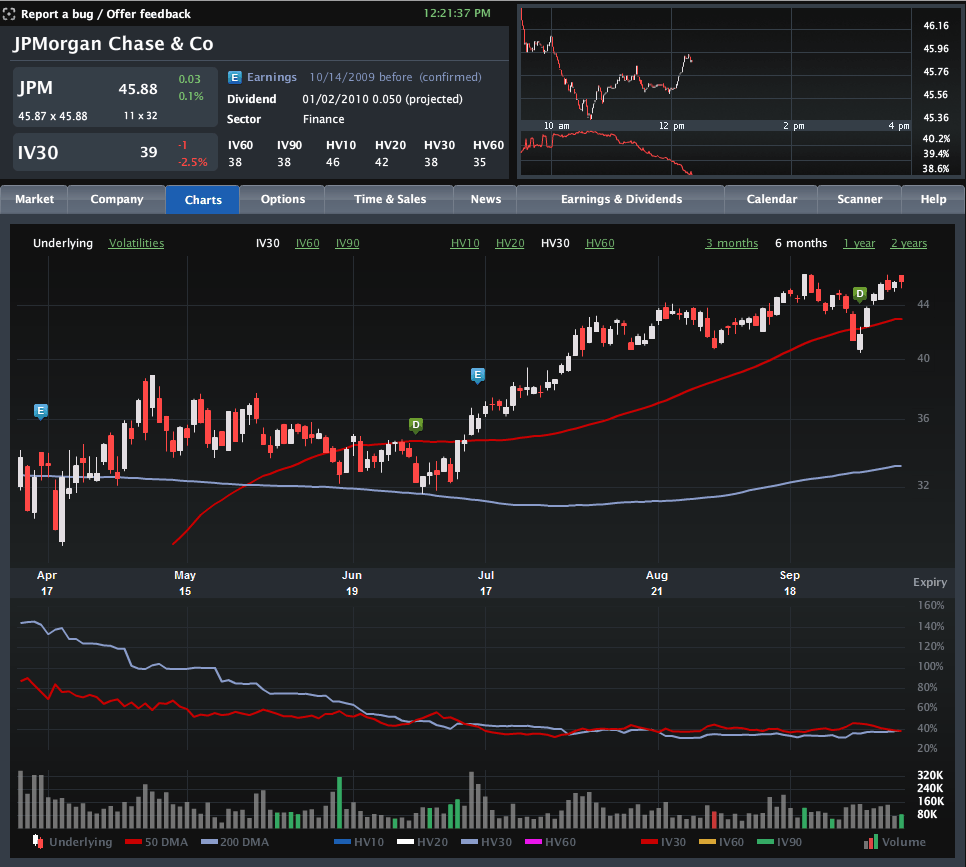
The chart below, courtesy of Livevol, shows six months of price and volatility activity in JPMorgan Chase (JPM), with the upper portion chart highlighting the last two earnings releases with the blue “E” icon. The bottom half of the chart plots 30-day implied volatility (red line) against 30-day historical volatility (light blue line) during the same period.

Note that just prior to the last two earnings reports, implied volatility rose due to the uncertainty and potential for higher volatility associated with an earnings surprise. This time around, however, the lack of movement in implied volatility – as well as the proximity of the IV level to historical volatility – suggests that investors are not expecting any surprises at all. In fact, this situation is not specific to JPMorgan, but is also mirrored at Citigroup, Bank of America, Goldman Sachs and even quasi-financial General Electric. Not surprisingly, the bank ETFs, such as KBE, and the financial sector ETF, XLF, show a similar pattern.

No matter how the current earnings season unfolds, it is difficult to imagine that there will not be any surprises. Investors who think implied volatility is underestimating the surprise potential for the banks may look to initiate long straddles or long strangles to take advantage of a potential increase in implied volatility – and hence options prices.

For some related posts on implied volatility in financials, readers are encouraged to check out:

[source: Livevol Pro]

Tuesday, September 15, 2009

Implied Volatility of 19 Large Financial Institutions: Now vs. 52 Week Highs

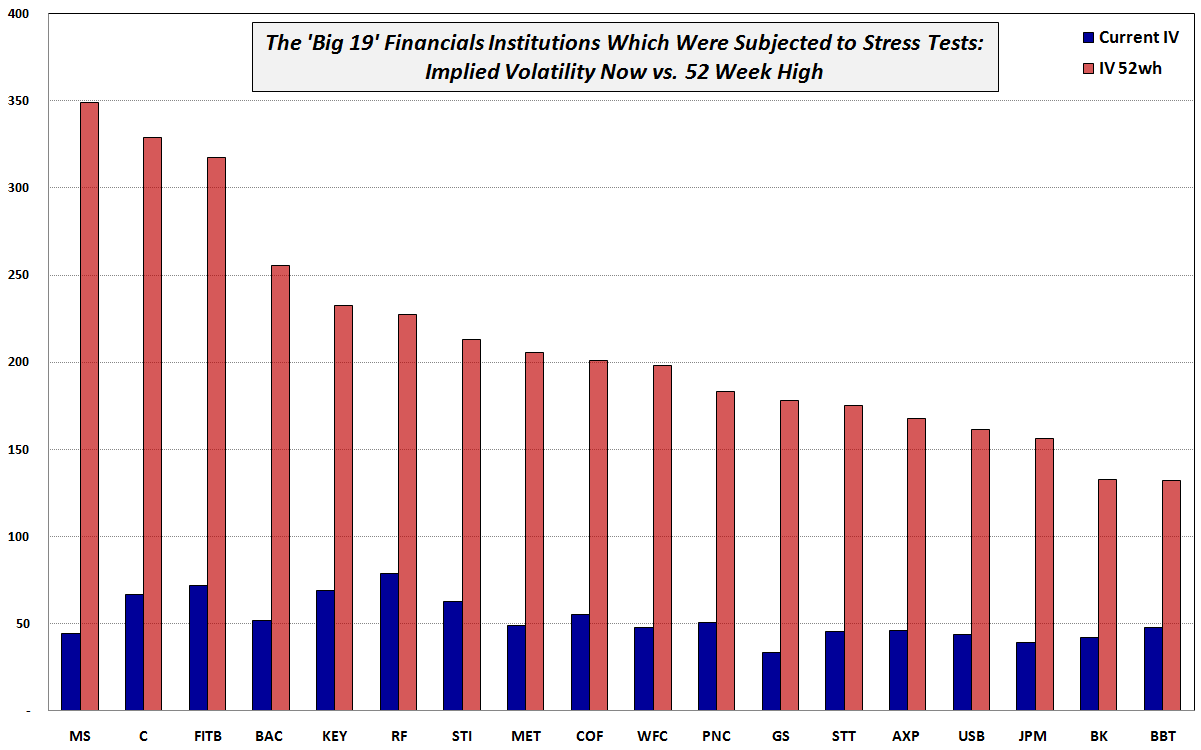
Sunday’s chart of the week, which looked at Implied Volatility of DJIA Components: Now vs. 52 Week High, received enough interest to warrant a follow-up that examines the current implied volatility vs. the 52 week high IV of the 19 financial institutions which were subjected to the government stress tests. [link to stress test results]

The chart below sorts the financial institutions from left to right according to their 52 week implied volatility highs, with GM omitted. While not captured in the graphic, I find it interesting that the two institutions whose current IV is the lowest compared to the high IV are Morgan Stanley (MS) at 12.7% of the 52 week high and Goldman Sachs (GS) at 18.9% of the 52 week high. Those institutions whose current IV is closest to the 52 week high (in percentage terms) are BB&T (BBT) at 36.3% and Regions Financial (RF) at 34.6%.

So…going solely on the percentage retracement from implied volatility highs, it appears as if the investment banks are healthiest and have shed the most risk, while regional banks have undergone a much more measured healing process – about what one might expect. Clearly this is a story of multiple different pathways back to financial health.

[source: International Stock Exchange]

Monday, March 30, 2009

Recent Financial Sector Component Performance

Back in early December, in Breaking Down the Financial Sector Post-Lehman, I contrasted the broad-based KBW Bank Index ETF (KBE) with several other KBW financial sector ETFs, notably KRE (KBW regional banking index), KCE (KBW capital markets index) and KIE (KBW insurance index.) At that time, the regional banking index was holding up better than its siblings, but had begun to show some weakness.

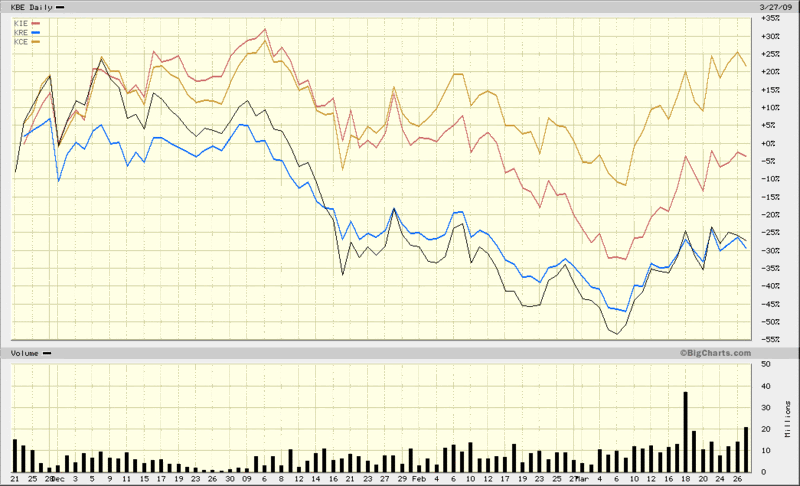
Fast forward almost four months and in the chart below I contrast the performance of the same quartet of ETFs since the November 21st bottom (SPX 741), when things probably looked darkest for the financial sector.

Notice that now the capital markets group (with top holdings of GS, MS, CME, SCHW and STT) is sporting gains of over 20% since this period, while insurance stocks are almost back to breaking even and both banking ETFs, the regional and money center variants, have been bring up the rear, moving almost in lockstep as of late and showing losses in excess of 25% for the period in question. All four groups have bounced impressively off of the March lows, but once again, it is the capital markets group that has showed the most strength, with State Street (STT) leading the way.

[source: BigCharts]

Tuesday, November 25, 2008

Citigroup Rescue Triggers Improvement in Credit Default Swaps

Yesterday’s announcement of a $306 billion toxic asset safety net for Citigroup (C) was warmly received in the equity markets and has the potential for helping triggering the first three day rally in stocks since what seems like the Eisenhower administration.

Perhaps even better than the news in the equity markets is the impact that the Citigroup rescue has had in the pricing of credit default swaps (CDS) of financial institutions. Yesterday, for instance, the cost of credit default insurance at Citigroup was essentially cut in half, which is not surprising, given the nature of the agreement. The domino effect at other troubled financial institutions was notable, with CDS prices improving as follows:

  • Goldman Sachs (GS): 68 basis points (18%)
  • Berkshire Hathaway (BRK-A): 86 basis points (19%)
  • Morgan Stanley (MS): 74 basis points (14%)
  • Hartford Insurance Group (HIG): 214 basis points (10%)

For those not versed in the details of credit default swap pricing, each basis point translates into $1000 per year for 5 years to insure $10 million worth of debt, so a 5 year $10 million CDS for Goldman Sachs became $68,000 cheaper in the wake of the Citigroup deal.

The market likes the deal. I think the approach makes sense. Better yet, the Citigroup rescue may provide a workable template for how to best deal with troubled financial institutions in a manner than the government, firm, and market all find acceptable.

Thursday, September 25, 2008

Recent Volatility in Corporate Bonds

There is a good reason why you rarely hear about high volatility and bonds in the same sentence. It is the same reason why people don’t debate whether the grass is growing faster on Thursday than it was on Wednesday or whether the paint is taking longer to dry than usual. For the most part, bond volatility is nano-volatility.

Until last week, that is.

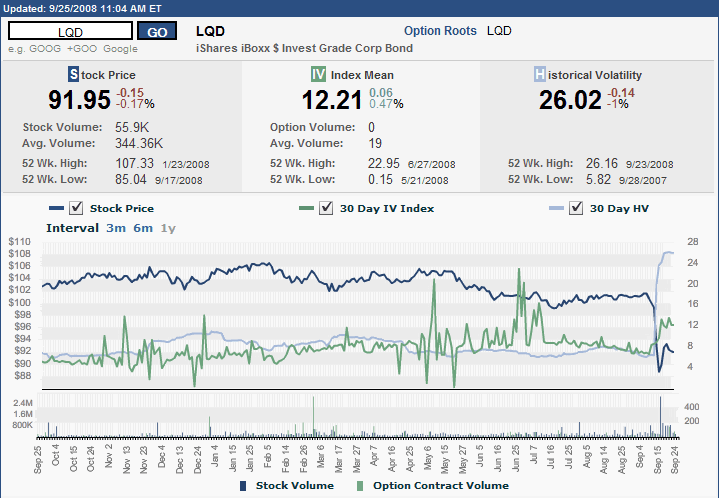
The graphic below (courtesy of the ISE) shows one year of pricing, implied volatility, and historical volatility for the iShares iBoxx $ Investment Grade Corporate Bond ETF (LQD). Looking solely at implied volatility, one would be tempted to conclude that March was relatively uneventful and the real difficulties in the bond market were from early May through early July. The price of the ETF and the historical volatility, however, tell another story. Rarely will you find a chart where historical volatility spiked to such dramatic levels without first seeing a rise in implied volatility that hints at what is coming.

A large part of the reason for the dramatic spike is that in addition to the general freezing of the credit markets, as recently a few months ago half of LQD’s holdings were in the financial sector. One only has to check the list of current holdings to see that LQD continues to own bonds issued by Lehman Brothers and AIG, as well as Wachovia (WB), Goldman Sachs (GS), Morgan Stanley (MS), and other names that have recently come under extreme pressure.

Depending upon your intermediate to long-term view of the U.S. economy, LQD could be an interesting buy and hold investment, if one is interested taking an approach not too different than what is being proposed by Paulson, et al. As always, caveat emptor.

Monday, March 24, 2008

Recent Investment Bank Performance

Last Tuesday, Goldman Sachs (GS) and Lehman Brothers (LEH) announced better than expected earnings that helped to bolster confidence in the investment banking sector. Later that same day, the Fed cut the target Fed funds rate to 2.25% and opened up a Primary Dealer Credit Facility to provide additional liquidity for investment banks. With these moves, the odds have increased that the recent risk to the financial system has already peaked – though it will undoubted take a considerable period before this is fully reflected in improved balance sheets and investor confidence.

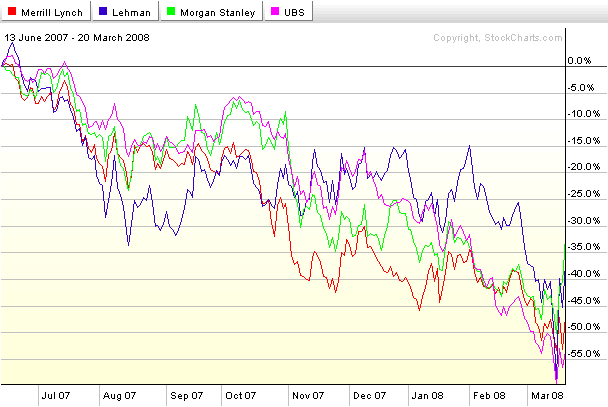
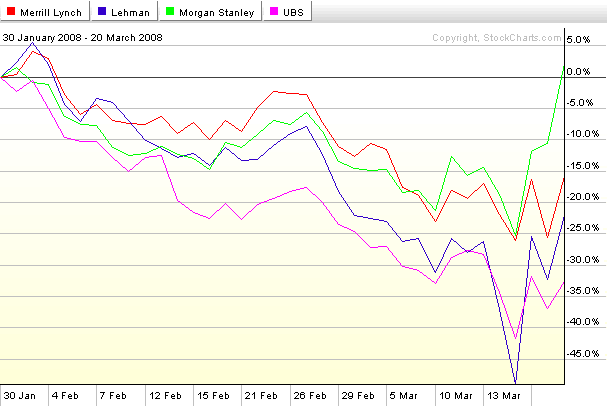
The charts below show the performance of the stocks of four of the severely beleaguered investment banks (MER, LEH, MS, UBS) during the past 195 days from the June 2007 highs, as well as during the most recent 36 days, when the pressure on these institutions was greatest. One inescapable conclusion is that UBS has been the least resilient among the group so far – a development that bears watching going forward.


Thursday, January 24, 2008

MBI, Bond Insurers, and Volatility

One of the more interesting – and important – subplots to keep an eye on during the current market difficulties is that of the bond insurers. The two most prominent of these bond insurers, MBIA (MBI) and Ambac (ABK), are in the news today with reports that the New York Insurance Superintendent is trying to arrange a capital infusion from the likes of Goldman Sachs (GS), Merrill Lynch (MER), JPMorgan (JPM), Citigroup (C), and Wachovia (WB). Presumably, the Fed is doing some arm twisting and offering some financial incentives behind the scenes, as a failure to resolve the problems with the bond insurers would likely trigger systemic havoc and involve a long and expensive list of dominoes in the process.

Eric Dinallo, the New York Insurance Superintendent, was quoted earlier today as saying that while a rapid resolution is essential, ironing out the details of a bailout may take awhile. “It is important to resolve issues related to the bond insurers as soon as possible,” Dinallo noted, while cautioning “these are complicated issues involving a number of parties and any effective plan will take some time to finalize.”

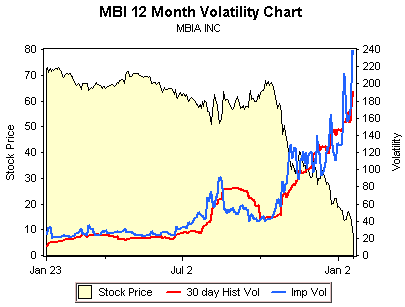
While most investors should be thinking about the bond insurer issue in terms of its impact on the broader markets, there are some interesting plays on bond issuers themselves. As reported in 24/7 Wall Street, Goldman Sachs laid out some potential valuations under three different scenarios, ranging from the bond insurers’ being unable to raise enough capital to mollify the rating agencies to a situation where the capital raised enables the bond insurers to continue to operate as they had in a pre-crisis mode. Looking just at MBI, the valuation spread ranges from $6 to $48.

Investments don’t get much more speculative than this, as the chart from optionsXpress above shows. For the record, all February puts now carry an implied volatility of more than 200. While I am not going to recommend a specific trade here, there are some fascinating options spreads and ratio spreads to look at for those who believe that the Goldman scenarios and numbers are in the ballpark.

Thursday, December 13, 2007

Implied Volatility as a Sector Drill Down Diagnostic

I have said relatively little about the crisis in the financial sector largely because there are so many others out there who are covering this story in much more detail than I have any desire to get into. Also, my trading is driven largely by technical analysis, charts and market sentiment, with fundamental analysis usually playing a prominent role only in my long-term holdings.

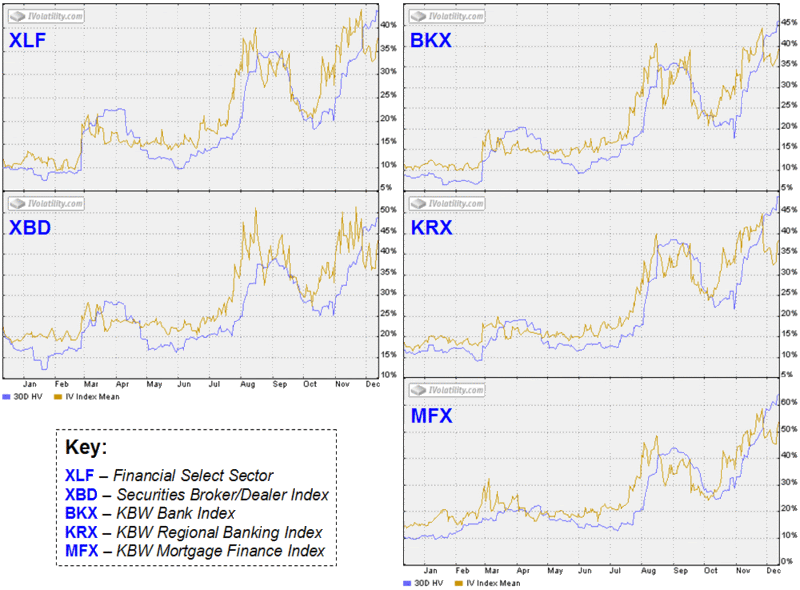
That being said, this blog has an emphasis on volatility and risk, so this morning I pulled up some implied volatility charts in the financial sector and drilled down from general to specific to see to what extent implied volatility might indicate vis-à-vis the possibility of the tide turning in investor fear. I have appended several of these charts below. On the left hand side, they include the generic large cap financial sector index, XLF (components), as well as the securities broker dealer index, XBD, whose volatility I analyzed back in August. On the right side, I have the banks. The BKX (components) is capitization-weighted and thus tilts toward money center banks; the KRX (components) has a strong regional and local focus; and the MFX (components), as the name suggests, includes banks and other financial companies that are heavily involved in the mortgage finance business. For comparison purposes, the BKX is down 18.7% on the year, the KRX is down 20.5% and the MFX is off 44.6%.

From an IV perspective (and yes, many of these companies could use some intravenous fluids) I generally glance at XLF only as a generic overview of the financial sector. The first finding of interest is that implied volatility in the XBD peaked in August and made a double top before Thanksgiving. This is consistent with the widespread belief that Goldman Sachs (GS) has dodged the subprime bullet and other players in this sector have had sufficient time and corporate agility – if not perhaps the ideal risk management policies – to limit any additional damage.

The banks are another story. Implied volatility in the money center banks and regional banks topped out at the end of November and is currently just below the August highs. Still more concerning, if not more surprising, is the performance of the mortgage finance sector, where implied volatility is above the August peak and in the process of challenging the late November high water mark. If I were a meteorologist looking at implied volatility, I would conclude that the storm has passed in the broker-dealer sector, but more thunderclouds are approaching in the regional banking and mortgage finance sectors.

Sunday, October 14, 2007

VWSI Back to Zero. Was That the Bump?

In a week where Goldman Sachs hit a new all-time high while BIDU had a range of 58 points in one session, you could make the case that volatility is winding down or just warming up for the next act. Despite Thursday’s 13.3% jump in the VIX, the volatility index ended the week up only 4.8% or 0.92 points to 17.73. Still, this small bump was enough to send the VWSI back to neutral, following an unprecedented run of three consecutive high readings in the indicator.

The coming week is bound to provide considerable ammunition for both bulls and bears, as there are many important earnings reports in the technology and finance sectors. Barry Ritholtz at The Big Picture breaks things down in another excellent “Week in Preview” with details on earnings and upcoming government data, as well as the usual high quality set of links to some of the top commentary and analysis in the investment world. Even if you don’t click all the way through, be sure to check out Barry’s summaries.

For what little it is worth, I am more bearish than the VWSI, but the bears are going to have to do a lot better than a one day pullback to make me a believer. Perhaps earnings and options expiration will help to sort out the believers and the non-believers.

(Note that in the above temperature gauge, the "bullish" and "bearish" labels apply to the VIX, not to the broader markets, which are usually negatively correlated with the VIX.)

Wine pairing: For a VWSI of zero, I recommend an inexpensive Rhone blend. Inexpensive is a relative term, but with yesterday I finally got around to tasting a $13 wine that from D’Arenberg that managed to secure a 90 rating from Robert Parker: The Hermit Crab. The 2005 version is 70% viognier and 30% marsanne. To my palate, the marsanne sets the tone here, keeping the viognier component in check and delivering a subtle complexity that astonished me. Frankly, I can’t think of any white blend in this price range that I have enjoyed more in recent years. Seek this one out.

For other inexpensive Rhone blends, I continue to also recommend: Oakley Five Reds; Robert Hall’s Rhone de Robles and Tablas Creek’s Cote de Tablas Blanc; Wrongo Dongo, the contrarian favorite from Spain; and The Stump Jump (I prefer the white over the red) from Australia. If you are looking for additional ideas, I encourage you check out the Rhone Rangers.

Tuesday, October 9, 2007

Goldman Sachs (GS) Hits New All-Time High

In case anyone was wondering, this means the looming financial crisis has officially been canceled.

As much as various sentiment indicators suggest that there is too much froth in the markets, that doesn't mean it is a good time to be short. Said another way, never try to anticipate when a fast moving locomotive will make a U-turn, but be nimble enough to grab onto the caboose as it goes by, regardless of the direction...

Friday, August 17, 2007

How Healthy Is the Rally?

I don't have much to add to what has already been said about today's rally.

For what it's worth I am watching three indicators in particular to gauge the health and longer term potential of this rally:
XBD -- broker/dealer index (to a lesser extent XBD:SPX, GS, BSC, BKX, CFC, etc.)
RUT -- Reuters 2000 Small Cap Index (also RUT:SPX)
EEM -- iShares MSCI Emerging Markets (also EEM:EFA)

Right now, all three indicators are outperforming the broad market indices, so I feel as if the rally is on good footing. My biggest concern coming into the day was that would be traders worried about Monday's headline risk, but the longer the indicators noted above continue to do well, the less pressure there will be on the system.

For a little while earlier in the day the markets and the VIX were both up, as fear lingered in the face of a weekend of uncertainty, but for now, the fear component of the VIX seems to be slowly dissipating.

Before I finalize my positions going into the weekend, I will take one last look at Hurricane Dean.

DISCLAIMER: "VIX®" is a trademark of Chicago Board Options Exchange, Incorporated. Chicago Board Options Exchange, Incorporated is not affiliated with this website or this website's owner's or operators. CBOE assumes no responsibility for the accuracy or completeness or any other aspect of any content posted on this website by its operator or any third party. All content on this site is provided for informational and entertainment purposes only and is not intended as advice to buy or sell any securities. Stocks are difficult to trade; options are even harder. When it comes to VIX derivatives, don't fall into the trap of thinking that just because you can ride a horse, you can ride an alligator. Please do your own homework and accept full responsibility for any investment decisions you make. No content on this site can be used for commercial purposes without the prior written permission of the author. Copyright © 2007-2023 Bill Luby. All rights reserved.
 
Web Analytics