Showing posts with label AIG. Show all posts

Sunday, September 13, 2009

Implied Volatility for the DJIA Components: Now vs. 52 Week Highs

As the one year anniversary of the Lehman Brothers bankruptcy rolls around, I can imagine there will be very few celebratory parties.

I certainly have no desire to celebrate what turned out to be my second experience jumping out of an airplane, but I do want to make sure that some of the volatility data from that period are captured here for posterity. At some point in the future, some of us will want to look back and see just how crazy things got in during the historic volatility of October and November.

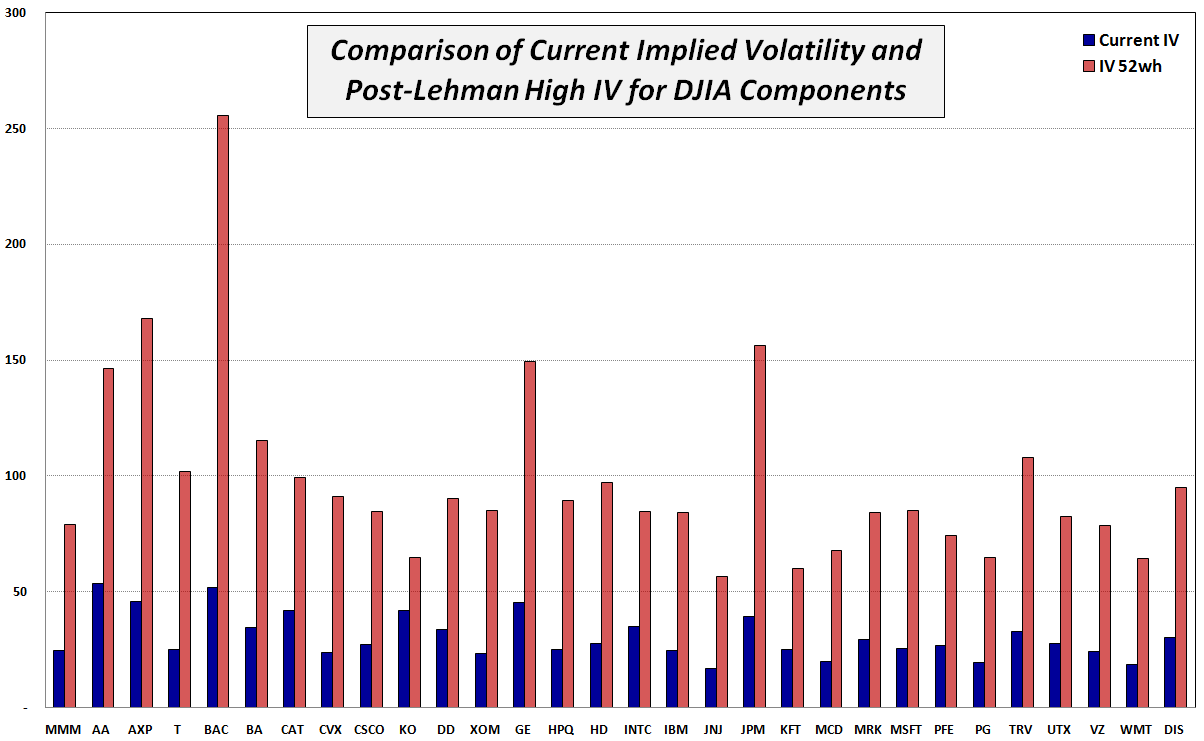
With this idea in mind, I have chosen to make this week’s chart of the week a reflection on the current implied volatility vs. the 52 week high IV of the 30 companies which comprise the Dow Jones Industrial Average. Of course the DJIA consists of some of the most financially sound companies in the world, so this exercise should highlight companies experienced a less severe impact due to the financial crisis than some of their more speculative peers. In fact, the numbers show that peak implied volatility for these blue chips was, on average, about 3.2 times higher than it is now. Even now, some of these numbers boggle the mind and make a VIX of 89.53 look almost pedestrian in comparison.

Note that Citigroup (C) and AIG were part of the DJIA when Lehman Brothers went bankrupt and subsequently had their membership from that select club revoked. For comparison purposes, consider that Citigroup’s implied volatility peaked at over 328 and currently sits at 66. AIG, on the other hand, saw its implied volatility spike all the way up to 540. It has since fallen to a more benign, but considerably elevated 135. Progress? Perhaps…
[source: International Stock Exchange]

Tuesday, September 1, 2009

JunkDEX Falls 11% in First Two Hours of Trading

I was not expecting to talk about the JunkDEX for the third day in a row, but since I have received several requests, I will run with this theme for another day.

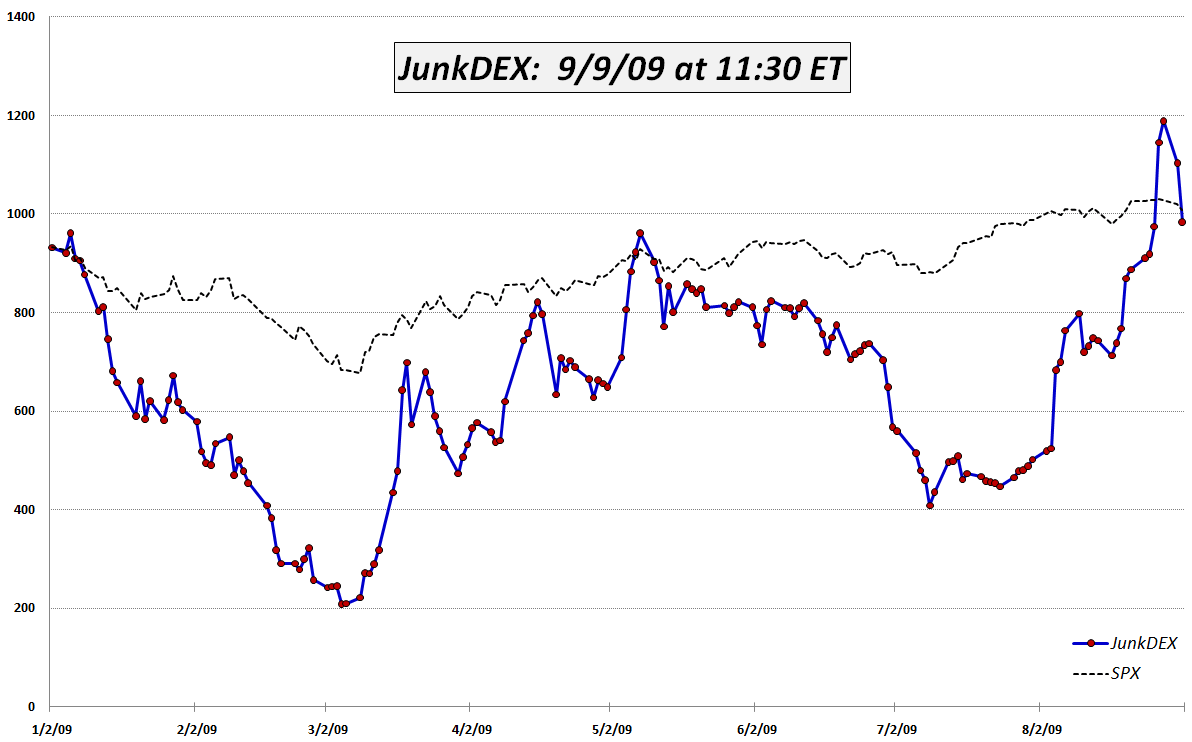
Today the JunkDEX is showing an acceleration of yesterday’s 7.2% move downward. As of 11:30 ET, the JunkDEX is down a little more than 11%, with American International Group (AIG), Fannie Mae (FNM) and CIT Group (CIT) all down about 15% each.

Based on the large trading volumes, Sunday’s call of an impending blow-off top is looking as if it may be coming to fruition.

For some related posts on junk financials and the JunkDEX, try:


[Disclosure: short AIG at time of writing]

Monday, August 31, 2009

JunkDEX Component Performance

I am delighted to see that JunkDEX Tracks Speculative Frenzy in Financials and the JunkDEX itself appear to have hit a nerve and have generated such positive feedback.

To some extent, one could argue that the selection of the individual components of the JunkDEX was done in a somewhat arbitrary fashion and consequently, the performance of the index is somewhat biased by the hand-picked issues that tell a particular story.

I already mentioned the exclusion of Freddie Mac (FRE), largely because the company’s business, financial history and stock performance is so similar to that of Fannie Mae (FNM). I also looked at Lehman Brothers (LEHMQ), which gave us the LEHVIX, among other memories. LEHMQ was up 200% on Friday and is up another 50% so far today. I even toyed with the idea of General Motors (MTLQQ), but as both of these issues trade on the pink sheets, I did not want to venture into that netherworld.

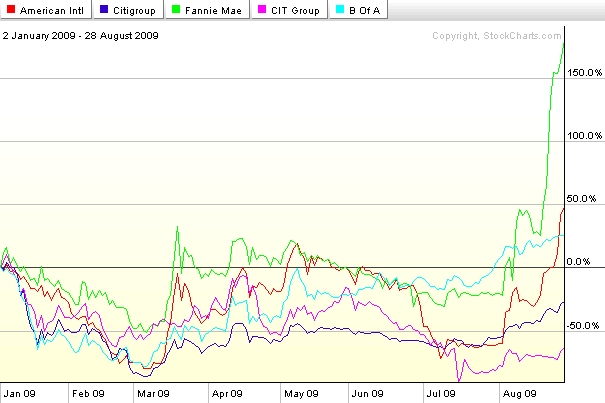
For some historical context, I thought it would be helpful to provide some individual component performance charts for the JunkDEX. The first chart covers the full span of the JunkDEX, dating back to the beginning of 2009. It shows particularly strong performance on the part of Fannie Mae and American International Group (AIG):

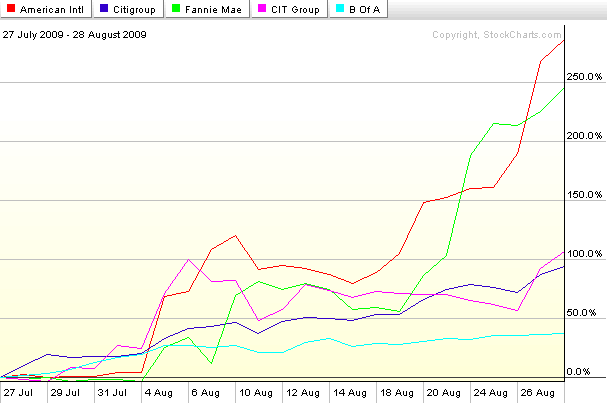
The second chart reflects performance in each of the five components over the course of the last five weeks. Given the relatively short time frame for this data, I find the percentage changes to be even more interesting. While FNM and AIG are still the top performers, both Citigroup (C) and CIT Group (CIT) have doubled during this period. Bank of America (BAC), which is weighted down by a market cap of $153 billion, is considerably less nimble, yet still has a gain of 37% in the past five weeks:

In today’s trading, AIG is down 11.5%, FNM is down 5.4% and only CIT is showing a gain.

[graphics: StockCharts.com]

[Disclosure: short AIG at time of writing]

Sunday, August 30, 2009

Chart of the Week: JunkDEX Tracks Speculative Frenzy in Junk Financials

Back in September 2007, when I thought the markets were a little too frothy, I created a list of Overripe High Fliers. A few weeks later, in From Overripe to Vulnerable? I took the current list of 14 overripe high flier stocks that had been drawing a great deal of speculative attention into something I called the OHFDEX – an index based on those overripe high fliers.

Not only was the timing of the OHFDEX impeccable, but the post became so popular that it spawned a number of follow-up posts, including, OHFDEX One Year Later.

In the spirit of the original OHFDEX, I have been watching closely the recent speculative frenzy in some stocks that have come to be known as “junk financials.” These are financial firms that were the recipients of government bailout funds during the financial crisis and now sell at valuations substantially below 2007 levels. They include American International Group (AIG), Fannie Mae (FNM), Freddie Mac (FRE), Citigroup (C), CIT Group (CIT) and Bank of America (BAC). In the last few weeks, these stocks have routinely accounted for 30% or more of the total volume on the NYSE and on Friday alone the group of six traded 2.53 billion shares.

While I find the transition from risk-averse behavior to risk-tolerant behavior on the part of investors to be an important step in the healing process, the recent headlong rush into risk-seeking behavior has me more than a little concerned. How healthy can the markets be when speculation in six companies that were all but bankrupt a few months ago now accounts for one out of every three shares traded each day?

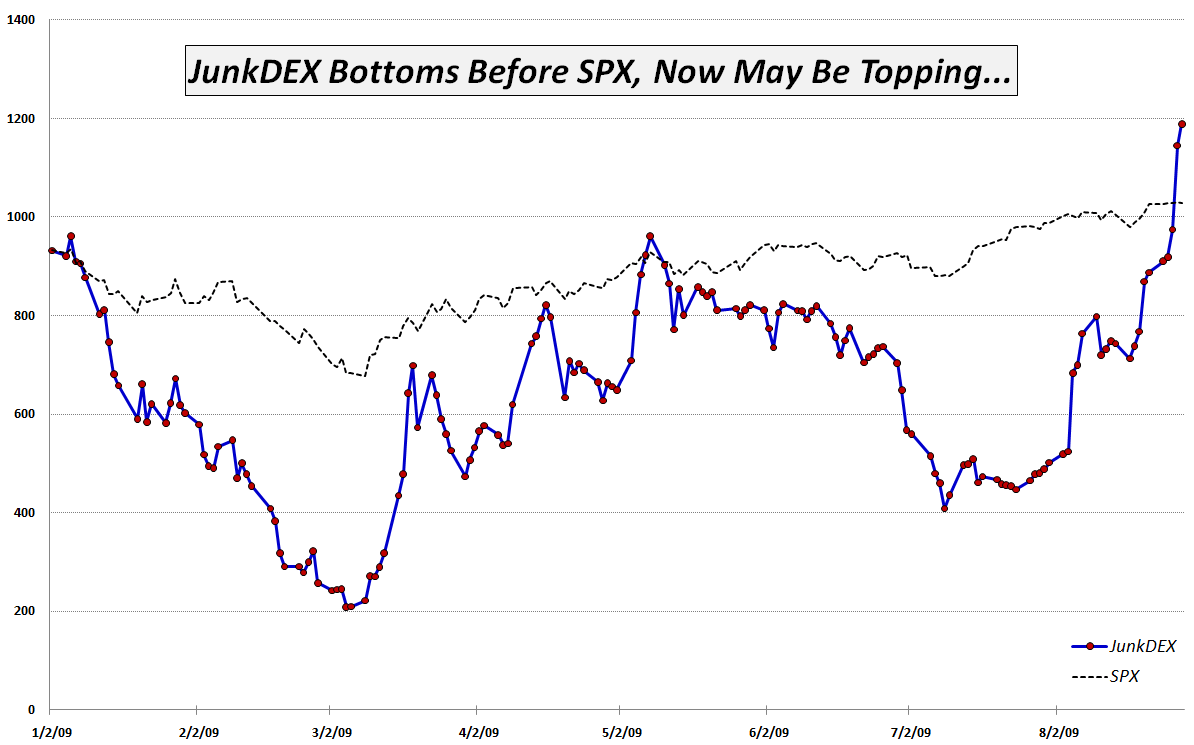
In order to track the speculative interest in junk financials, I have created what I am calling the JunkDEX, which consists of equally weighted positions (as of 1/2/09) in AIG, FNM, C, CIT and BAC (I elected to omit FRE due to the strong similarities with FNM.) I scaled the JunkDEX so that it had the same value as the SPX at the beginning of the year. As this week's chart of the week below shows, the JunkDEX led the S&P 500 index down from January through March, bottomed two days earlier and rallied impressively through the middle of May. From May through early August, the JunkDEX lagged the SPX significantly, before spiking dramatically during the past 3 ½ weeks.

The JunkDEX looks as if it may be approaching a blow-off top. If this turns out to be the case, I expect it will signal an imminent top in the broader markets, just as the OHFDEX did.

Going forward, I will keep an eye on speculative activity in the junk financials and in the JunkDEX for clues about the sustainability of the recent bull leg. I will update the performance of the JunkDEX, as appropriate and suggest that traders treat these stocks with extra caution, whether long or short.

[graphic: VIXandMore]

[Disclosure: short AIG at time of writing]

Tuesday, January 20, 2009

U.S. Banking Index More Bearish than November

With pressure on banks increasing across the globe and hitting European banks (RBS, AIB, BCS and DB) particularly hard, the U.S. banking sector now finds itself falling faster than it did even at the November lows. State Street Corp. (STT) has been considered one of the safest U.S. banks, yet announced today that profits in the most recent quarter fell 71%, largely as a result of a $6.3 billion loss in its investment portfolio during the quarter.

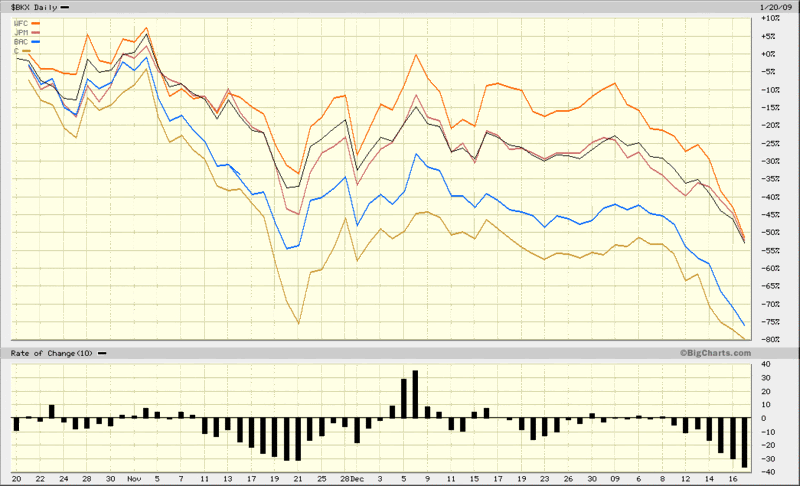
The chart below shows that the selloff in the banking index (BKX) is sharper now than it was at any time during the November bank panic. While the banking index and most of the large banks are making new lows, the S&P 500 index has managed to draw strength from other sectors to remain above the November lows and even above last week’s low.

The rest of the week should determine whether we have a higher low in the broader indices (my guess) or break below SPX 800 to challenge the November lows.

[source: BigCharts]

Sunday, January 4, 2009

The Year in Global Volatility (2008)

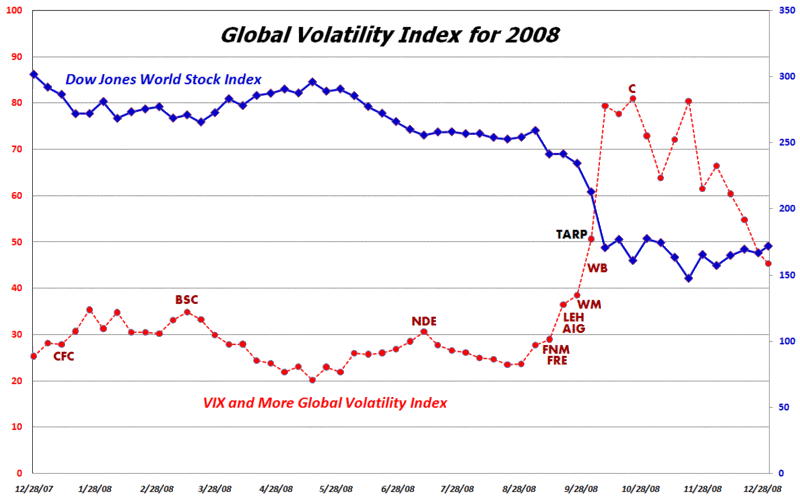
In November I launched the VIX and More Global Volatility Index, which is a weighted average of the implied volatility in options for equities in the 15 largest global economies. I will have more to say about the Global Volatility Index in 2009, but want to use this occasion to highlight the index as a means of tracking the rise of volatility in response to major volatility events during the course of the past year. In addition to the Global Volatility Index (shown in red), the chart below captures the Dow Jones World Stock Index (blue), as well as the signing of the TARP legislation (black) and the tickers (dark red) for some of the major financial companies that failed and/or were rescued by the U.S. government.

[source: VIX and More]

Friday, November 21, 2008

International Securities Exchange Revamps Implied Volatility Charts

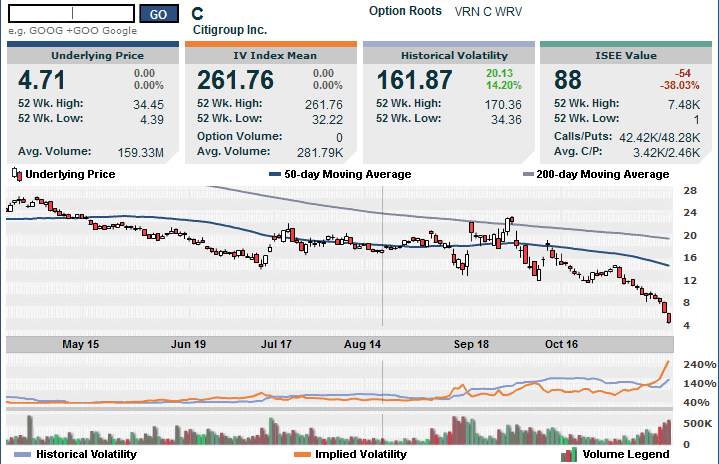
The International Securities Exchange (ISE), which publishes a superb implied volatility chart that I have featured on VIX and More on a number of occasions, has recently launched an enhanced version of their IV chart. The new version of this chart, which I have appended below, adds an “ISEE value” to the list of data. I have discussed the ISEE call to put ratio frequently in this space in the past. In this incarnation it is simply a ratio of call volume to put volume for the specified security.

I chose Citigroup (C) as my example security because all eyes should be on this bank, which is now trading at a 14 year low after hitting 3.57 earlier this morning. If Citigroup crumbles, it will dwarf the chaos created by AIG and Lehman Brothers.

Finally, for more information on the company that is the source of the volatility charts used by the ISE, check out Livevol.

[source: International Securities Exchange]

Thursday, September 25, 2008

Recent Volatility in Corporate Bonds

There is a good reason why you rarely hear about high volatility and bonds in the same sentence. It is the same reason why people don’t debate whether the grass is growing faster on Thursday than it was on Wednesday or whether the paint is taking longer to dry than usual. For the most part, bond volatility is nano-volatility.

Until last week, that is.

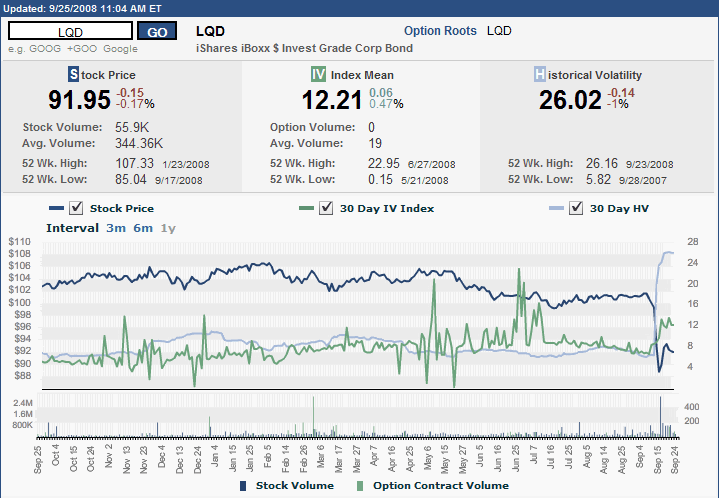
The graphic below (courtesy of the ISE) shows one year of pricing, implied volatility, and historical volatility for the iShares iBoxx $ Investment Grade Corporate Bond ETF (LQD). Looking solely at implied volatility, one would be tempted to conclude that March was relatively uneventful and the real difficulties in the bond market were from early May through early July. The price of the ETF and the historical volatility, however, tell another story. Rarely will you find a chart where historical volatility spiked to such dramatic levels without first seeing a rise in implied volatility that hints at what is coming.

A large part of the reason for the dramatic spike is that in addition to the general freezing of the credit markets, as recently a few months ago half of LQD’s holdings were in the financial sector. One only has to check the list of current holdings to see that LQD continues to own bonds issued by Lehman Brothers and AIG, as well as Wachovia (WB), Goldman Sachs (GS), Morgan Stanley (MS), and other names that have recently come under extreme pressure.

Depending upon your intermediate to long-term view of the U.S. economy, LQD could be an interesting buy and hold investment, if one is interested taking an approach not too different than what is being proposed by Paulson, et al. As always, caveat emptor.

DISCLAIMER: "VIX®" is a trademark of Chicago Board Options Exchange, Incorporated. Chicago Board Options Exchange, Incorporated is not affiliated with this website or this website's owner's or operators. CBOE assumes no responsibility for the accuracy or completeness or any other aspect of any content posted on this website by its operator or any third party. All content on this site is provided for informational and entertainment purposes only and is not intended as advice to buy or sell any securities. Stocks are difficult to trade; options are even harder. When it comes to VIX derivatives, don't fall into the trap of thinking that just because you can ride a horse, you can ride an alligator. Please do your own homework and accept full responsibility for any investment decisions you make. No content on this site can be used for commercial purposes without the prior written permission of the author. Copyright © 2007-2023 Bill Luby. All rights reserved.
 
Web Analytics