The Year in Global Volatility (2008)
In November I launched the VIX and More Global Volatility Index, which is a weighted average of the implied volatility in options for equities in the 15 largest global economies. I will have more to say about the Global Volatility Index in 2009, but want to use this occasion to highlight the index as a means of tracking the rise of volatility in response to major volatility events during the course of the past year. In addition to the Global Volatility Index (shown in red), the chart below captures the Dow Jones World Stock Index (blue), as well as the signing of the TARP legislation (black) and the tickers (dark red) for some of the major financial companies that failed and/or were rescued by the U.S. government.
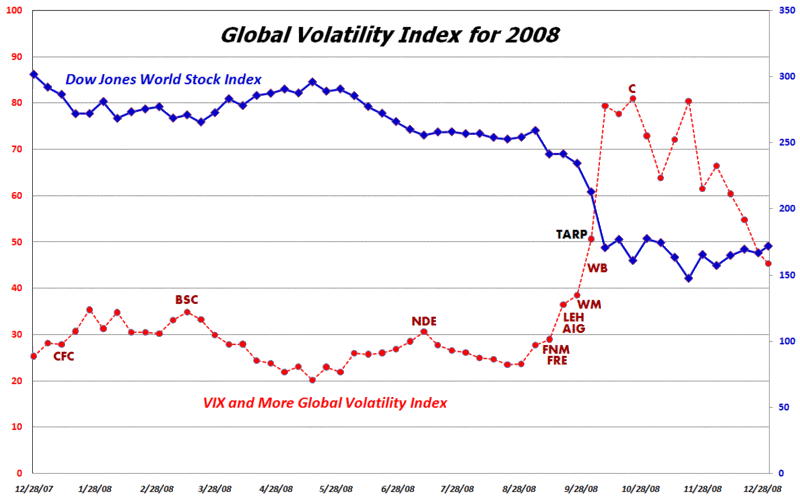
[source: VIX and More]

 I don't talk much about my trading and investing background, but suffice it to say that I have been an active investor for 25 years, have traded all sorts of options for 10 years, have accounts with about a dozen financial institutions, some of which carry what I consider to be significant balances, etc. On top of that, the options commissions alone that I generate are quite substantial.