Showing posts with label C. Show all posts

Monday, October 12, 2009

Implied Volatility Flat Ahead of Bank Earnings

With some very important earnings in the financial sector coming up this week (JPM on Wednesday; C and GS on Thursday; BAC and GE on Friday), I have been watching implied volatility (IV) in the sector very closely. Much to my surprise, implied volatility has not increased ahead of earnings, as is typically the case.

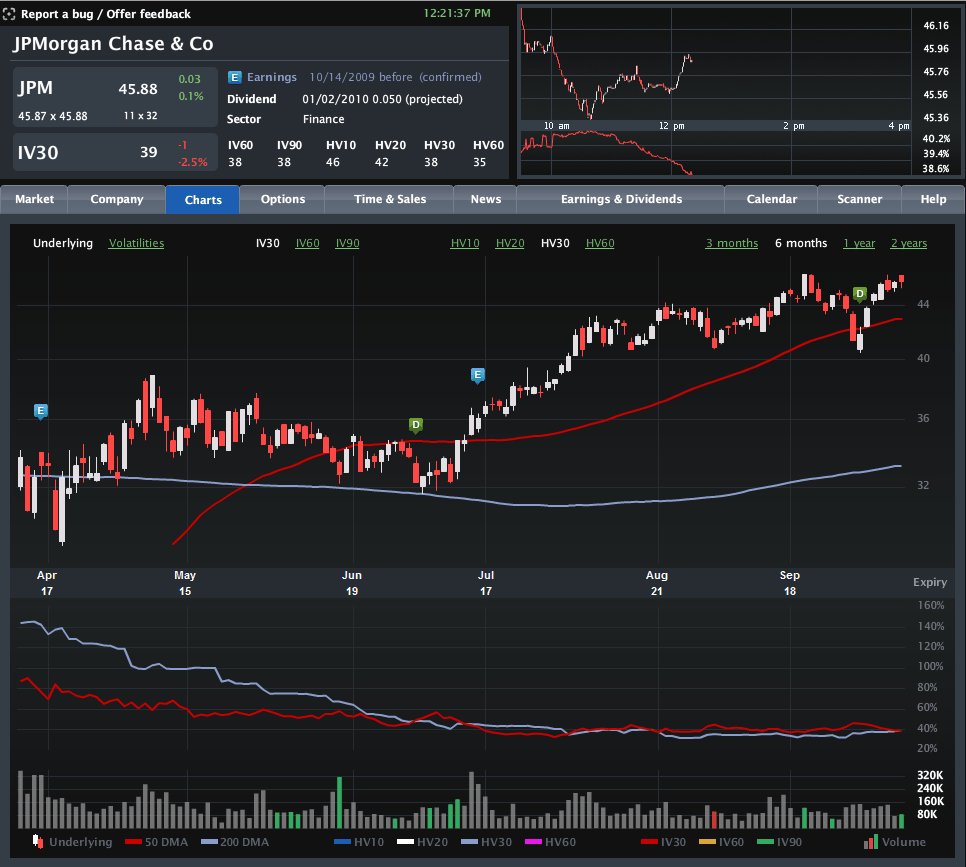
The chart below, courtesy of Livevol, shows six months of price and volatility activity in JPMorgan Chase (JPM), with the upper portion chart highlighting the last two earnings releases with the blue “E” icon. The bottom half of the chart plots 30-day implied volatility (red line) against 30-day historical volatility (light blue line) during the same period.

Note that just prior to the last two earnings reports, implied volatility rose due to the uncertainty and potential for higher volatility associated with an earnings surprise. This time around, however, the lack of movement in implied volatility – as well as the proximity of the IV level to historical volatility – suggests that investors are not expecting any surprises at all. In fact, this situation is not specific to JPMorgan, but is also mirrored at Citigroup, Bank of America, Goldman Sachs and even quasi-financial General Electric. Not surprisingly, the bank ETFs, such as KBE, and the financial sector ETF, XLF, show a similar pattern.

No matter how the current earnings season unfolds, it is difficult to imagine that there will not be any surprises. Investors who think implied volatility is underestimating the surprise potential for the banks may look to initiate long straddles or long strangles to take advantage of a potential increase in implied volatility – and hence options prices.

For some related posts on implied volatility in financials, readers are encouraged to check out:

[source: Livevol Pro]
Sunday, September 13, 2009

Implied Volatility for the DJIA Components: Now vs. 52 Week Highs

As the one year anniversary of the Lehman Brothers bankruptcy rolls around, I can imagine there will be very few celebratory parties.

I certainly have no desire to celebrate what turned out to be my second experience jumping out of an airplane, but I do want to make sure that some of the volatility data from that period are captured here for posterity. At some point in the future, some of us will want to look back and see just how crazy things got in during the historic volatility of October and November.

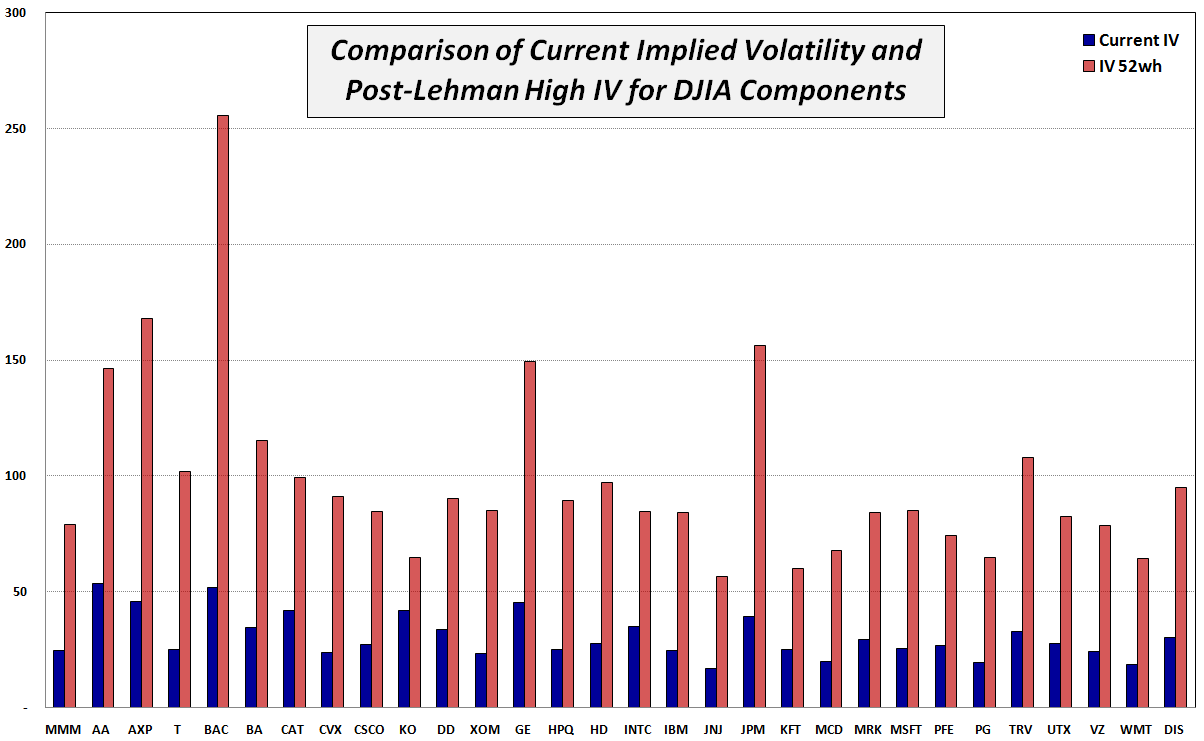
With this idea in mind, I have chosen to make this week’s chart of the week a reflection on the current implied volatility vs. the 52 week high IV of the 30 companies which comprise the Dow Jones Industrial Average. Of course the DJIA consists of some of the most financially sound companies in the world, so this exercise should highlight companies experienced a less severe impact due to the financial crisis than some of their more speculative peers. In fact, the numbers show that peak implied volatility for these blue chips was, on average, about 3.2 times higher than it is now. Even now, some of these numbers boggle the mind and make a VIX of 89.53 look almost pedestrian in comparison.

Note that Citigroup (C) and AIG were part of the DJIA when Lehman Brothers went bankrupt and subsequently had their membership from that select club revoked. For comparison purposes, consider that Citigroup’s implied volatility peaked at over 328 and currently sits at 66. AIG, on the other hand, saw its implied volatility spike all the way up to 540. It has since fallen to a more benign, but considerably elevated 135. Progress? Perhaps…

[source: International Stock Exchange]

Sunday, August 30, 2009

Chart of the Week: JunkDEX Tracks Speculative Frenzy in Junk Financials

Back in September 2007, when I thought the markets were a little too frothy, I created a list of Overripe High Fliers. A few weeks later, in From Overripe to Vulnerable? I took the current list of 14 overripe high flier stocks that had been drawing a great deal of speculative attention into something I called the OHFDEX – an index based on those overripe high fliers.

Not only was the timing of the OHFDEX impeccable, but the post became so popular that it spawned a number of follow-up posts, including, OHFDEX One Year Later.

In the spirit of the original OHFDEX, I have been watching closely the recent speculative frenzy in some stocks that have come to be known as “junk financials.” These are financial firms that were the recipients of government bailout funds during the financial crisis and now sell at valuations substantially below 2007 levels. They include American International Group (AIG), Fannie Mae (FNM), Freddie Mac (FRE), Citigroup (C), CIT Group (CIT) and Bank of America (BAC). In the last few weeks, these stocks have routinely accounted for 30% or more of the total volume on the NYSE and on Friday alone the group of six traded 2.53 billion shares.

While I find the transition from risk-averse behavior to risk-tolerant behavior on the part of investors to be an important step in the healing process, the recent headlong rush into risk-seeking behavior has me more than a little concerned. How healthy can the markets be when speculation in six companies that were all but bankrupt a few months ago now accounts for one out of every three shares traded each day?

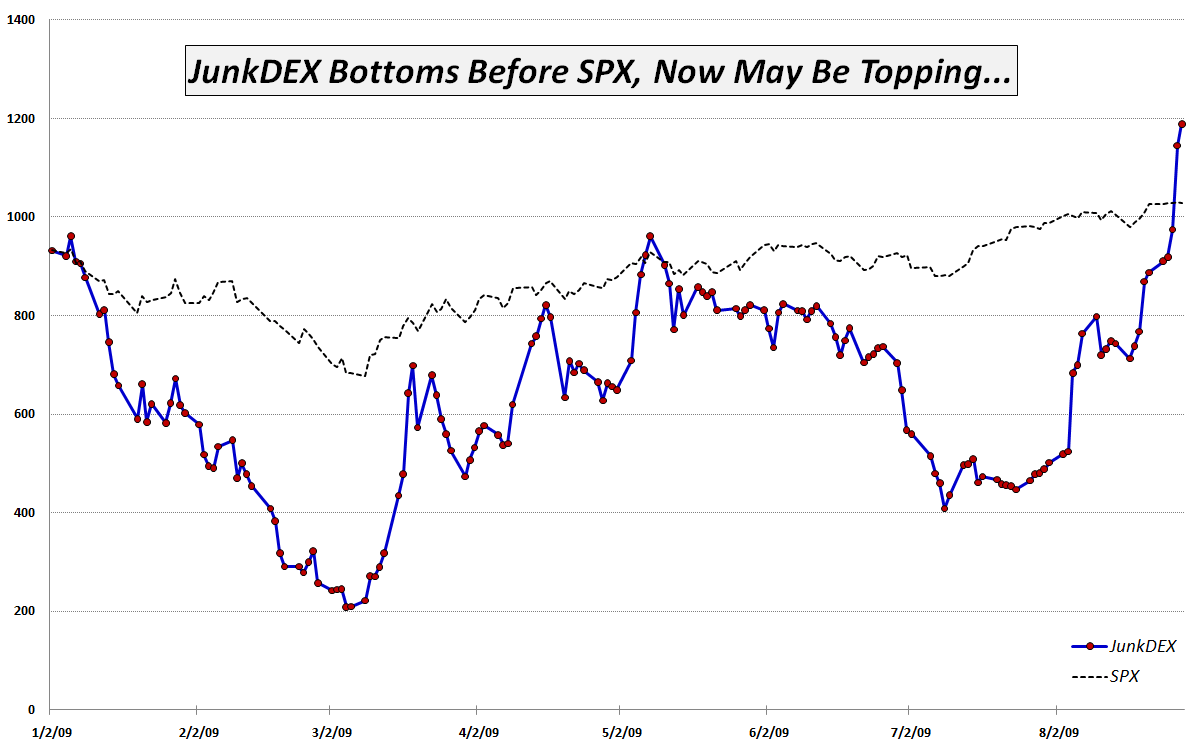
In order to track the speculative interest in junk financials, I have created what I am calling the JunkDEX, which consists of equally weighted positions (as of 1/2/09) in AIG, FNM, C, CIT and BAC (I elected to omit FRE due to the strong similarities with FNM.) I scaled the JunkDEX so that it had the same value as the SPX at the beginning of the year. As this week's chart of the week below shows, the JunkDEX led the S&P 500 index down from January through March, bottomed two days earlier and rallied impressively through the middle of May. From May through early August, the JunkDEX lagged the SPX significantly, before spiking dramatically during the past 3 ½ weeks.

The JunkDEX looks as if it may be approaching a blow-off top. If this turns out to be the case, I expect it will signal an imminent top in the broader markets, just as the OHFDEX did.

Going forward, I will keep an eye on speculative activity in the junk financials and in the JunkDEX for clues about the sustainability of the recent bull leg. I will update the performance of the JunkDEX, as appropriate and suggest that traders treat these stocks with extra caution, whether long or short.

[graphic: VIXandMore]

[Disclosure: short AIG at time of writing]

Tuesday, March 10, 2009

Citigroup, Zombies, Bottoms and a Sub-45 VIX

Two hours into today’s session and a 4% rally in the SPX seems to be holding – at least for now.

One of the catalysts for the rally was a comment made by Citigroup (C) CEO Vikram Pandit in a letter to employees that confirmed the bank made an operating profit in the first two months of 2009 and is on a trajectory to record the best quarter since Q3 2007 – the last time the bank booked a quarterly profit.

So…all of a sudden we have Citigroup looking profitable (for a stretch – and only on an operating basis), the possibility that zombie banks might be able to earn their way back to the land of the living (see my January comments about John Hempton’s analysis of this situation) and a devil’s bottom, where last week’s SPX 666 mark now appears as if it may hold up for at least a little while.

The risk/reward profile of the market may now be turning around, especially when Nouriel Roubini comments, “My main scenario is that it’s highly likely [the SPX] goes to 600 or below...500 is less likely, but there is some possibility you get there.”

After 13 of 16 down days for the SPX, it was only a matter of time before even several pieces of good news randomly clustered together to produce a bullish bounds, but…will it last?

As for the VIX, which is now hovering at the 45 level, the one day bounce does alleviate some short-term fears. The big change in the VIX is not due to technical support levels in the SPX, however, but to the changing macroeconomic landscape, where there is a glimmer of hope on the horizon for the first time since what seems like just a little bit after the invention of the ATM. While VIX is sensitive to technical trends in the markets, ultimately it is a product of macroeconomic and fundamental uncertainty. As the list of possible future universes gets culled down to a manageable, believable and ultimately palatable number, a sub-45 VIX will once again become the norm.

Saturday, February 28, 2009

Chart of the Week: GDP Worse Than Expected

A lot happened in the markets this week: the government took a larger ownership stake in Citigroup (C); blue chip stalwarts JPMorgan Chase (JPM) and General Electric (GE) both slashed their dividends; durable goods and housing data failed to meet already lowered expectations; Q4 GDP was revised down to a 6.2% annualized drop; and the S&P 500 index fell to levels not seen since 1996.

In spite of all these body blows, the markets held up reasonably well, with the exception of the GDP data, which delivered a knockout blow Friday morning. The GDP numbers are notoriously backward-looking and the revisions to advance GDP data lend very little to the existing body of economic knowledge. That being said, Friday’s GDP numbers touched a statistical and psychological nerve for a market that was just not prepared to digest another assessment of how sharp the economic fall has been.

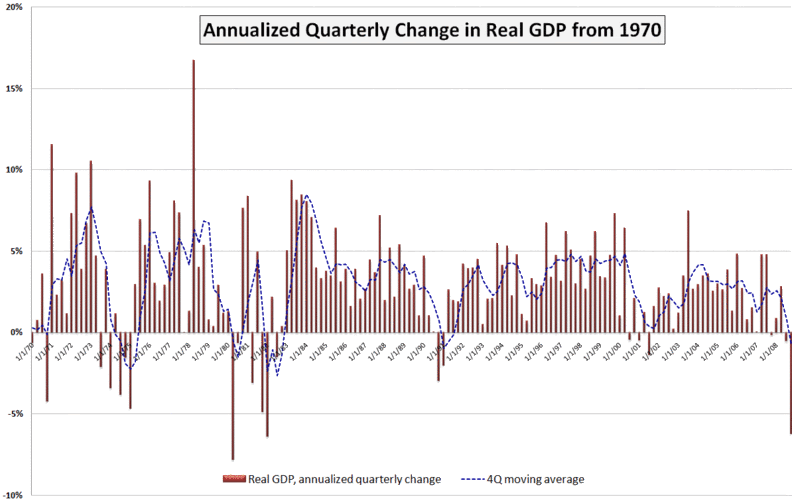
This week’s chart of the week attempts to put the most recent GDP number in historical perspective. While not shown on the chart, the raw GDP for the fourth quarter of 2008 is at approximately the level of economic activity that prevailed in June 2007. Also, while the 6.2% (annualized) drop in Q4 GDP is quite concerning, it is less than what we saw in the first quarter of 1982 (-6.4%) and the second quarter of 1980 (-7.8%). Going back even further (and not shown on the chart), GDP dropped a whopping 10.4% in the first quarter of 1958.

I have added a dashed blue line to show a four quarter moving average of GDP. By this measure, the current situation still has a way to go before it compares to 1991, not to mention the even larger four quarter dips in the 1970s and 1980s referenced above.

A survey of 43 economic forecasters published two weeks ago by the Federal Reserve Bank of Philadelphia showed expectations for a 5.2% drop in Q1 2009 GDP, followed by a 1.8% drop in Q2. Given the most recent revisions to the Q4 data, a 5.2% drop in the current quarter may be on the optimistic side, but the burning question right now is whether Q3 can show any growth at all – or at least a decrease in the rate of economic deterioration.

[source: Bureau of Economic Analysis, VIXandMore]

Saturday, February 21, 2009

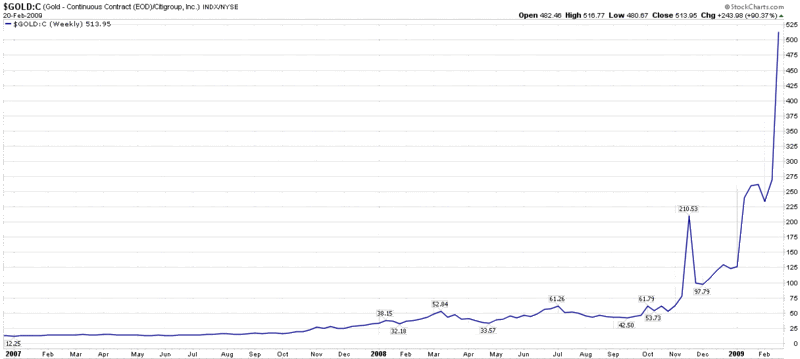
Chart of the Week: How Much Citigroup for My Gold?

In 2001, an investor who wanted to exchange his gold bullion for Citigroup (C) shares was able to acquire about six shares of stock for each ounce of gold. With Citigroup closing just under 2.00 yesterday and gold above the 1000.00 mark, that same swap now entitles the holder of gold to about 514 Citigroup shares.

The change in fortunes says much less about gold, which is almost 300% above the 2001 lows, than it does about Citigroup, which has fallen about 96% from an early 2007 high.

This week’s chart of the week chronicles the ratio of gold continuous contract futures to the price of Citigroup stock, essentially tracking the exchange rate for Citigroup in gold since the beginning of 2007. In many respects, this chart is also an excellent proxy for the magnitude of the problems facing the U.S. banking system.

[As an aside, now three months old, the full history of the VIX and More Chart of the Week series can be found by following the chart of the week link.]

[source: StockCharts]

Friday, February 20, 2009

Global Bank Stocks in a Post-Lehman World

I get tired of talking about the banks, but it is the story for the foreseeable future. While Citigroup’s (C) common stock flirts with the 2.00 line (can we call it Bank of Mendoza?) and insists it has not had conversations with the government about nationalization, Bank of America (BAC), whose stock is barely above the 3.00 level, is also out saying, “We see no reason to nationalize a bank that is profitable, well capitalized and actively lending.” Add to the financial stew a Wells Fargo (WFC) stock under 10.00 for the first time since 1996 and it is hard not to be obsessed by the banking sector.

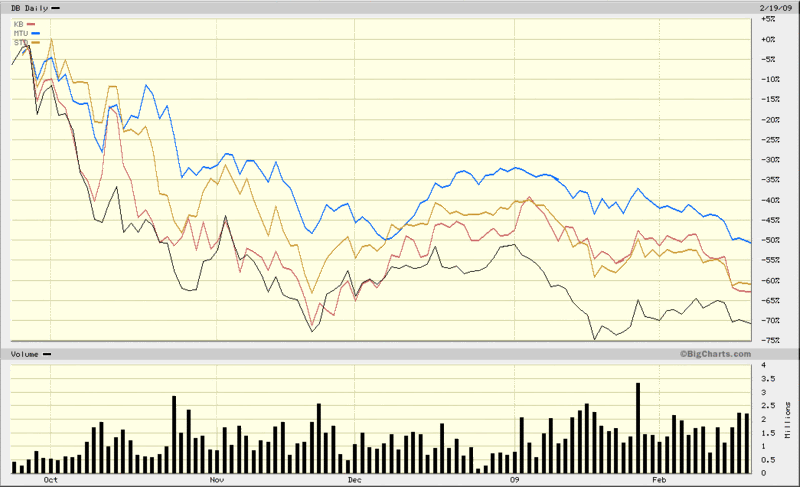
For all the discussion of U.S. banks, I wish to turn to the global scene. Lately U.K. banks and Irish banks have been the target of rumblings about possible nationalization, so I am going to skip over banks from these countries and instead focus on the largest banks in two critical European countries (Germany and Spain) and two critical Asian countries (Japan and South Korea). These four banks are Deutsche Bank (DB), Banco Santander (STD), Mitsibushi UFJ Financial (MTU) and Kookmin Bank (KB). All four banks happen to trade in the U.S. via American Depository Receipts (ADRs).

In the chart below, I have graphed the performance of all four giant banks since the last week in September, when the ripple effects of the Lehman bankruptcy and nationalization of AIG began to be felt across the globe. Not surprisingly, all four banks have seen their stock prices fall by more than 50%, with Deutsche Bank the worst performer among the group and Mitsibushi UFJ Financial feeling the least amount of pain. For comparison purposes, most of the Irish and British banks are down more than 90% during the same period.

The global banking crisis obviously has a long way to go before anyone can say with confidence that it is behind us. In the interim, even a medium-sized bank from a country most U.S. investors are not watching closely can lead to another tipping point that puts the global financial system closer to the brink. Investors seeking to keep a weather eye on global financial firms may also wish to monitor closely the iShares Global Financials ETF (IXG).

[source: BigCharts]

Wednesday, February 18, 2009

US Bancorp Reeling

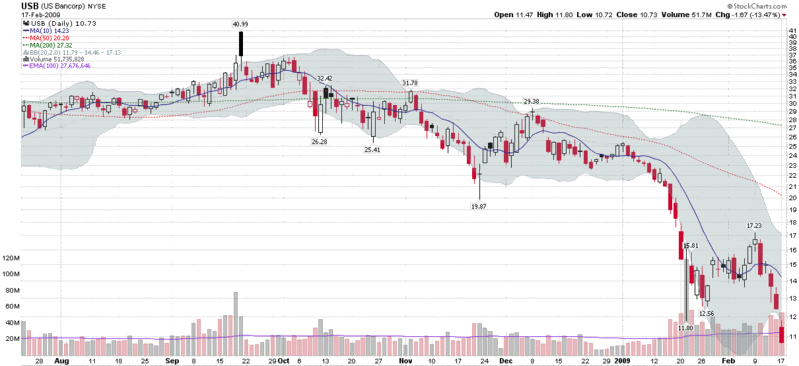
Not too long ago, Minneapolis-based US Bancorp (USB) was held up as an example as a ‘good bank’ with a strong loan portfolio. As recently as September, the stock was trading as high as 42 and the bank was widely hailed as one of the few national banks that was gaining ground on weaker competitors. On January 21, however, the bank announced a 65% drop in earnings as a result of a deteriorating loan portfolio and securities losses and the story began to unravel.

In reviewing the performance of bank stocks over the course of the past week, I was surprised to see that among large banks, US Bancorp has been the worst performer of all. The chart below shows the earnings-related 52-week low from January 21 was taken out decisively yesterday, following a week of heavy volume in which the stock lost a third of its value.

While investors are watching Citigroup (C) and Bank of America (BAC) closely for signs of weakness, perhaps US Bancorp and the regional banks are better indicators of what is going on in the banking landscape than their quasi-governmental big brothers.

[source: StockCharts]

Friday, January 16, 2009

VIX January Options as Short-Term Portfolio Protection

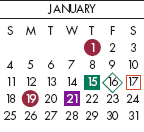
I know that very few retail traders actively trade VIX options, but for those who usually do not consider this product, I want to highlight the fact that because the VIX expiration calendar is different from the standard third Friday of the month equity and index expiration calendar, this weekend might be an appropriate time to think about VIX options as a short-term portfolio protection play.

Anyone who has portfolio insurance in the form of options expiring tomorrow is likely concerned about what will happen over the long weekend, particularly with rumors about the possibility of Citigroup (C) and Bank of America (BAC) being nationalized. One solution, of course, is to roll those January options into February and beyond. If, however, you do not necessarily want to buy portfolio protection for a full month, then you can get it through Wednesday morning with the January VIX options. The last trading date for January VIX options is Tuesday, January 20th, with the options settled at the open on Wednesday morning.

Equity futures have been trending up over night, but substantial short-term risks remain, with all the uncertainty over the financials, compounded by a three day weekend, followed by the inauguration of Barack Obama coming up on Tuesday. I am not going so far as to recommend the purchase of VIX calls, but I do want to make sure that investors with a short-term horizon are aware of the VIX options expiration calendar anomaly.

[graphic: Options Industry Council]

Sunday, January 4, 2009

The Year in Global Volatility (2008)

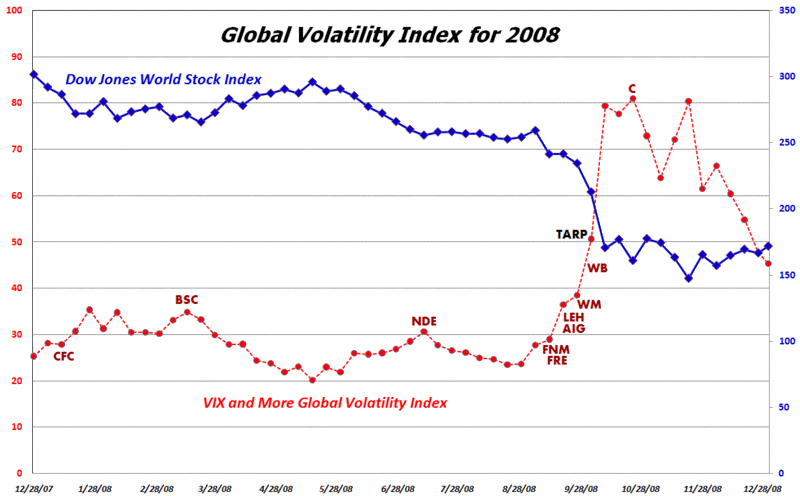
In November I launched the VIX and More Global Volatility Index, which is a weighted average of the implied volatility in options for equities in the 15 largest global economies. I will have more to say about the Global Volatility Index in 2009, but want to use this occasion to highlight the index as a means of tracking the rise of volatility in response to major volatility events during the course of the past year. In addition to the Global Volatility Index (shown in red), the chart below captures the Dow Jones World Stock Index (blue), as well as the signing of the TARP legislation (black) and the tickers (dark red) for some of the major financial companies that failed and/or were rescued by the U.S. government.

[source: VIX and More]

Friday, November 21, 2008

International Securities Exchange Revamps Implied Volatility Charts

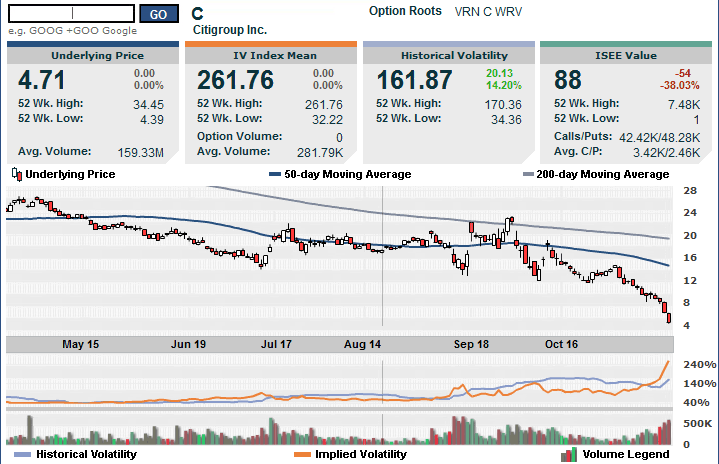
The International Securities Exchange (ISE), which publishes a superb implied volatility chart that I have featured on VIX and More on a number of occasions, has recently launched an enhanced version of their IV chart. The new version of this chart, which I have appended below, adds an “ISEE value” to the list of data. I have discussed the ISEE call to put ratio frequently in this space in the past. In this incarnation it is simply a ratio of call volume to put volume for the specified security.

I chose Citigroup (C) as my example security because all eyes should be on this bank, which is now trading at a 14 year low after hitting 3.57 earlier this morning. If Citigroup crumbles, it will dwarf the chaos created by AIG and Lehman Brothers.

Finally, for more information on the company that is the source of the volatility charts used by the ISE, check out Livevol.

[source: International Securities Exchange]

Monday, November 17, 2008

The Big Four U.S. Banks

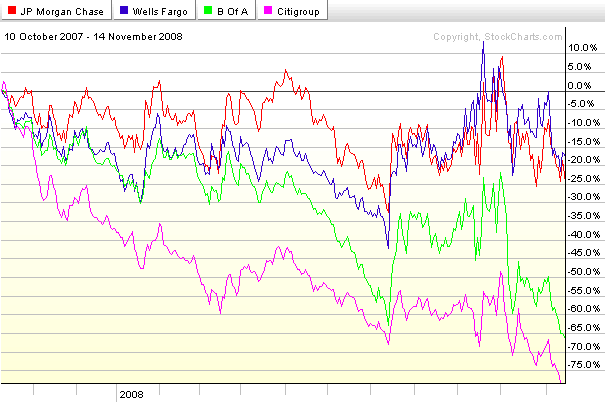
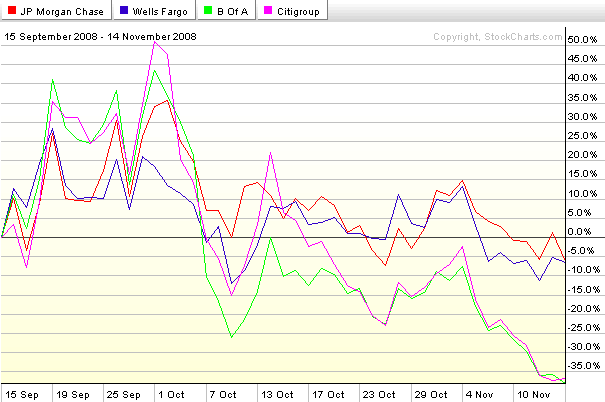
The events of 2008 have completely reshaped the landscape of the U.S. commercial banking industry. At this point it looks as if four major banks will emerge as the dominant players: two relatively strong ones; and two that face a more challenging competitive environment. Here the charts identify the players nicely. From the peak of October 2007, Wells Fargo (WFC) and JPMorgan Chase (JPM) have each fallen about 20%, less than one half of the drop in the financial sector ETF, XLF. At the other end of the spectrum are Bank of America (BAC) and Citigroup (C), each of which has seen their stock drop at least 65% during this period. See the top chart for details. Refocus to the period since the failure of Bear Stearns (bottom chart) and the pattern is even more dramatic, with WFC and JPM each down a little more than 5% while BAC and C are down over 35%.

XLF made a new low of 11.70 on Thursday and is trading at about 12.00 as I type this. If XLF and the large commercial banks are not able to scrape out a bottom, then this market will not be able to sustain any rally. Better yet, add XHB (homebuilders) and XLY (consumer discretionary sector) to that list. A sustainable rally will require the participation of XLF, XHB, and XLY.

[source: StockCharts]

Wednesday, November 12, 2008

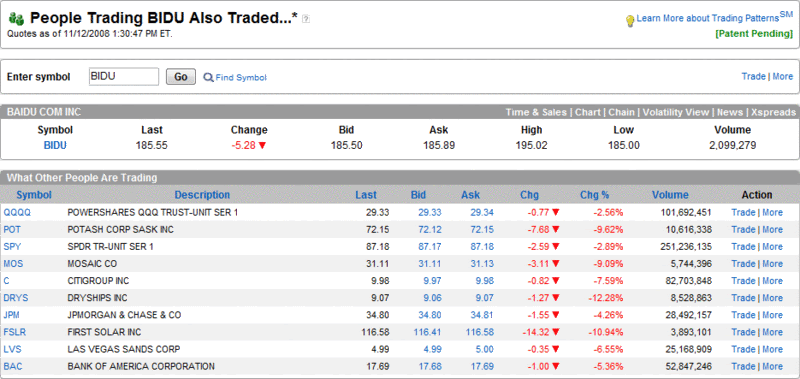
People Trading BIDU Also Traded…

Back in September 2007, I started periodically posting snapshots from the optionsXpress Trading Patterns feature and chose to highlight the highly speculative Chinese internet search firm, Baidu (BIDU), then trading at 299, as my guinea pig. Over the course of seven months, I twice updated what traders who traded BIDU were also trading at optionsXpress when BIDU was at 380 on 10/30/2007 and when it was at 350 on 4/22/2008.

I just captured the most recent Trading Patterns update, which shows traders who are trading BIDU (currently at 185) are still active in the most volatile names in agriculture, financials, shipping, solar, and casinos. The stocks on the top ten list: Potash (POT), Mosaic (MOS), Citigroup (C), JPMorgan Chase (JPM), Bank of America (BAC), DryShips (DRYS), First Solar (FSLR), and Las Vegas Sands (LVS). Also on the list are two ETFs, QQQQ and SPY. Either optionsXpress customers have been cleaning up on the short side or they are a little early to the bull party.

[source: optionsXpress]

Monday, July 14, 2008

Volatility and Sentiment Tidbits…and Today Doesn’t Matter

Some semi-random thoughts inspired by today’s market action:

  • The VIX:VXV ratio spiked up to 1.12 at 1:12 p.m. EDT (I’m not superstitious, but that’s an interesting bullish signal)

  • The underappreciated VXN (volatility index for the NDX or NASDAQ-100) spiked over 34 on Friday and made it as high as 33.76 earlier today. That’s not enough to satisfy the “VIX must spike over 30!” purists, but it is an interesting data point, particularly because the VXN and NDX excludes financials

  • My VIX algebra says that two medium to large VIX spikes on Friday and today do not equal one large capitulation-friendly VIX spike

  • The CBOE equity put to call ratio – an excellent market timing indicator – is looking bullish

When all is said and done, I don’t think we can have a serious market rally until the tone of the news flow changes, regardless of market technicals and sentiment data. There must be several bullish macroeconomic and/or fundamental data points which collectively give the bulls a reason not to be so skittish. At a minimum, the markets need to navigate the PPI, CPI, industrial production and capacity utilization data due out tomorrow and Wednesday, then weather the flood of earnings reports (with strong representation from some key financial institutions) on Thursday. Even then, there is the Citigroup (C) earnings story on Friday morning.

Whatever happens to the rest of today’s session, the balance of the week will tell the story.

Tuesday, May 27, 2008

Whither COF?

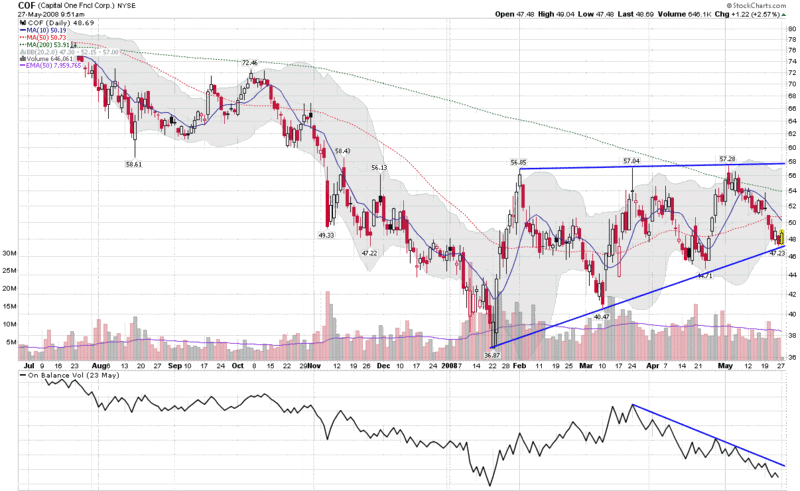
Ever since the onset of the credit crisis, it seemed like only a matter of time before problems in the area of home mortgages and HELOCs inevitably spread to credit cards. Given that Capital One Financial (COF) has dipped heavily into the subprime borrower market, it seems to reason that COF will be a large part of the collateral damage.

So far, COF has been able to keep charge offs at a manageable rate, one that was stable at 6.1% in March and April. This leveling off of the charge-offs in the most recent month prompted Goldman Sachs analyst Brian Foran to offer optimistically, “any sign that credit deterioration in U.S. card could be taking a breather is positive.”

COF’s stock is currently 30% above the January low and has traded in an ascending triangle, as the chart below shows. While the stock is up this morning, it is testing the bottom of the triangle pattern. Ominously, on balance volume shows a significant divergence from the price pattern, with at least three significant distribution days (down on above average volume) over the past four weeks.

While XLF, XBD, C and LEH are all important indicators of the health of the financial sector, keep an eye on COF to see how the credit crisis is affecting subprime credit card holders.

Thursday, April 17, 2008

Citigroup and Implied Volatility

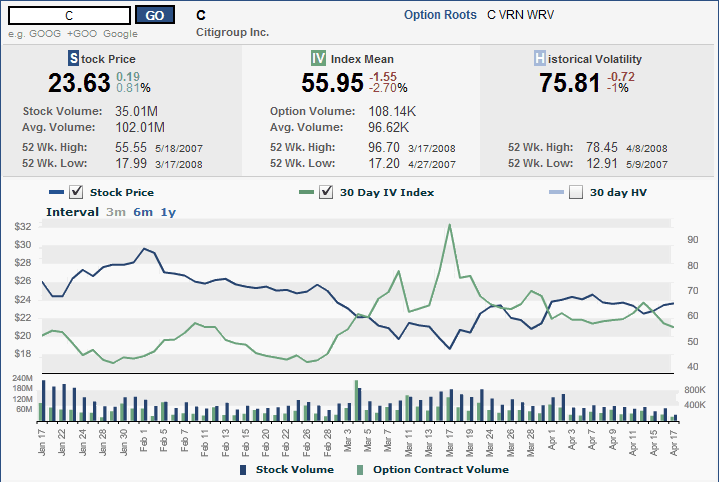
Consider for a moment that much beleaguered Citigroup (C) is going to report earnings tomorrow morning on options expiration day.

Shouldn’t implied volatility tell us something about how anxious investors should be? Well, that is indeed the case, but the story is not perhaps what one might expect. If implied volatility is to believed, anxiety about Citigroup’s plight peaked about a month ago (when the stock market bottomed) and has been declining ever since. At current levels, Citigroup’s implied volatility is at the lowest level it has been in the past six weeks.

I have included Citigroup’s three month implied volatility chart below, as it is too interesting to let this one go and should make nice fodder for the archives.

Thursday, January 24, 2008

MBI, Bond Insurers, and Volatility

One of the more interesting – and important – subplots to keep an eye on during the current market difficulties is that of the bond insurers. The two most prominent of these bond insurers, MBIA (MBI) and Ambac (ABK), are in the news today with reports that the New York Insurance Superintendent is trying to arrange a capital infusion from the likes of Goldman Sachs (GS), Merrill Lynch (MER), JPMorgan (JPM), Citigroup (C), and Wachovia (WB). Presumably, the Fed is doing some arm twisting and offering some financial incentives behind the scenes, as a failure to resolve the problems with the bond insurers would likely trigger systemic havoc and involve a long and expensive list of dominoes in the process.

Eric Dinallo, the New York Insurance Superintendent, was quoted earlier today as saying that while a rapid resolution is essential, ironing out the details of a bailout may take awhile. “It is important to resolve issues related to the bond insurers as soon as possible,” Dinallo noted, while cautioning “these are complicated issues involving a number of parties and any effective plan will take some time to finalize.”

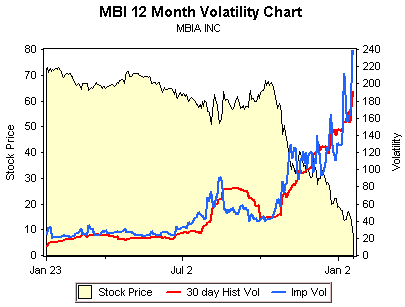
While most investors should be thinking about the bond insurer issue in terms of its impact on the broader markets, there are some interesting plays on bond issuers themselves. As reported in 24/7 Wall Street, Goldman Sachs laid out some potential valuations under three different scenarios, ranging from the bond insurers’ being unable to raise enough capital to mollify the rating agencies to a situation where the capital raised enables the bond insurers to continue to operate as they had in a pre-crisis mode. Looking just at MBI, the valuation spread ranges from $6 to $48.

Investments don’t get much more speculative than this, as the chart from optionsXpress above shows. For the record, all February puts now carry an implied volatility of more than 200. While I am not going to recommend a specific trade here, there are some fascinating options spreads and ratio spreads to look at for those who believe that the Goldman scenarios and numbers are in the ballpark.

Tuesday, November 6, 2007

SPDR Check: Technology and Financials

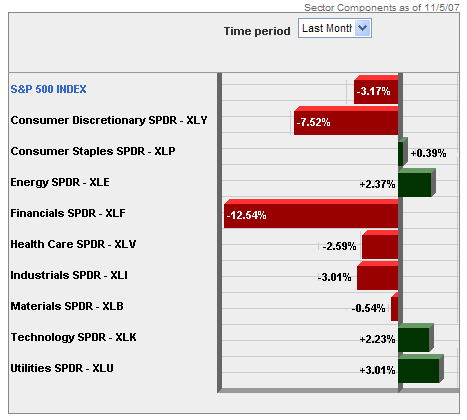
Back in August, I posted about some interesting divergences in implied volatility in the technology and financial sectors. Fast forward two and a half months and with Citigroup (C), Merrill Lynch (MER) and their brethren in the dog house while Google (GOOG), Research in Motion (RIMM) and the most of the other large cap tech stocks on a tear, the story has morphed from diverging implied volatility to diverging performance and future expectations.
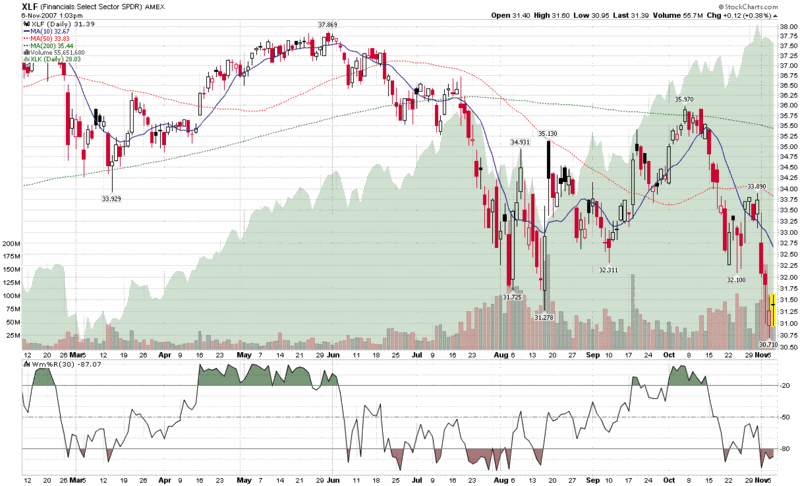
So this seems like a good time to look at my favorite AMEX Select Sector SPDRs again to see what has happened. In the chart below, I compare the plight of XLF, the financial sector SPDR (XLF top holdings), to XLK, the technology sector SPDR (XLK top holdings.) Where I see the big divergence in performance is following the second week in October, from which point the financials have been beaten down almost as badly as they were during the dramatic July-August drop. The interesting part this time around is technology stocks, which fell in sympathy with financials during the summer, yet have been almost unassailable during the past three weeks.

I am skeptical that the market can continue to remain in a bullish mode without the participation of the financials, yet, on the other hand, the fundamentals of technology stocks do not seem to warrant that they join financials on the bear side of the ledger. For now at least, the bears will have to be content with claiming victory in the financial, consumer discretionary and real estate sectors, while the bulls control the majority of the remaining sectors. Eventually, I expect all the bulls or all the bears to capitulate in a dramatic major move. I’m not sure whether the move will be up or down, but each sector skirmish will provide some additional clues.

DISCLAIMER: "VIX®" is a trademark of Chicago Board Options Exchange, Incorporated. Chicago Board Options Exchange, Incorporated is not affiliated with this website or this website's owner's or operators. CBOE assumes no responsibility for the accuracy or completeness or any other aspect of any content posted on this website by its operator or any third party. All content on this site is provided for informational and entertainment purposes only and is not intended as advice to buy or sell any securities. Stocks are difficult to trade; options are even harder. When it comes to VIX derivatives, don't fall into the trap of thinking that just because you can ride a horse, you can ride an alligator. Please do your own homework and accept full responsibility for any investment decisions you make. No content on this site can be used for commercial purposes without the prior written permission of the author. Copyright © 2007-2023 Bill Luby. All rights reserved.
 
Web Analytics