Showing posts with label RIMM. Show all posts

Sunday, April 5, 2009

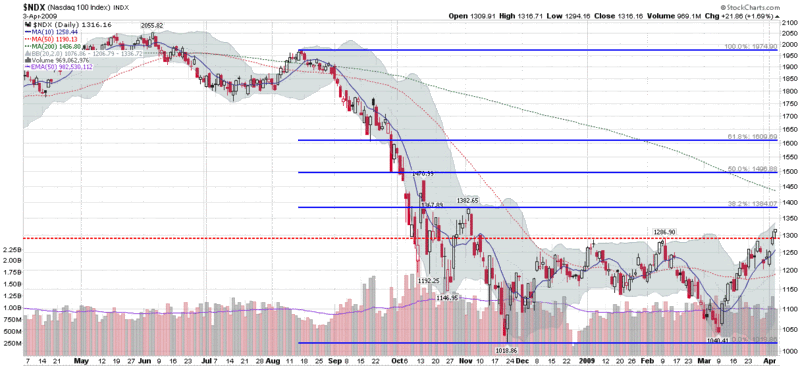
Chart of the Week: The Resurgent NASDAQ-100

Technology is back and large cap technology is helping to lead the recent rebound in equities.

Even after a four week rally, 2009 has been mostly a sea of red. In fact, the two headline indices, the Dow Jones Industrial Average and S&P 500 index, are down 8.65% and 6.73% so far in 2009. Neither large caps nor small caps are performing particularly well, with the large cap S&P 100 (OEX) down 8.27% and the small cap Russell 2000 (RUT) down 8.67% year to date.

The technology-heavy NASDAQ has been a very different story, with both the NASDAQ composite index (+2.84%) and NASDAQ-100 (+8.63%) in the green.

In the chart of the week below, I have highlighted the NASDAQ-100 index (NDX), which closed at its highest level since early November on Friday, following a strong earnings report and increased guidance from Research in Motion (RIMM). The NDX is a weighted index of the largest 100 companies in the NASDAQ, as measured by market capitalization. As such, the largest weightings read like a who’s who list of large technology companies: Microsoft (MSFT); Google (GOOG); Cisco (CSCO); Apple (AAPL); Oracle (ORCL); Intel (INTC); Qualcomm (QCOM); etc.

Whether or not the resurgent NDX can continue to rally and retrace its steep drop from September and October will go a long way toward determining if the broader markets will be able to gain enough momentum to also finish 2009 in the green.


[source: StockCharts]

Friday, January 23, 2009

Four Horsemen of Technology Running Strong Again?

In this market, I find it hard to think of any stock as ‘running strong’ unless they are in the precious metals business, but strong can also be a relative term.

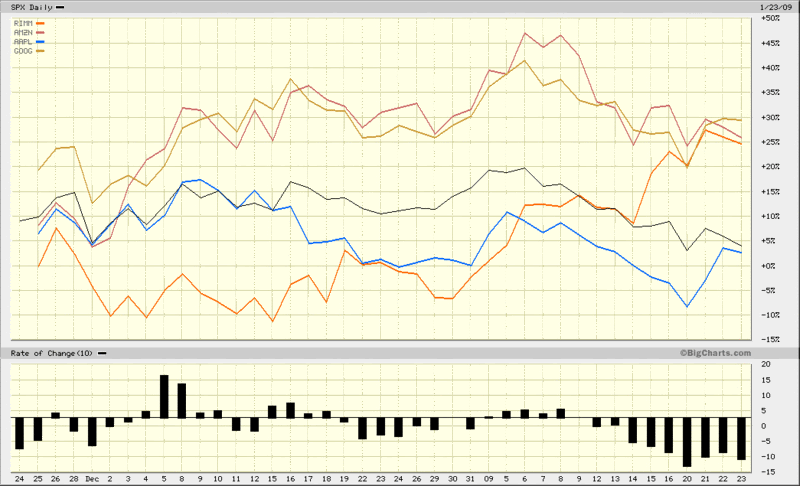
Some stocks have held up better than others – and even shown considerable buying interest – over the course of the past few weeks and months. Four which stand out from the past are the so-called Four Horsemen of Technology: Research in Motion (RIMM); Amazon (AMZN); Google (GOOG); and Apple (AAPL).

All four of these large cap tech generals have recently provided a positive earnings surprise, with the most recent surprise coming with Google yesterday afternoon. Had it not been for the Steve Jobs health issue, all four stocks would be crushing the S&P 500 index over the course of the past two months highlighted in the chart below. In fact, even with the Jobs issue, Apple is relatively even with the broad market index.

Investors are wondering which stocks will provide leadership in the next bull leg. My guess is that the next group of leaders will include one or more of these tech titans.


[source: BigCharts]

Disclosure: Long GOOG at time of writing.

Thursday, December 11, 2008

Where Is the Leadership in this Rally?

For the last three weeks, I have been impressed by the confidence and resolve shown by the bulls as they have consistently used pullbacks to flood the market with new long positions. Perhaps algorithms have no fear…

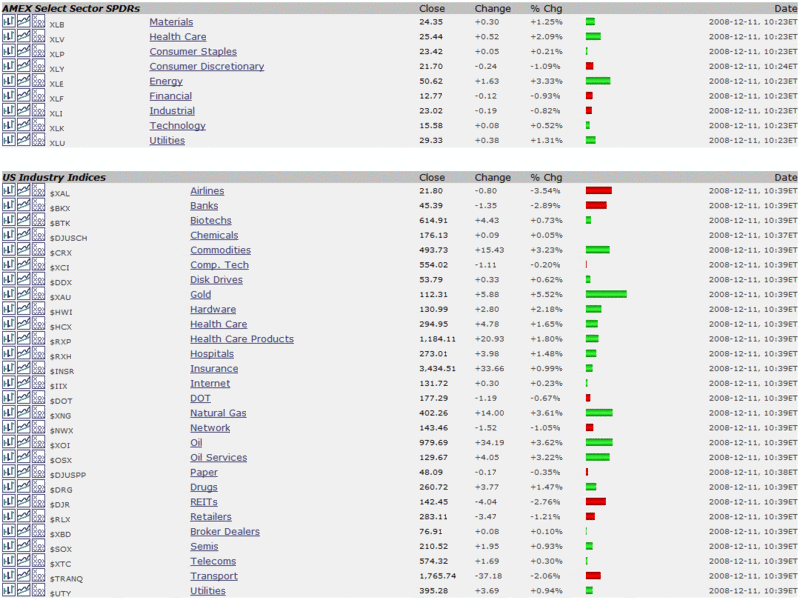
More recently, however, as the bull leg has stalled around the SPX 900 mark, I have found myself thinking about the lack of ‘proper’ leadership. Yesterday and today, the rallies have been led by commodities, with gold and energy equities the top performers.

At the same time, the three sectors I think are most critical to the recovery, my so-called ‘indicator species’ sectors (financials, homebuilders and consumer discretionary stocks), have been unable to get out of the red today.

I am not sure where the leadership will come from that will eventually push the SPX back over 1000. Today large cap technology names First Solar (FSLR), Apple (AAPL), Dell (DELL), Research in Motion (RIMM), eBay (EBAY) and Intel (INTC) are all strong performers. Frankly, I would expect technology to play a strong role in the next big leg up, but leadership may come from a number of other sectors.

There are few guarantees in the stock market, but I can guarantee that gold and energy are not going to pull the SPX up over the 1000 mark and leave financials (XLF), homebuilders (XHB), and consumer discretionary stocks (XLY) behind.

[source: StockCharts]

Monday, October 13, 2008

Institutional Interest High in These Nine Large Caps

Stocks of all sizes and shapes are trading up today, but which ones will continue to do well if the market holds up?

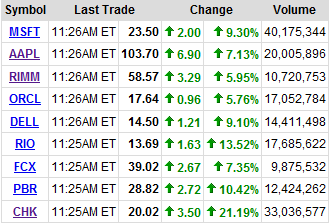
In the graphic to the right (courtesy of Yahoo) I highlight nine large cap stocks that appear to be the biggest targets of institutional interest not just today, but when the markets moved up in spurts last week too. Those that made the cut did so on the basis of several price factors and several volume factors. The list consists of five technology names (MSFT, AAPL, RIMM, ORCL, and DELL), two mining/metals stocks (RIO, FCX), and two energy stocks (PBR and CHK). Interestingly, two of the nine companies are based in Brazil.

At the very moment at least, these nine companies look to be at the top of the heap: quality stocks at attractive valuations, with considerable institutional interest. I would expect these names to continue to lead the way in subsequent bull moves.

Note that one company on this list may be somewhat of a special case. Chesapeake Energy (CHK) CEO Aubrey McClendon was forced to sell “substantially all” of his 33 million shares last week to meet a margin call. With that forced selling completed, the stock is bouncing back today.

Wednesday, November 21, 2007

OHFdex Update

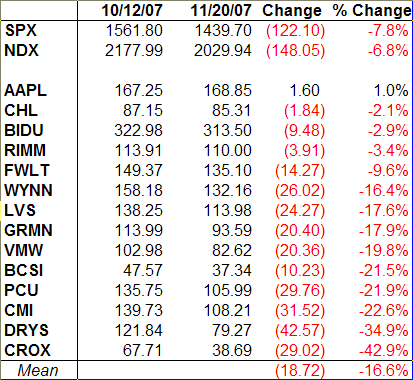
Since several readers expressed some interest – or at least some amusement – in the OHFdex (Overripe High Fliers Index) I unveiled back on October 12th, I though it might be interesting to see how these high fliers have fared during the recent market turmoil.

Given that most major indices peaked at the end of October, I did not expect the changes from October 12 to November 20 to be particularly dramatic, but as can be seen below, the devastation over the past 5 ½ weeks has been widespread and substantial, even though it is only a small portion of most of the peak to trough losses over the past three weeks.

The companies that have fared the best during the period in question have done so partly with a stronger post-October 12 runup, but also by doing a better job of weathering the current downturn. These are the tech stalwarts, AAPL and RIMM (GOOG was also up 11 points during this span), as well as the two Chinese tech plays, BIDU and CHL.

I have been short five stocks on this list at one time or another during the past three weeks: AAPL; BIDU; GRMN; DRYS; and CROX. I suspect that most of the easy money on the short side has already been made, but if the NDX fails to hold 2000 and if the NASDAQ composite cannot stay above the 200 day SMA (currently 2584), I’ll flip from neutral to bearish and look to this list to find where the momentum money is most nervous.


Tuesday, November 6, 2007

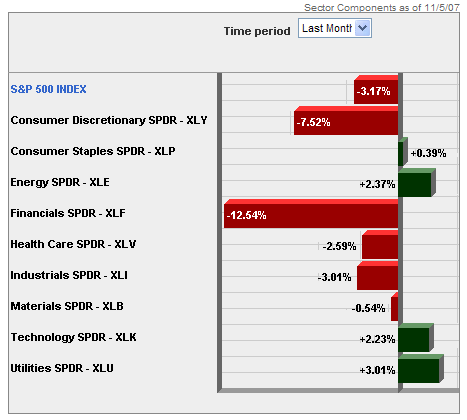
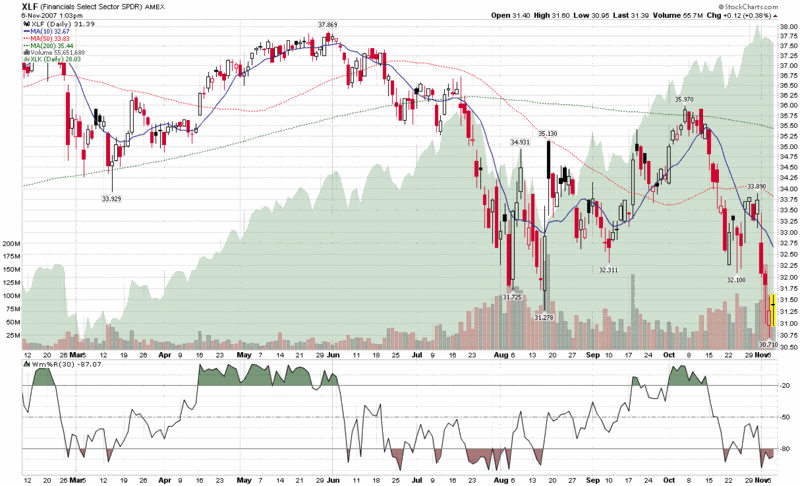
SPDR Check: Technology and Financials

Back in August, I posted about some interesting divergences in implied volatility in the technology and financial sectors. Fast forward two and a half months and with Citigroup (C), Merrill Lynch (MER) and their brethren in the dog house while Google (GOOG), Research in Motion (RIMM) and the most of the other large cap tech stocks on a tear, the story has morphed from diverging implied volatility to diverging performance and future expectations.

So this seems like a good time to look at my favorite AMEX Select Sector SPDRs again to see what has happened. In the chart below, I compare the plight of XLF, the financial sector SPDR (XLF top holdings), to XLK, the technology sector SPDR (XLK top holdings.) Where I see the big divergence in performance is following the second week in October, from which point the financials have been beaten down almost as badly as they were during the dramatic July-August drop. The interesting part this time around is technology stocks, which fell in sympathy with financials during the summer, yet have been almost unassailable during the past three weeks.

I am skeptical that the market can continue to remain in a bullish mode without the participation of the financials, yet, on the other hand, the fundamentals of technology stocks do not seem to warrant that they join financials on the bear side of the ledger. For now at least, the bears will have to be content with claiming victory in the financial, consumer discretionary and real estate sectors, while the bulls control the majority of the remaining sectors. Eventually, I expect all the bulls or all the bears to capitulate in a dramatic major move. I’m not sure whether the move will be up or down, but each sector skirmish will provide some additional clues.

Friday, October 26, 2007

NASDAQ 100 Taking NASDAQ Composite for a Ride

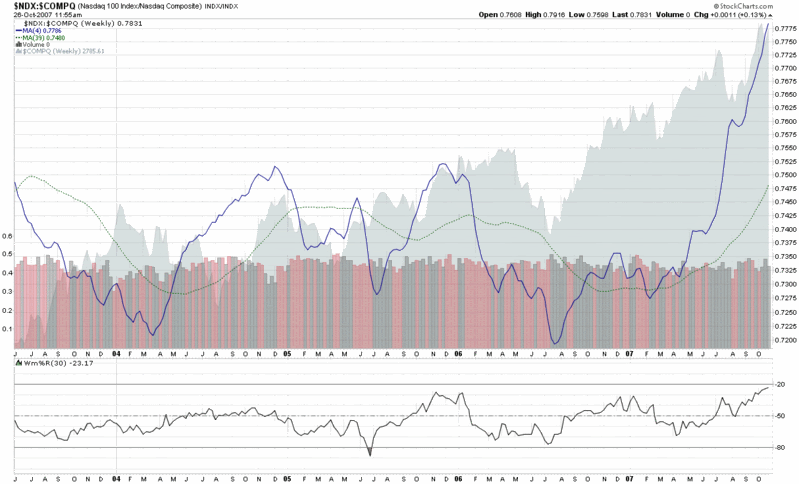
This is probably just stating the obvious, but in keeping with the recent theme of a handful of generals and market breadth analysis, I thought I should highlight a comment from yesterday by Ben Bittlrolff who points to a recent observation by Mike Shedlock that half of the gains in the NASDAQ so far this year are from only three stocks: AAPL, RIMM, and GOOG.

Expanding a little on that thought, I have constructed a weekly chart of the ratio of the NASDAQ-100 (NDX) to the NASDAQ Composite. For visual simplicity, I have eliminated the weekly values and included only the four week and 39 week simple moving averages. The storyline is fairly straightforward: ever since the February 27th selloff, the NASDAQ-100 [listing of the components of the NASDAQ-100] has been pulling the broader composite along for the ride. Scroll back to Mike Shedlock’s comments about the big three horses and it appears that these three en fuego large caps have been pulling both the NASDAQ-100 and the 3000+ stock composite index.

As I see it, one of two things is about to happen: either some other fresh horses are about to appear to help pull the sled or AAPL, RIMM and GOOG are going to run out of energy trying to get up one of these upcoming hills. Be sure to watch the ratio of the NASDAQ-100 to the NASDAQ composite for some clues on how this story is developing.

Wednesday, October 24, 2007

Four Generals Will Tell the Story

I am a big fan of market breadth indicators, but when considering whether or not the markets may be at a turning point, I prefer to focus on a handful of leaders rather several thousand small caps whose fortune is never to make it to CNBC’s scrolling ticker. Jeopardy may have “foods that begin with the letter Q” (one of my favorite movie scenes, for reasons I’m still not entirely sure of), but somehow I don’t think we’ll ever hear, “I’ll take micro-cap tickers for $200, Alex.”

Cramer has his “Four Horsemen of Technology” (RIMM, AMZN, GOOG, and AAPL), but this sector focus, while important, is a little too restrictive for my liking. I do think, however, that it is possible to get some meaningful information from watching only four stocks.

Right now, four areas of the economy that I am watching most closely are China, technology, global trade, and consumer spending. These areas just happen to coincide with four stocks that have been market leaders over the past few months, are current or recent members of my OHFdex (Overripe High Fliers Index), have recently made new highs, and probably need to continue to make new highs for this market to continue to the bull march.

In order of recent price strength, the four generals I am focusing on are Apple (AAPL), Baidu (BIDU), Southern Copper (PCU), and MasterCard (MA). Interestingly enough, it is possible that each of these stocks has already made an intermediate-term top. Apple has been the strongest of the group, but following an impressive earnings report on Monday evening, the stock gapped up and has slowly been drifting down since then. It would be hard to proclaim a top in AAPL right now, but the short-term momentum appears to have left the stock. Baidu’s earnings are tomorrow, but the high of October 11th is already starting to look like a possible top, as BIDU trades about 30 points below that high at the moment. Southern Copper has also been drifting down since an October 11th high; yesterday’s earnings report has done nothing to change the trend. Lastly, MasterCard’s high water mark dates from July 13th. The company has been a consistently impressive performer since it’s May 2006 IPO, during which time it has quadrupled in price. For the past three months the action has been mostly sideways, with the stock rising and falling over concerns about the impact of the credit crisis on retail spending.

My personal belief is that all four stocks will continue to come under pressure as the markets grapple with the possibility that the October 11th highs will be hard to take out. I am not a kiss and tell trader and I prefer not to talk about my trading and positions, but since many have asked, at present I am short all four generals, though I will not be short BIDU when it reports earnings tomorrow. For the record, anything less than a blowout quarter and BIDU could be the catalyst that turns the current small market correction into some longer term bearishness.

Now it’s your turn, readers. If you could only follow four individual stocks to divine the direction of the market, which stocks would those be?
Tuesday, September 25, 2007

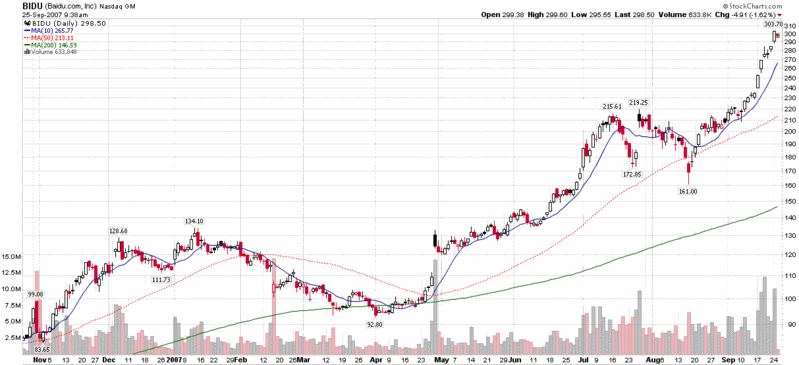
BIDU: Hogs (Eventually) Get Slaughtered

As I write this, BIDU is trading at about 301, meaning that if you got in near the August 16 low, you may be sitting on a 140 point profit.

I was indeed fortunate enough to grab some BIDU on August 16th, though nowhere close to the day’s low of 161. Over the course of the past few weeks I have been taking profits, with less than 10% of my initial position remaining after selling some earlier this morning.

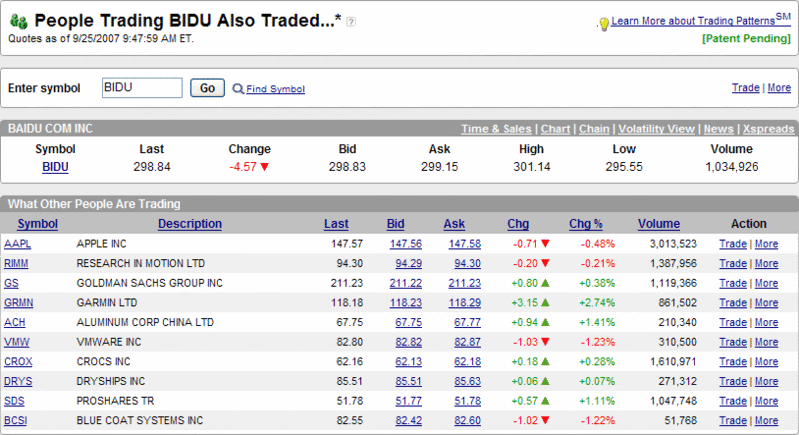
As I was selling some shares, it occurred to me that it might be time to update my watch list of “Overripe High Fliers.” This is a list of ten momentum stocks that I keep a close eye on and expect to provide some clues about speculative activity. These stocks should be strong when the market is rallying and move sharply down when the market turns down. The list currently consists of AAPL, BCSI, BIDU, CROX, DRYS, FSLR, GRMN, LVS, RIMM and VMW.

In keeping with Amazon’s “people who bought X also…” approach, optionsXpress has a tool that tells you what people who traded BIDU were also trading. The results, in the graphic below, could easily be an updated list of those “Overripe High Fliers.” Consider that when BIDU finally makes a sharp turn south (and I expect a -20 day soon), the rest of the stocks on this list will probably be dumped with the same bath water. Contrarians, aim your guns at these targets.


…and don’t count on the nearly vertical rise in BIDU to continue much longer. As a general rule, the steeper the rise, the more spectacular the fall back to earth.

DISCLAIMER: "VIX®" is a trademark of Chicago Board Options Exchange, Incorporated. Chicago Board Options Exchange, Incorporated is not affiliated with this website or this website's owner's or operators. CBOE assumes no responsibility for the accuracy or completeness or any other aspect of any content posted on this website by its operator or any third party. All content on this site is provided for informational and entertainment purposes only and is not intended as advice to buy or sell any securities. Stocks are difficult to trade; options are even harder. When it comes to VIX derivatives, don't fall into the trap of thinking that just because you can ride a horse, you can ride an alligator. Please do your own homework and accept full responsibility for any investment decisions you make. No content on this site can be used for commercial purposes without the prior written permission of the author. Copyright © 2007-2023 Bill Luby. All rights reserved.
 
Web Analytics