Showing posts with label GOOG. Show all posts

Friday, May 25, 2012

First Day of Trading in Nasdaq-100 Volatility Index (VXN) Futures

You really need a scorecard to keep up with the new product launches at the CBOE. Today was potentially a big one, with the launch of futures on the Nasdaq-100 Volatility Index, which most of us simply refer to as VXN or Vixen.

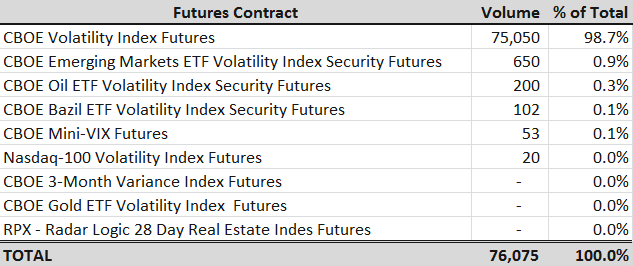
As the table below shows, the VIX continues to account for approximately 99% of the volatility index futures at the CBOE Futures Exchange (CFE). Today VXN futures (VN) traded 20 contracts on its opening day. While futures in the CBOE Emerging Markets ETF Volatility Index (VXEEM) are currently positioned at the #2 product at the CFE, VXN futures certainly have a lot of potential, with the likes of Apple (AAPL), Facebook (FB) and Google (GOOG) and other technology high fliers folded into this security.

On a related note, for anyone who may be interested, I authored the feature article, The Expanding Volatility Megaplex, in the current edition of Expiring Monthly. This article chronicles the history of volatility indices and looks at how the CBOE has recently begun to aggressively expand the scope of volatility indices and turn these into product platforms for futures, options and exchanged-traded products.

Related posts:

[source(s): CBOE Futures Exchange]

Disclosure(s): The CBOE is an advertiser on VIX and More

Thursday, May 10, 2012

Looks Like Apple VIX (VXAPL) Futures Are Coming Soon

In case anyone missed it, I wanted to highlight a report yesterday from Reuters which quoted  Edward Tilly, President of CBOE Holdings, as saying that not only is the VIX product line ripe for expansion, but:

“We have benchmarks on a number of other products. I would point out one that is a favorite of mine that I wouldn't be surprised if I saw us launch in the near future - futures on Apple VIX.”

The Apple VIX (VXAPL) was launched in January 2011 along with similar single stock volatility indices for the following:

  • Amazon (AMZN): volatility ticker: VXAZN
  • Google (GOOG): volatility ticker: VXGOG
  • Goldman Sachs (GS): volatility ticker: VXGS
  • IBM (IBM): volatility ticker: VXIBM

A successful launch of futures on VXAPL might open the door for futures on one or more of the other single stock volatility indices above.

The chart below, courtesy of Livevol (StockCharts.com, you really should have VXAPL in your database) shows that VXAPL has tended to remain in the mid-30s, but has ranged between the high teens to the high 50s in the first 17 months of its life.

Recall that the CBOE Futures Exchange (CFE) launched futures on the emerging markets volatility index (VXEEM) in December 2011 and followed up by launching options on VXEEM at the end of January. The CFE also launched futures based on VXEWZ (CBOE Brazil ETF Volatility Index, which is based on EWZ) on February 21 and added options to VXEWZ on March 6.

If you enjoy trading volatility products, it looks like we may be entering the golden era of shrink-wrapped volatility indices, which can serve as a product platform for futures, options and even exchange-traded products. If you think VIX-based ETPs are fun, just wait until a VXAPL-based ETP is rolled out. Of course, if there is not enough demand for the futures and options, some of these ETPs may never see the light of day, so early adopters, don’t shy about hitting some of those bids.

Finally, on a somewhat tangential note, I think I received more emails on The Case for Selling Apple Puts than on any other post in the history of VIX and More. To all those who wrote, including those who elected to sell Apple (AAPL) puts, the current environment may be suitable for a revisiting this trading strategy.

Related posts:

[source(s): LivevolPro.com]

Disclosure(s): long AAPL at time of writing; Livevol and the CBOE are advertisers on VIX and More

Thursday, January 5, 2012

VIX and More and the 2012 Bespoke Roundtable

I was delighted to be invited back for the third year in a row to share my thoughts about 2011 and 2012 as a part of Bespoke Investment Group’s third annual Roundtable.

As someone who trades options, just predicting what one stock or index will do over the course of a four-week expiration cycle can be a humbling experience. Since I rarely focus the bulk of my thinking more than two or three expiration cycles into the future, I always embrace the process of what I have come to think of as Bespoke’s comprehensive 37 question “take-home final.” Of course you don’t have to have an opinion about every issue out there to be a successful investor, but being informed about as many issues as possible makes you better prepared when the next surprise hits. As I noted in The Education of a Trader, anyone who has ever uttered, “Do we have to know this for the test?” is not cut out for trading, as every day in the financial markets is an open book pop quiz.

When it comes to formulating answers to these 37 questions, I tried to balance what I think are the most likely scenarios with more provocative comments about some low probability scenarios that I believe that a higher likelihood of coming to fruition than the rest of the crowd. The result is typically a patchwork of the unexciting and the outrageous. In 2012 it looks like I am leaning more toward the unexciting end of the scale, which is not difficult to do in a year in which the Mayan calendar may be predicting the end of the world, while many pundits are calling for at a minimum the end of the euro zone as we know it. That being said, I do think I have some provocative things to say about a wide range of issues, from Apple (AAPL) vs. Google (GOOG) to social networking and beyond.

The full set of my comments for 2012 is here.

For those who are curious how my crystal ball has fared in years past, my archived predictions for 2010 are here. If I can locate a link to my (decidedly less impressive) 2011 predictions, I will post that here as well.

I also recommend reading through some of the comments from the other participants in the 2012 Bespoke Roundtable. A splash page for the full set of predictions is here.

Related posts:

Disclosure(s): none

Wednesday, June 8, 2011

Apple Products vs. Platform

Apple (AAPL) is an unusual stock for several reasons, not the least of which is the strong retail demand for the stock and a large contingent of customer-zealots who regularly worship at the altar of Steve Jobs.

Throw together the factors mentioned above, Apple’s history of important product announcements at major events and the return of Jobs and his unique talent for unveiling new cutting edge products and you get an interesting confluence of events – and expectations – at Monday’s Apple Worldwide Developers Conference.

These conferences are always abuzz with rumors and speculation about the next big thing that Apple is going to announce which will once again change the technology landscape. When is the next iPad coming? What new features will it include? When will the iPhone 5 be out? What will the next iOS and Mac OS operating systems do? What will be the implications for the devices they run? What is the iCloud and what does it mean?

In the end, those hoping for groundbreaking new products were disappointed. The iPad, iPhone, iPod, MacBook, iMac, Mac Pro, AppleTV, etc. were not on stage. Instead, the hardware devotees had to settle for innovations which were confined to operating systems enhancements and the iCloud – stuff you can’t wait in line for at an Apple store, take home and dazzle your friends and family with.

The irony is that the obsession with hardware misses the big point. New products are critical to Apple’s business, but at best it gets them a first mover advantage that is not guaranteed to endure. The truth is that from a strategic perspective the iCloud is much more important to Apple’s future than any new product, because the iCloud is a platform play that enhances the value of the full range of Apple products and services, including future products and services.

Let me illustrate this with a personal example. I have about a quarter of a century of PC-based computer experience. I probably owned two dozen laptops before I bought my first Apple product, an iPhone. When the iPad 2 came out, however, it was easy for me to expand my stable of Apple products. Now that I am habituated to iTunes and the App Store, it is easier for me to contemplate something like the MacBook. With all of these devices seamlessly sharing data in the background on the iCloud, the data argument for expanding my suite of Apple products becomes that much more compelling. It is a similar story for my wife, who only recently began playing with her first Apple product, the iPad. She has been so completely won over that an iPod will soon follow and then I’m betting an iPhone will be too difficult to ignore. By the time she gets around to replacing her laptop, I’m fairly sure the MacBook Air will win her over – even if she doesn’t even know what it is right now.

I suspect that something similar is in the process of happening across the globe. Many of us who have spent the majority of our careers in a PC-centric corporate environment have often found Apple products to be too much of a compatibility issue to be worth the trouble. They have been relegated to toy status rather than serving as our our central computing devices. The iCloud gives Apple a chance to convert those PC cling-ons not only to exciting Apple products and services, but to a iCloud data world that could be a platform revolution. Device-independent data sharing is just around the corner and Microsoft (MSFT), Google (GOOG) and their ilk better have a strong alternative – and soon.

As for AAPL stock, it is down about 3% since Steve Jobs took the stage on Monday. Savvy investors should be thinking more about Brian Arthur’s Increasing Returns and the New World of Business and less about the timing of new product announcements.


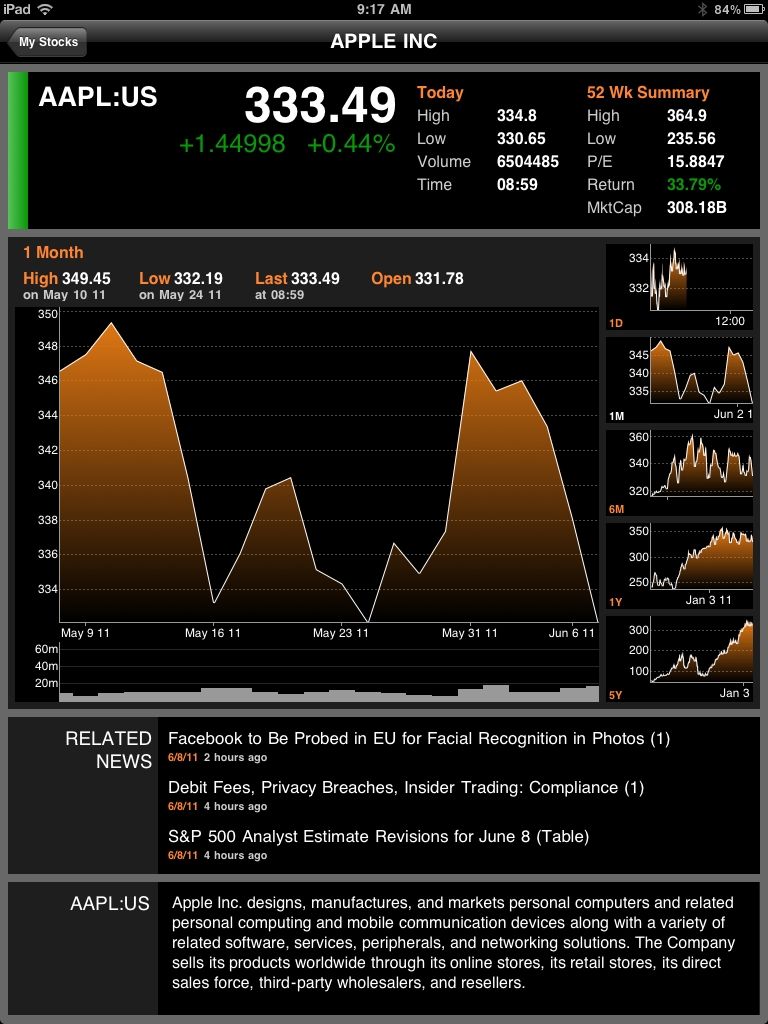
[graphic: Bloomberg for iPad]

Disclosure(s):
long AAPL at time of writing

Tuesday, April 26, 2011

A Trio of Niche iPad Financial Markets Apps

In my ongoing review of financial markets apps for iPad, there are several which defy easy categorization or appear to be the only entrants in their respective categories. Today I look at three such apps:

  1. ETFdb

  2. CBOE

  3. WolframAlpha
All three apps offer very different content that is aimed at users who focus on a specific niche of the investing world.

In the case of ETFdb, the focus is on ETFs and the app carries over much of the content from the popular ETFdb.com web site. The app has two main pieces of functionality: an ETF screener and ETFdb news articles. The screener is somewhat basic and the articles appear in chronological order, what it makes it difficult to keep track of specific sectors or asset classes in real-time. Still, when one drills down from the screening tool, some excellent ETF (and ETN) content is unveiled. The profile pages (see graphic below) include eight separate tabs that are filled with information, including data on holdings, fund performance, charts, technical analysis details, related news, and a link to the issuer home page, where one can generally find a prospectus, dividend information and other details. In short, ETFdb is an excellent tool for researching individual ETFs, though its screening and news functionality could use some enhancements.

The CBOE app covers a different slice or slices of the investment world. It includes general market data (indices, most active stocks, most active options, etc.), quotes, news and a watchlist function where users can pull up options chains and access data and charts for every option associated with a particular underlying. The CBOE app also has some high quality educational content from the Options Institute. Here one can learn the basics of options strategies, take an online course or review a variety of additional educational materials from the CBOE’s educational arm. CBOE TV content is also available on the app. These include videos on breaking news and timely subjects as well as more general background material. Last but not least, the CBOE app has a link to the CBOE twitter feed, which highlights significant options transactions, breaking news and new content on the CBOE web site. For those who are interested in options and particularly options education, the CBOE iPad app should be a high priority.

I found WolframAlpha to be the most interesting and difficult to describe of the three apps. This is partly because it had been awhile since I visited the WolframAlpha web site, but also because the app is such a superb fit for the iPad form factor and display. A self-styled “computational knowledge engine,” think of WolframAlpha as Wikipedia on steroids (lots of them), tied to a world class mathematical brain that effortlessly conveys the nuances of complex subjects with the help of an extremely deft use of statistics and graphics. Yes, it is an elegant nerd. Type in “VIX’ at the web site or in the iPad and you can quickly see what VIX is all about. Try “iron condor option” and you can quickly visualize and internalize much of what that strategy is all about. Tickers work too, though not all of them. Enter “GOOG” and the app (or web site) will pull some interesting stock data and graphics for Google. Unfortunately, there is no such luck with “VXX” and the rest of the VIX exchange-traded products. Unlike the other apps review above and in previous posts, the iPad version of WolframAlpha is not free, but for $1.99 I have little doubt that users will find a way to get their money’s worth out of this application.

In sum, these are three apps that cover a specific aspect of the investment universe and do so in an attractive manner. Investors interested in ETFs, options or computational data and graphics are encouraged to take each of these three apps for a test drive.

Related posts:

[graphic: ETF db]

Disclosure(s): short VXX at time of writing; the CBOE is an advertiser on VIX and More
Wednesday, January 5, 2011

CBOE to Publish VIX-Style Volatility Indices for Individual Stocks

The volatility space continues to expand in the direction of the atomic level, with today’s announcement by the Chicago Board Options Exchange (CBOE) that it will begin disseminating implied volatility data utilizing the VIX calculation methodology for five stocks as of Friday, January 7th.

The five stocks are:

My initial thought include some of the following:
  • It will be interesting to see how much divergence there will be between the CBOE NASDAQ 100 Volatility Index (VXN) and the volatility indices for some of the key components of the NASDAQ-100 index, notably Apple, Google and Amazon
  • A Goldman Sachs volatility index will be particularly useful in terms of financial crisis
  • IBM is an interesting choice for a fifth wheel here, as IBM does not have the same bellwether status that it once did
  • Finally, first with weekly options and now with volatility indices for individual stocks, the CBOE has managed to shorten the scope of volatility analysis both at the issue level and in terms of the time frame. I’m calling this the march toward atomic volatility.
Related posts:
Disclosure(s): the CBOE is an advertiser on VIX and More

Sunday, October 17, 2010

Chart of the Week: The Google Volatility Story

If there is one widely accepted tenet of volatility that my wife refuses to give in to, it is that when a stock falls sharply its implied volatility almost automatically increases, yet when that same stock jumps sharply, its implied volatility almost automatically decreases. Volatility should be directionally agnostic, she insists, whether it is implied volatility or historical volatility.

In the case of stocks, a balanced bi-directional view of volatility rarely prevails. The main reasons for asymmetric volatility expectations have to do with the beliefs that are associated with extreme price movements. The old aphorism, “Stocks take the stairs up, but the elevator down” has some statistical support and for most traders, considerable confirmation in terms of personal experience. Said another way, when something positive happens to a company, it rarely creates a virtuous cycle that lifts its stock price skyward. On the other hand, when things go bad, the dominoes have a habit of lining up in such a way as to create a vicious cycle of bad news, which some investors have dubbed the “cockroach theory” due to the fact that there never seems to be just one cockroach.

Partly as a result of elevators, cockroaches and personal experience, most equity options demonstrate a negative volatility skew (also known as a reverse skew or “volatility smirk”) in which out of the money puts have substantially higher implied volatility than out of the money calls.

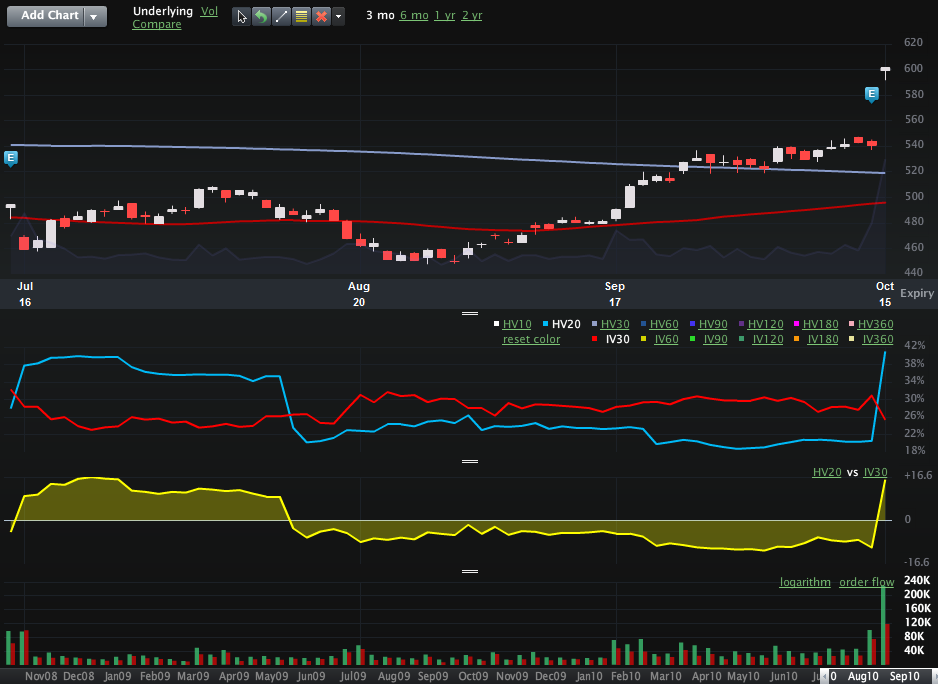
This week’s chart of the week shows the curious phenomenon that my wife takes issue with. Specifically, Google’s (GOOG) stock price jumped 11% on Friday following a very strong earnings report. As the chart below shows, historical or realized volatility jumped dramatically (20-day historical volatility almost doubled from 21 to 41,) while implied volatility fell sharply (30-day implied volatility dropped from 30.24 to 25.35.)

With Google’s earnings out of the way, clearly some event volatility was removed from the stock’s immediate outlook, but did Friday’s 60 point jump in the stock prices really make it less susceptible to future volatility. That is what the data would have us believe…

Related posts:


[source: Livevol Pro]

Disclosure(s): Livevol is an advertiser on VIX and More
Friday, August 27, 2010

Google Fixes Gmail Problems Plaguing VIX and More Newsletter Subscribers

Apologies to all the VIX and More newsletter subscribers who have been victimized by Google’s (GOOG) Gmail glitch that resulted in multiple emails containing Sunday’s subscriber newsletter.

According to Google's technical team and news reports, this glitch was finally resolved yesterday.

I note that a few subscribers have elected to cancel their subscription during this period of Gmail difficulties. To those who have canceled their subscriptions, I want to make four points:

  1. Google and various news reports (see links above) confirm that the problem originated with Google
  2. the multiple emails did not involve any virus (Norton and two other anti-virus programs confirm I am running in a virus-free environment) and thus did not put any subscriber at risk
  3. I elected not to communicate more than once during this period, because I was concerned about starting another chain reaction of recurring emails
  4. anyone who recently canceled their subscription and wishes to re-subscribe may do so here and receive the next 14 days free of charge

Thank you all for your understanding and patience.

Cheers and good trading,

-Bill

Disclosure(s): none

Wednesday, October 21, 2009

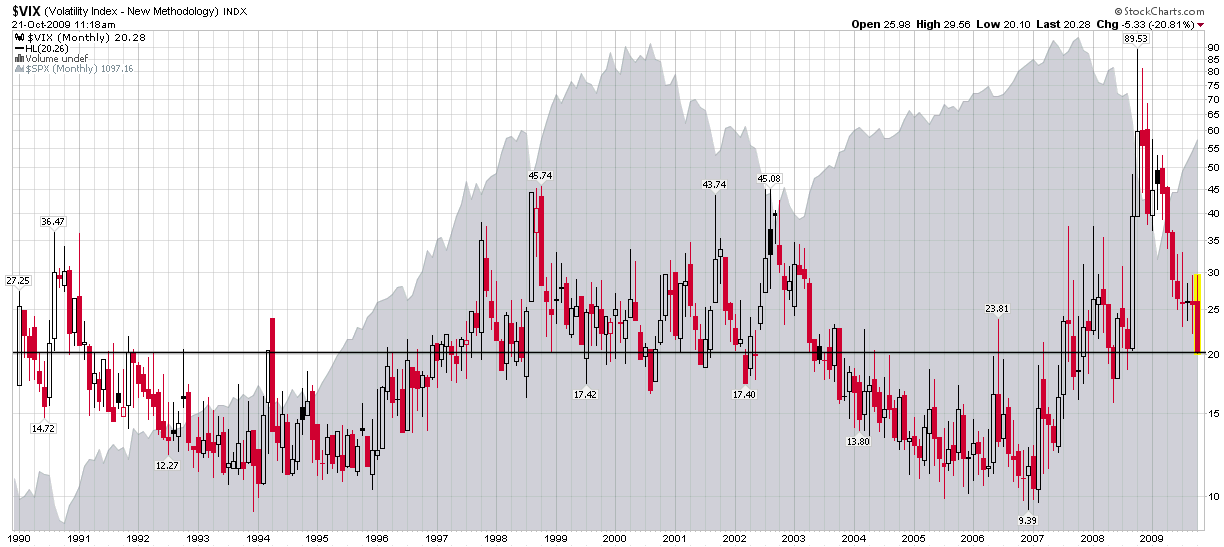
Anchoring and a VIX of 20

I can’t quite decide whether to be delighted or puzzled that so many people seem to care that the CBOE Volatility Index (VIX) is approaching 20. In truth, I feel a little bit of each. When I started this blog, I decided to devote a fair amount of attention to this unusual statistic that very few people were aware of and most that did had stopped paying attention to out of boredom. Of course the VIX was at about 10 then, the markets were awash in liquidity, and following a volatility index felt about as useful as trying to estimate Usain Bolt’s times with a sundial.

Fast forward three years and many things have changed. I can certainly appreciate the role the VIX played in trying to help the masses quantify fear in the midst of the financial crisis. When the VIX hit 50, 60, 70 and 80, these new highs sent a message that the situation was getting worse – or that investors were willing to pay dearly to protect themselves from the many potential disaster scenarios looming on the horizon.

A funny thing happened when the markets started to recover. We started to hear a variety of opinions that the VIX was too low, that substantial risks still remained, etc. The “VIX is too low” argument has been heard for several months now, but it seems to be gathering steam as the VIX approaches 20.

More than 35 years ago, Amos Tversky and Daniel Kahneman wrote a seminal piece on anchoring called Judgment Under Uncertainty: Heuristics and Biases. In the words of the authors:

“In many situations, people make estimates by starting from an initial value that is adjusted to yield the final answer. The initial value, or starting point, may be suggested by the formulation of the problem, or it may be the result of a partial computation. In either case, adjustments are typically insufficient. That is, different starting points yield different estimates, which are biased toward the initial values. We call this phenomenon anchoring.”

This is the same line of thinking practiced by investors who watch GOOG hover around the 450 mark for week after week, thinking they will wait until the stock falls to 400 to buy it on the cheap. The problem is that when GOOG moves over 500, all that anchoring around the 450 has conditioned the brain to think that 500 is too expensive, no matter how much GOOG rallies from that level.

Turning to the VIX, not only have all those readings in the 30s, 40s and 50s been recently imprinted into the investor’s psyche, but so also has all the emotional turmoil associated with the financial crisis and stock market crash. Even if things are better, the argument goes, can they possibly be this much better so soon after the global financial system was teetering on the edge of a cliff? The short answer is that anchoring makes it difficult for many investors to adapt to new price ranges and a new set of circumstances as situations change. It is part of the reason why bulls cling to hope on the way down and perma-bears have difficulty changing their bias when the market bounces. Finally, it is why so many people seem to be incredulous that the VIX is almost down to 20.00 when the lifetime (20 year) moving average for the volatility index is 20.26. In terms of volatility, we are right at the VIX’s lifetime moving average, which means investors are pricing in an average amount of risk and uncertainty – in historical terms – at the moment.

Of course, if one were to be anchored in the last 12 months, the VIX would be at an all-time low. Conversely, if one were anchored in the period from 2004-2006, the VIX would be in the 99th percentile, almost at an all-time high.

So…pull up the anchor and set your sails for the new volatility environment.

[source: StockCharts]

Sunday, April 5, 2009

Chart of the Week: The Resurgent NASDAQ-100

Technology is back and large cap technology is helping to lead the recent rebound in equities.

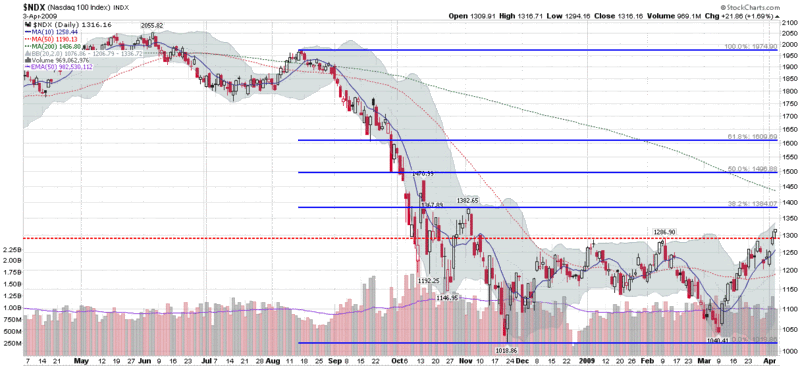
Even after a four week rally, 2009 has been mostly a sea of red. In fact, the two headline indices, the Dow Jones Industrial Average and S&P 500 index, are down 8.65% and 6.73% so far in 2009. Neither large caps nor small caps are performing particularly well, with the large cap S&P 100 (OEX) down 8.27% and the small cap Russell 2000 (RUT) down 8.67% year to date.

The technology-heavy NASDAQ has been a very different story, with both the NASDAQ composite index (+2.84%) and NASDAQ-100 (+8.63%) in the green.

In the chart of the week below, I have highlighted the NASDAQ-100 index (NDX), which closed at its highest level since early November on Friday, following a strong earnings report and increased guidance from Research in Motion (RIMM). The NDX is a weighted index of the largest 100 companies in the NASDAQ, as measured by market capitalization. As such, the largest weightings read like a who’s who list of large technology companies: Microsoft (MSFT); Google (GOOG); Cisco (CSCO); Apple (AAPL); Oracle (ORCL); Intel (INTC); Qualcomm (QCOM); etc.

Whether or not the resurgent NDX can continue to rally and retrace its steep drop from September and October will go a long way toward determining if the broader markets will be able to gain enough momentum to also finish 2009 in the green.


[source: StockCharts]

Friday, January 23, 2009

Four Horsemen of Technology Running Strong Again?

In this market, I find it hard to think of any stock as ‘running strong’ unless they are in the precious metals business, but strong can also be a relative term.

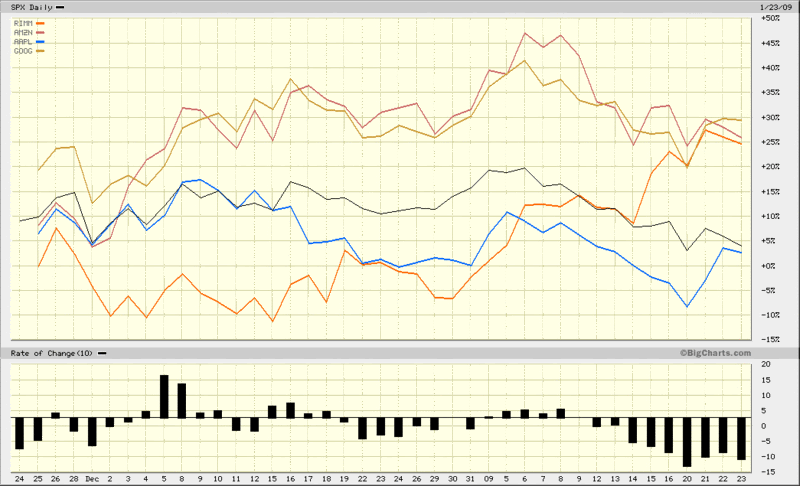
Some stocks have held up better than others – and even shown considerable buying interest – over the course of the past few weeks and months. Four which stand out from the past are the so-called Four Horsemen of Technology: Research in Motion (RIMM); Amazon (AMZN); Google (GOOG); and Apple (AAPL).

All four of these large cap tech generals have recently provided a positive earnings surprise, with the most recent surprise coming with Google yesterday afternoon. Had it not been for the Steve Jobs health issue, all four stocks would be crushing the S&P 500 index over the course of the past two months highlighted in the chart below. In fact, even with the Jobs issue, Apple is relatively even with the broad market index.

Investors are wondering which stocks will provide leadership in the next bull leg. My guess is that the next group of leaders will include one or more of these tech titans.


[source: BigCharts]

Disclosure: Long GOOG at time of writing.

Thursday, January 22, 2009

VIX (and VXN) After Hours

I recently received a question about large movements in the VIX at the end of the day.

Before I answer this question, it is important to recall that trading hours for index options are 9:30 a.m. – 4:15 p.m. ET.

As I see it, this question about late day movements in the VIX spans two very different time frames:

  • the last 15 minutes or so of the regular equities trading day (3:45 – 4:00 p.m. ET)
  • the 15 minutes following the close of trading of equities, during which stock index products are still traded (4:00 – 4:15 p.m. ET)

Looking at the earlier period first, during the last 15 minutes of regular trading on the NYSE and NASDAQ, high volume program trading often kicks in and includes or sometimes triggers a large volume of SPX options trades. These situations are relatively easy for retail trader to spot on the tape and are generally consistent with sharp moves in the SPX.

The fifteen minutes of index trading following the close of the equities market are more often associated with unusual large moves in the VIX. Part of the reason for this is the large volume of news that is announced just after the market close. Included in these announcements, of course, are earnings reports, such as today’s eagerly anticipated report from Google (GOOG).

In an announcement that crossed the wires at 4:01 p.m. ET, Google beat analyst estimates for both revenues and earnings, sending the stock up over 2% in the 15 minute twilight zone while index trading was still open.

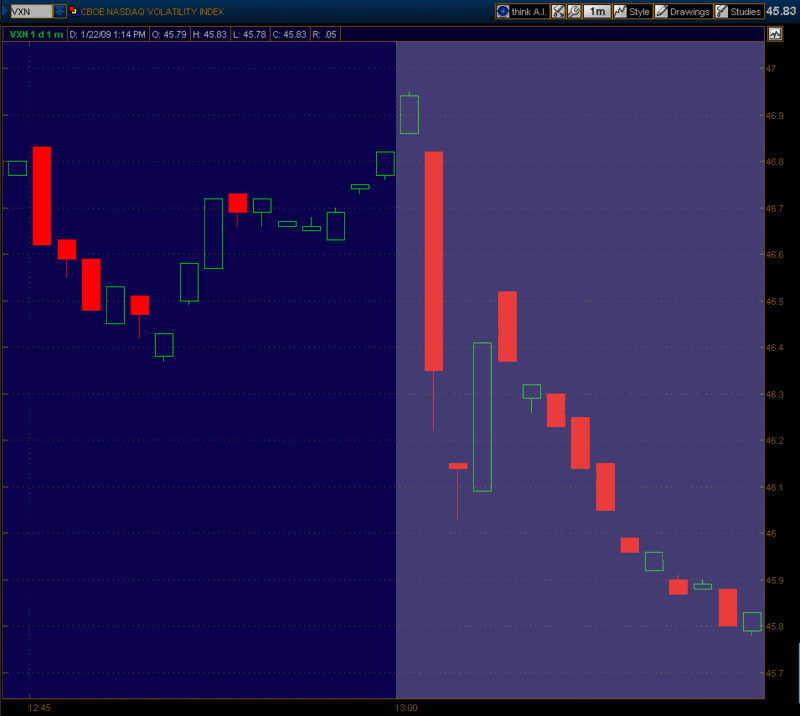
Google is the second largest component of the NDX (NASDAQ-100), so the obvious place to see Google’s impact on the volatility indices is the VXN. The chart below, courtesy of thinkorswim, shows the VXN during the last 16 minutes of today’s regular equities trading session (using my local PT time stamp), as well as during the 4:00 – 4:15 end of the index trading session. The chart shows the positive surprise in Google helped to push VXN down 0.99 (2.1%) in the 15 minutes after the close of trading in the NYSE and NASDAQ regular session. Had Google beaten analyst expectations by a larger amount – or had a significant miss – I would not have been surprised to see the VXN move 5-10% during the twilight zone.

[source: thinkorswim]

Monday, January 19, 2009

Options Action Debuts, Looks Like Fast Money With Options Trades

Options Action is a new options-oriented show that made its debut on CNBC on Friday night at 11:30 ET. Hosted by Melissa Lee, the show is clearly an options derivative of Fast Money, from the format to the graphics to the audio.

Given the choice between targeting options-savvy viewers and a broader audience, CNBC has elected to aim for the generalist audience by emphasizing the news and issues, while including some recommended stock trades along with the options trades. If you have a casual interest in options, this show could help grow your knowledge base; if you already consider yourself to be a relatively sophisticated options trader, Options Action is not likely to have a great deal of appeal.

The format relies on current news and investment issues, with Melissa Lee keeping things moving by prompting the guests for some brief analysis and asking for recommended stock and options trades. Financials were the top story on Friday, with some debate about the plight of Wells Fargo (WFC). Steve Jobs and Apple (AAPL); crude oil; and Microsoft (MSFT) vs. Google (GOOG) were the other items on the agenda.

For a debut offering, I thought guests Joe Terranova, Stacey Gilbert, Jim Iurio, Mike Khouw and Brian Stutland did an excellent job of bringing a variety of perspectives to bear on each issue, with reasonably strong interplay among the group. My favorite part of the show centered around the discussion of a naked sale of Google June 300 puts for 43.00, as recommended by Stutland, or selling a put spread instead, as recommended by Gilbert.

In terms of options-specific material that you might not find on Fast Money, in addition to the proposed options trades, there was a quick blurb on unusual options volume at United Technologies (UTX) as well as several charts that showed five day options volume trends in some of the other featured companies. Other than that, the name of this program could easily have been Fast Money: Options Edition.

CNBC has Friday’s show archived in three parts for anyone who wants to see what they missed:

  • Part 1 -- Wells Fargo and the financials; Apple; crude oil
  • Part 2 -- Microsoft vs. Google
  • Part 3 -- Final trades: Apple, ConocoPhillips (COP), Microsoft, infrastructure plays

Monday, April 21, 2008

The Energy and Materials Rally

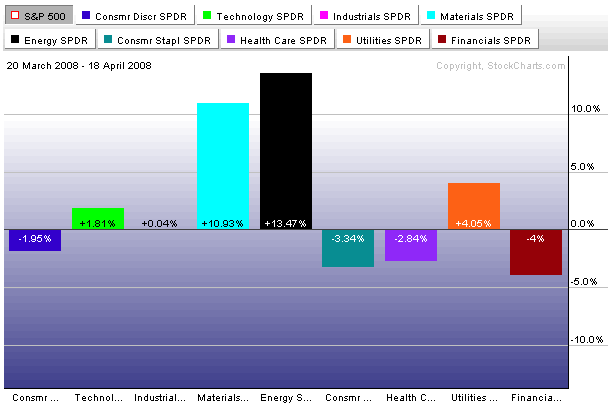
While Google (GOOG), Caterpillar (CAT), and other big technology and industrial names have recently helped push stocks to their best levels in three months, the rally off of the March 20th bottom may not have the kind of sector composition behind it that is conducive to an extended move. In fact, so far the bull run has been largely the result of strong performance in the energy and materials sector – a good portion of which can be attributed to the search for a hedge against inflation.

The chart below shows the performance of the nine AMEX Select Sector SPDRs relative to the S&P 500 index since the March 20th bottom. The sectors normally associated with an economic turnaround – technology (XLK), industrials (XLI), and consumer discretionary (XLY) – have heretofore not been leading the charge. On the other hand, the leading sectors over the past month – energy (XLE) and materials (XLB) – are not the sectors that typically are able to lead a sustainable rally. In the next week or two, look for other sectors to start outperforming the energy and materials group. If this fails to happen, there will probably not be sufficient market breadth to keep the current rally alive.

Wednesday, November 21, 2007

OHFdex Update

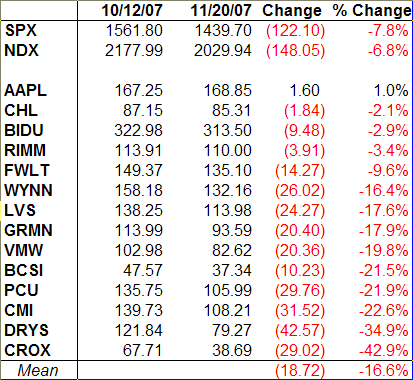
Since several readers expressed some interest – or at least some amusement – in the OHFdex (Overripe High Fliers Index) I unveiled back on October 12th, I though it might be interesting to see how these high fliers have fared during the recent market turmoil.

Given that most major indices peaked at the end of October, I did not expect the changes from October 12 to November 20 to be particularly dramatic, but as can be seen below, the devastation over the past 5 ½ weeks has been widespread and substantial, even though it is only a small portion of most of the peak to trough losses over the past three weeks.

The companies that have fared the best during the period in question have done so partly with a stronger post-October 12 runup, but also by doing a better job of weathering the current downturn. These are the tech stalwarts, AAPL and RIMM (GOOG was also up 11 points during this span), as well as the two Chinese tech plays, BIDU and CHL.

I have been short five stocks on this list at one time or another during the past three weeks: AAPL; BIDU; GRMN; DRYS; and CROX. I suspect that most of the easy money on the short side has already been made, but if the NDX fails to hold 2000 and if the NASDAQ composite cannot stay above the 200 day SMA (currently 2584), I’ll flip from neutral to bearish and look to this list to find where the momentum money is most nervous.


Tuesday, November 6, 2007

SPDR Check: Technology and Financials

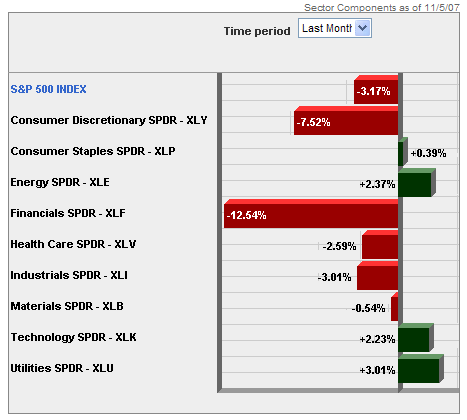
Back in August, I posted about some interesting divergences in implied volatility in the technology and financial sectors. Fast forward two and a half months and with Citigroup (C), Merrill Lynch (MER) and their brethren in the dog house while Google (GOOG), Research in Motion (RIMM) and the most of the other large cap tech stocks on a tear, the story has morphed from diverging implied volatility to diverging performance and future expectations.

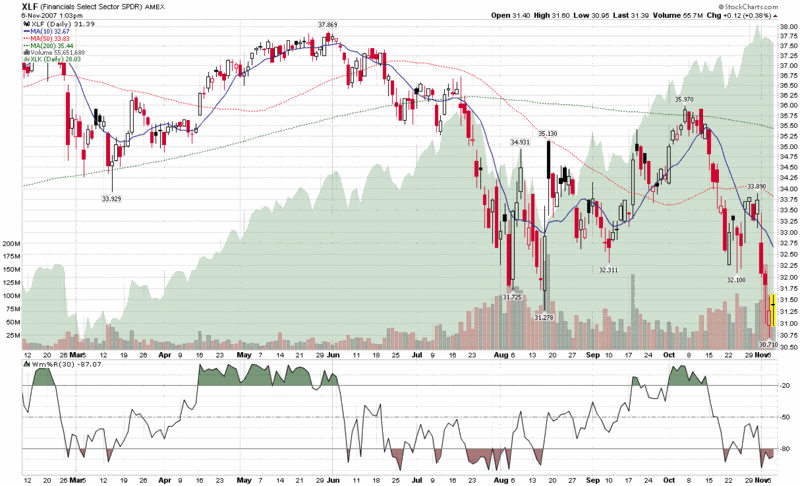
So this seems like a good time to look at my favorite AMEX Select Sector SPDRs again to see what has happened. In the chart below, I compare the plight of XLF, the financial sector SPDR (XLF top holdings), to XLK, the technology sector SPDR (XLK top holdings.) Where I see the big divergence in performance is following the second week in October, from which point the financials have been beaten down almost as badly as they were during the dramatic July-August drop. The interesting part this time around is technology stocks, which fell in sympathy with financials during the summer, yet have been almost unassailable during the past three weeks.

I am skeptical that the market can continue to remain in a bullish mode without the participation of the financials, yet, on the other hand, the fundamentals of technology stocks do not seem to warrant that they join financials on the bear side of the ledger. For now at least, the bears will have to be content with claiming victory in the financial, consumer discretionary and real estate sectors, while the bulls control the majority of the remaining sectors. Eventually, I expect all the bulls or all the bears to capitulate in a dramatic major move. I’m not sure whether the move will be up or down, but each sector skirmish will provide some additional clues.

Monday, November 5, 2007

BIDU and FXI Going Separate Ways Today

Last week I detailed the components of the iShares FTSE/Xinhua China 25 Index (FXI), the ETF that began the day with a gain of 87% for 2007.

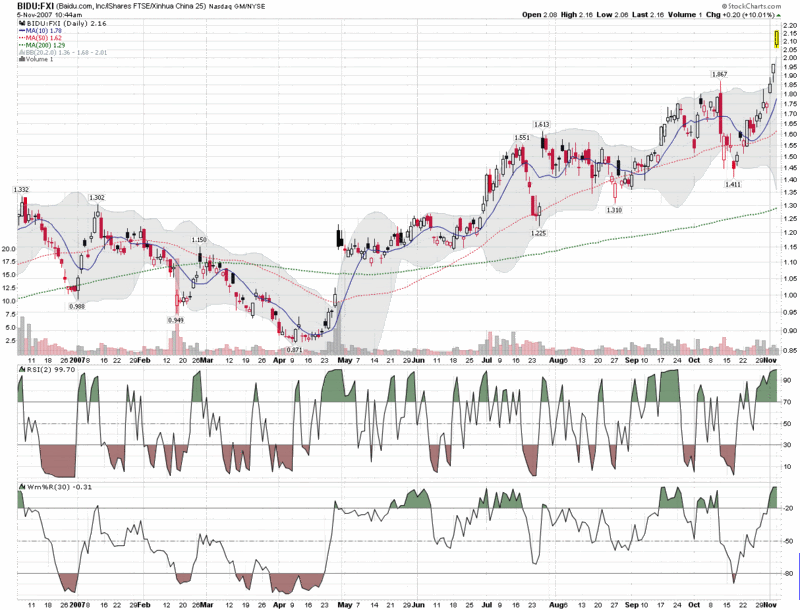
With year to date gains of 263% for the same calendar year, Baidu (BIDU), the internet search juggernaut occasionally referred to as ‘the Chinese Google’ appears to be playing a different game altogether – and in some respects it is. BIDU is not part of the FXI, but it has garnered considerable attention in the western press for its dominance in the Chinese search market. BIDU has also seemed to be impervious to the recent tech selloffs as well. This morning the stock even shook off the biggest drop in Hong Kong stocks since 9/11 as well as some negative commentary in Barrons (a preference for GOOG over BIDU) to turn a 9 point loss into a 12 point gain. While this is indeed an impressive performance, what is most impressive of all is that today’s price action in BIDU has come while the FXI has been struggling with a loss in the area of 7-10%.

All of which leads to the chart below. I have been speculating that many of the 240 points BIDU has tacked on since mid-August are at risk before the end of the year and now wonder whether the separation from FXI on the chart may not just be a visual jumping of the shark, but a metaphorical one as well. BIDU has printed several bull flags in the past few months that have proved to be pauses on the way up. If the stock continues up while the FXI heads back to earth, I will be looking to buy BIDU puts on the first sign of weakness.

Friday, October 26, 2007

NASDAQ 100 Taking NASDAQ Composite for a Ride

This is probably just stating the obvious, but in keeping with the recent theme of a handful of generals and market breadth analysis, I thought I should highlight a comment from yesterday by Ben Bittlrolff who points to a recent observation by Mike Shedlock that half of the gains in the NASDAQ so far this year are from only three stocks: AAPL, RIMM, and GOOG.

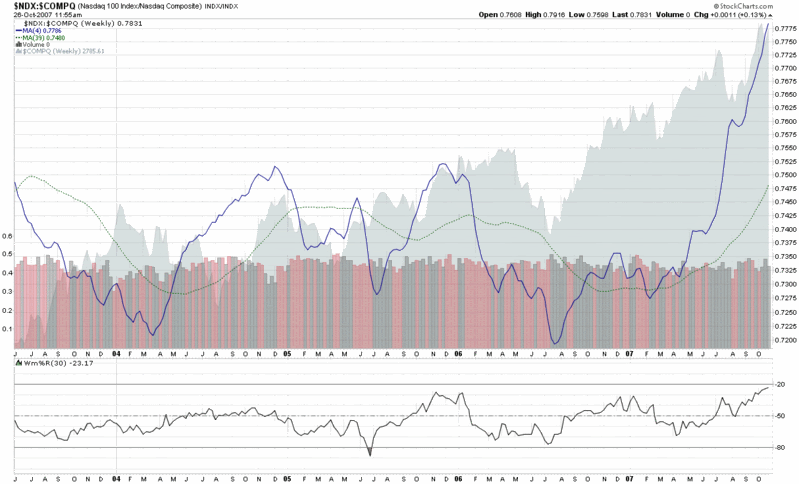
Expanding a little on that thought, I have constructed a weekly chart of the ratio of the NASDAQ-100 (NDX) to the NASDAQ Composite. For visual simplicity, I have eliminated the weekly values and included only the four week and 39 week simple moving averages. The storyline is fairly straightforward: ever since the February 27th selloff, the NASDAQ-100 [listing of the components of the NASDAQ-100] has been pulling the broader composite along for the ride. Scroll back to Mike Shedlock’s comments about the big three horses and it appears that these three en fuego large caps have been pulling both the NASDAQ-100 and the 3000+ stock composite index.

As I see it, one of two things is about to happen: either some other fresh horses are about to appear to help pull the sled or AAPL, RIMM and GOOG are going to run out of energy trying to get up one of these upcoming hills. Be sure to watch the ratio of the NASDAQ-100 to the NASDAQ composite for some clues on how this story is developing.

Wednesday, October 24, 2007

Four Generals Will Tell the Story

I am a big fan of market breadth indicators, but when considering whether or not the markets may be at a turning point, I prefer to focus on a handful of leaders rather several thousand small caps whose fortune is never to make it to CNBC’s scrolling ticker. Jeopardy may have “foods that begin with the letter Q” (one of my favorite movie scenes, for reasons I’m still not entirely sure of), but somehow I don’t think we’ll ever hear, “I’ll take micro-cap tickers for $200, Alex.”

Cramer has his “Four Horsemen of Technology” (RIMM, AMZN, GOOG, and AAPL), but this sector focus, while important, is a little too restrictive for my liking. I do think, however, that it is possible to get some meaningful information from watching only four stocks.

Right now, four areas of the economy that I am watching most closely are China, technology, global trade, and consumer spending. These areas just happen to coincide with four stocks that have been market leaders over the past few months, are current or recent members of my OHFdex (Overripe High Fliers Index), have recently made new highs, and probably need to continue to make new highs for this market to continue to the bull march.

In order of recent price strength, the four generals I am focusing on are Apple (AAPL), Baidu (BIDU), Southern Copper (PCU), and MasterCard (MA). Interestingly enough, it is possible that each of these stocks has already made an intermediate-term top. Apple has been the strongest of the group, but following an impressive earnings report on Monday evening, the stock gapped up and has slowly been drifting down since then. It would be hard to proclaim a top in AAPL right now, but the short-term momentum appears to have left the stock. Baidu’s earnings are tomorrow, but the high of October 11th is already starting to look like a possible top, as BIDU trades about 30 points below that high at the moment. Southern Copper has also been drifting down since an October 11th high; yesterday’s earnings report has done nothing to change the trend. Lastly, MasterCard’s high water mark dates from July 13th. The company has been a consistently impressive performer since it’s May 2006 IPO, during which time it has quadrupled in price. For the past three months the action has been mostly sideways, with the stock rising and falling over concerns about the impact of the credit crisis on retail spending.

My personal belief is that all four stocks will continue to come under pressure as the markets grapple with the possibility that the October 11th highs will be hard to take out. I am not a kiss and tell trader and I prefer not to talk about my trading and positions, but since many have asked, at present I am short all four generals, though I will not be short BIDU when it reports earnings tomorrow. For the record, anything less than a blowout quarter and BIDU could be the catalyst that turns the current small market correction into some longer term bearishness.

Now it’s your turn, readers. If you could only follow four individual stocks to divine the direction of the market, which stocks would those be?

DISCLAIMER: "VIX®" is a trademark of Chicago Board Options Exchange, Incorporated. Chicago Board Options Exchange, Incorporated is not affiliated with this website or this website's owner's or operators. CBOE assumes no responsibility for the accuracy or completeness or any other aspect of any content posted on this website by its operator or any third party. All content on this site is provided for informational and entertainment purposes only and is not intended as advice to buy or sell any securities. Stocks are difficult to trade; options are even harder. When it comes to VIX derivatives, don't fall into the trap of thinking that just because you can ride a horse, you can ride an alligator. Please do your own homework and accept full responsibility for any investment decisions you make. No content on this site can be used for commercial purposes without the prior written permission of the author. Copyright © 2007-2023 Bill Luby. All rights reserved.
 
Web Analytics