Showing posts with label BIDU. Show all posts

Thursday, October 31, 2013

Halloween Monsters

In the spirit of the day and lacking the resources and imagination to do something as elaborate as the Guillermo del Toro couch intro for the 2013 Treehouse of Horrors episode of The Simpsons (definitely worth a click through) I have elected instead to construct a portfolio of what I am calling the Halloween Monsters – a group of ten stocks that have been absolutely killing it this year, leading the markets higher.

The list includes the following familiar momentum names:

I intentionally left off Google (GOOG), in spite of an excellent 2013, largely because this behemoth now has a $346 billion market capitalization and there are some limits on how quickly on organization this size can grow.

With the inclusion of Baidu, the list reminded me a little of something I did back in October 2007, when I sensed a little too much froth in the stock market and created something I called the OHFdex, which began as a “watch list of Overripe High Fliers” and quickly evolved into an index designed to track 14 such stocks. When the markets turned down, the group was pummeled, with some spectacular crashes from the likes of CROCS (CROX), Las Vegas Sands (LVS), DryShips (DRYS) and others.

The current list is certainly filled with high fliers, but whether they are overripe or capable of soaring higher is not as obvious as it was in October 2007 – at least for me. For that reason, I will keep a close eye on the Halloween Monsters portfolio going forward, as their movements will likely be a tip off as to where the broader markets are headed.

[source(s): Finviz.com]

At the very least, I expect the stocks on this list to offer some interesting fodder for the archives, just as the OHFdex did in 2007 and 2008. Who knows, perhaps the next iteration of the OHFdex is just around the corner.

For more on the OHFdex and similar flights of fancy, check out the links below.

Related posts:

Disclosure(s): none

Wednesday, November 12, 2008

People Trading BIDU Also Traded…

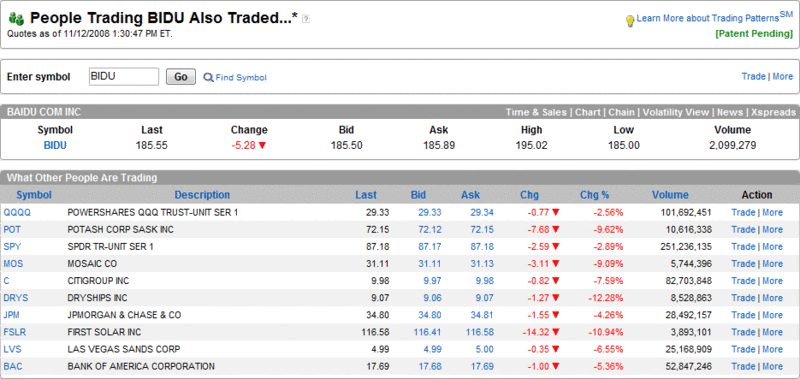
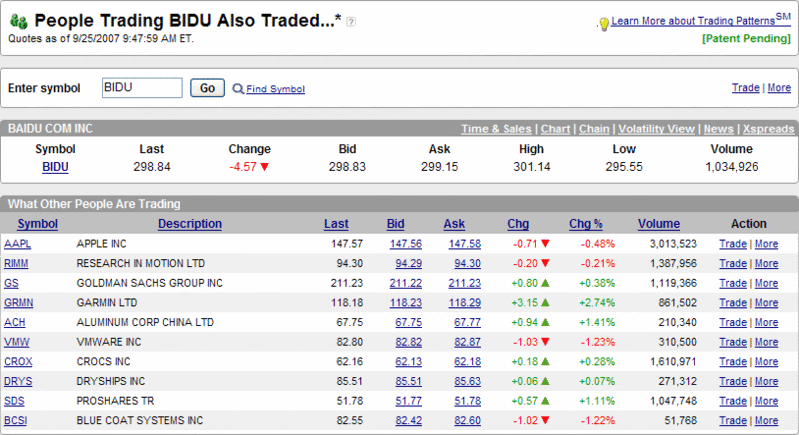
Back in September 2007, I started periodically posting snapshots from the optionsXpress Trading Patterns feature and chose to highlight the highly speculative Chinese internet search firm, Baidu (BIDU), then trading at 299, as my guinea pig. Over the course of seven months, I twice updated what traders who traded BIDU were also trading at optionsXpress when BIDU was at 380 on 10/30/2007 and when it was at 350 on 4/22/2008.

I just captured the most recent Trading Patterns update, which shows traders who are trading BIDU (currently at 185) are still active in the most volatile names in agriculture, financials, shipping, solar, and casinos. The stocks on the top ten list: Potash (POT), Mosaic (MOS), Citigroup (C), JPMorgan Chase (JPM), Bank of America (BAC), DryShips (DRYS), First Solar (FSLR), and Las Vegas Sands (LVS). Also on the list are two ETFs, QQQQ and SPY. Either optionsXpress customers have been cleaning up on the short side or they are a little early to the bull party.

[source: optionsXpress]

Friday, October 10, 2008

OHFDEX One Year Later

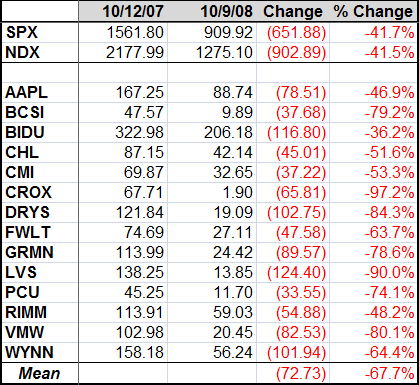
One year ago, in “From Overripe to Vulnerable?” I introduced something I called the OHFdex or listing of Overripe High Fliers, along with 14 CandleGlance charts from StockCharts.com for the highest fliers.

Needless to say, the picture one year later is an ugly one.

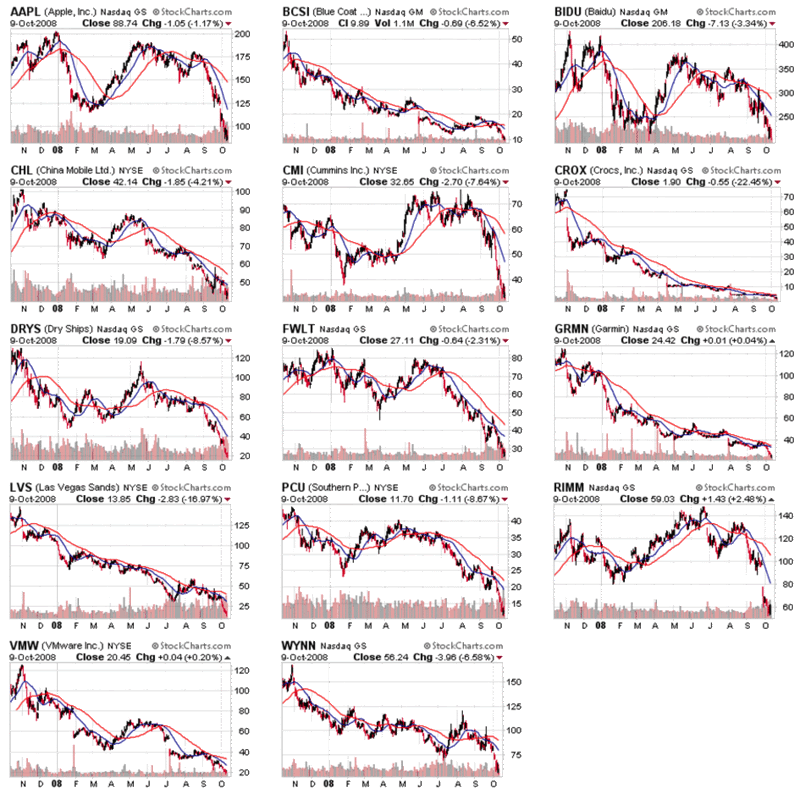
Not only were these stocks overripe and vulnerable a year ago, but they were ripe for decimation. CROCS (CROX) is down over 97% in a year, Las Vegas Sands (LVS) is down 90%, and both DryShips (DRYS) and VMware (VMW) are down more than 80%. All told, 11 of the 14 former high fliers are down 50% or more. The mean decline was 67.7% and the median decline was 69.3%. The best performer among the group was Baidu (BIDU), the Chinese search engine company, which has lost 36% while the Chinese markets have fallen 57%.

I have also included one year charts (once again courtesy of StockCharts.com) for all 14 members of the OHFdex below, with a 20 day SMA in blue and a 50 day SMA in red:

[source: StockCharts]

Sifting among the rubble of today’s meltdown, it looks as if it is about time to create a new list of oversold stocks that can prosper over the course of the next year.

Tuesday, April 22, 2008

BIDU Speculators

When I first looked at the optionsXpress trading patterns (“People Trading ___ Also Traded ___”) function back in September, I certainly did not expect that it would become a recurring feature on the blog.

I did, however, have the good fortune of selecting Baidu (BIDU) as my example stock and came up with a good list of speculative companies – all of which were taken to the woodshed at the end of October and sold aggressively over the past six months or so.

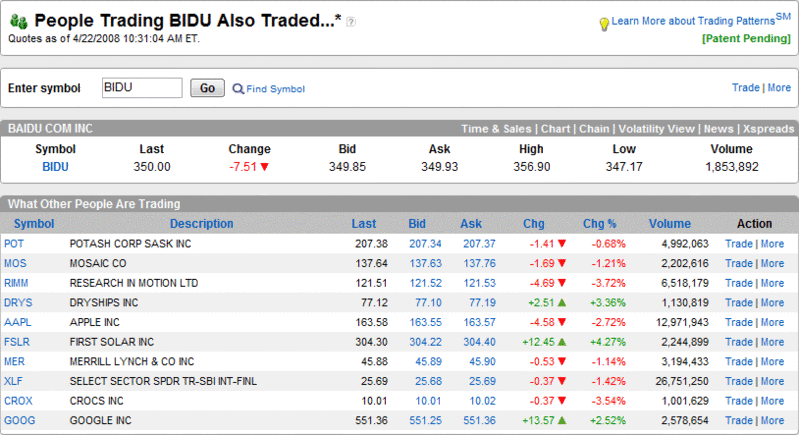
Here we are in April and the market has put in a provisional bottom and lo and behold, BIDU is up over 70% in the past month. So, I asked that same rhetorical question once again and optionsXpress was kind enough to oblige me with a list of companies that BIDU speculators have been pushing up over the past month. [All optionsXpress customers can do the same for any security by going to the Quotes tab, clicking on Quote Detail, then clicking on the People Trading… link under the chart on the right.]

There are no real surprises on my end this time around, save perhaps the inclusion of two financial plays, MER and XLF, though it is interesting to see how the list has changed since the last time I did this, which just happened to be on October 30, 2007, at the time the markets were peaking.

Thursday, February 28, 2008

optionsXpress Trading Patterns and the VIX

One of the trading tools that satisfies my inner investment voyeur is the Trading Patterns feature at optionsXpress. If the “Trading Patterns” name doesn’t ring a bell, you might also know this feature as “People Trading ___ Also Traded…” in the spirit of Amazon’s recommendation technology and predecessor technology that dates back to internet pioneer Firefly Network Inc.

In the past, I have used the Trading Patterns data to see which companies were being most actively traded by those who are seeking high risk speculative momentum plays. I somewhat arbitrarily made BIDU the poster child for these momentum chasers and have twice looked at what those who were playing with BIDU were also trading.

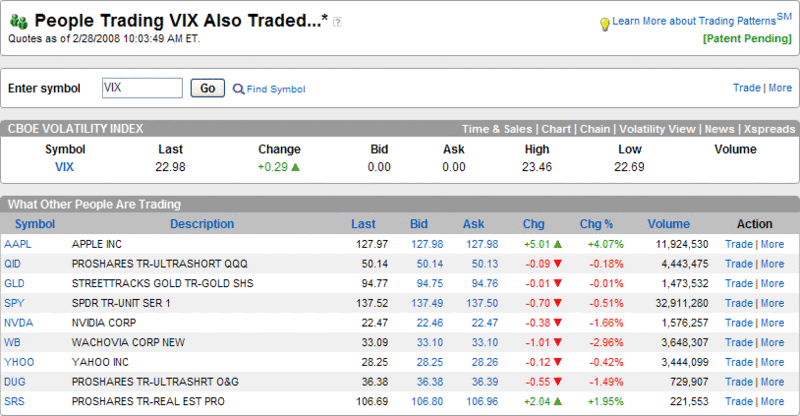
With all the discussion around potential substitutes for the VIX at least as a hedging tool, I thought it might be interesting to get a broader picture of those who trade VIX options. Thanks to Trading Patterns, I have captured just such a snapshot below. Not surprisingly, VIX traders are aggressive risk takers. In aggregate, they appear to be hoarding gold (GLD) and going short with the double inverse ETFs for real estate (SRS) and the NASDAQ-100 index (QID). It’s just a guess about the direction of some holdings, but the other positions appear to fall squarely in the short finance and technology camp: SPY, WB, AAPL, YHOO, and NVDA. The one finding that I see as somewhat surprising is the presence of the ProShares Ultrashort Oil & Gas ETF (DUG). Given the list of trading vehicles, I am concluding that the VIX players see oil and gas as overbought instead of a safe haven like gold. In any event, it is clear that the pessimism of VIX traders continues to be grounded in an expansion of the real estate and financial woes, the expectation that this will drag technology down with it, and the opinion that gold is the most sensible long position at the moment.

Thursday, February 14, 2008

BIDU, Calls and Time Decay

I am generally not a fan of being long any options during options expiration week, as the effort required to ‘salmon’ upstream against the relentless current of time decay (theta) makes these trades extremely challenging. Not only do you have to get the direction right, but you have to do it in a big way and in a hurry. Of course, if there is another volatility event that you have to overcome during options expiration week, that makes the task even more difficult.

Baidu (BIDU) is a perfect case in point. Earnings came out after the close last night and while the most recent quarter comfortably exceeded expectations, the company’s tepid guidance had some analysts wondering what the future revenue stream looks like.

With the conflicting numbers and multiple interpretations available, the market action has been interesting to watch. After closing at 261.09 yesterday, BIDU traded up almost 30 points in the after hours session last night, before settling back to an after hours gain of about 18 points. In pre-market the stock gradually slid down to 274, up about 13 points over Wednesday’s close. When the regular session opened, the stock fell quickly to 263, recovered sharply to trade briefly above 280, and has been in a downtrend ever since, currently trading back down to about 267.

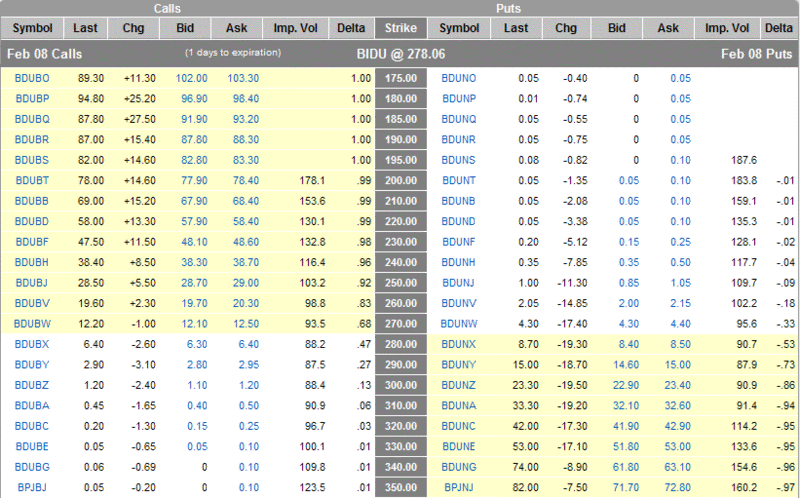
The first graphic, which comes from optionsXpress, shows how the options were behaving after about a half hour of trading, when BIDU was up 16.97 at 278.06. If you happened to be long BIDU calls at a strike of 270 or above, you were losing money, even with the stock up 6.5%.

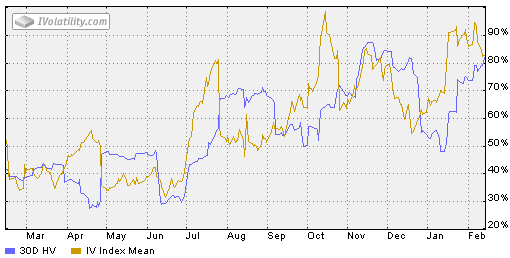
Normally, one would expect a post-earnings volatility crush, where IV contracts and all options lose their value, but as the iVolatility chart on the bottom shows, IV was not particularly high (relative to recent historical BIDU levels) coming into earnings, nor did it drop dramatically after earnings were out (see the IV numbers in the optionsXpress table.)

BIDU’s action today is an excellent illustration of what happens toward the end of the options expiration cycle, when time decay accelerates. While it is still possible to make money being long options, the percentages are with those who are on the side of time decay. If you are looking at a stock with high IV and an earnings report or other volatility event, consider that at the money options can still be losers even if you get the direction correct and have a 6.5% move in the underlying on your side.


Wednesday, November 21, 2007

OHFdex Update

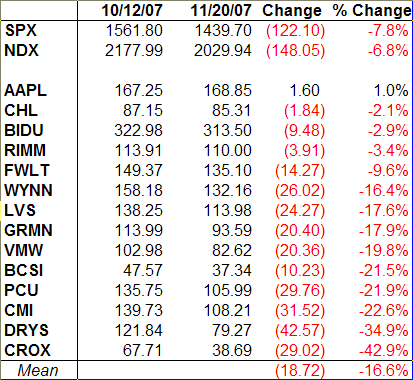
Since several readers expressed some interest – or at least some amusement – in the OHFdex (Overripe High Fliers Index) I unveiled back on October 12th, I though it might be interesting to see how these high fliers have fared during the recent market turmoil.

Given that most major indices peaked at the end of October, I did not expect the changes from October 12 to November 20 to be particularly dramatic, but as can be seen below, the devastation over the past 5 ½ weeks has been widespread and substantial, even though it is only a small portion of most of the peak to trough losses over the past three weeks.

The companies that have fared the best during the period in question have done so partly with a stronger post-October 12 runup, but also by doing a better job of weathering the current downturn. These are the tech stalwarts, AAPL and RIMM (GOOG was also up 11 points during this span), as well as the two Chinese tech plays, BIDU and CHL.

I have been short five stocks on this list at one time or another during the past three weeks: AAPL; BIDU; GRMN; DRYS; and CROX. I suspect that most of the easy money on the short side has already been made, but if the NDX fails to hold 2000 and if the NASDAQ composite cannot stay above the 200 day SMA (currently 2584), I’ll flip from neutral to bearish and look to this list to find where the momentum money is most nervous.


Thursday, November 8, 2007

BIDU Fibonacci Targets

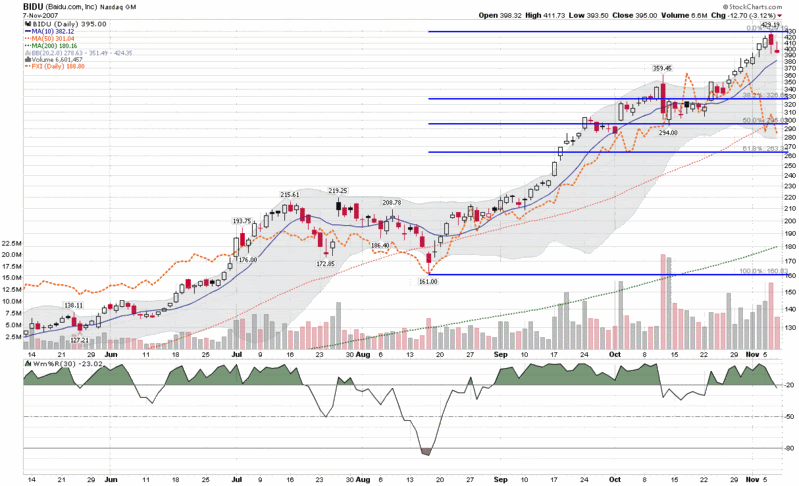
In measuring back to the mid-August low, I calculate BIDU's Fibonacci retracement targets to the downside to be 326 (38.2%), 295 (50%), and 263 (61.8%). This could get interesting.

Monday, November 5, 2007

BIDU and FXI Going Separate Ways Today

Last week I detailed the components of the iShares FTSE/Xinhua China 25 Index (FXI), the ETF that began the day with a gain of 87% for 2007.

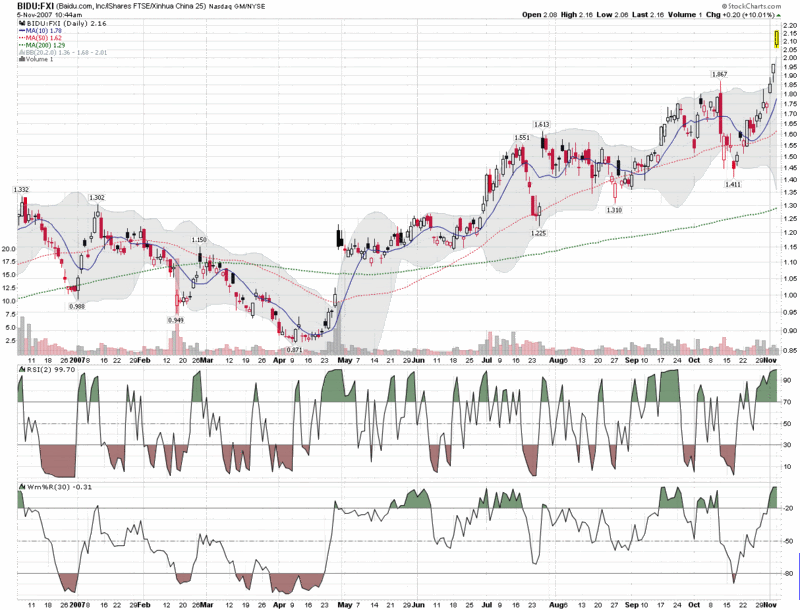
With year to date gains of 263% for the same calendar year, Baidu (BIDU), the internet search juggernaut occasionally referred to as ‘the Chinese Google’ appears to be playing a different game altogether – and in some respects it is. BIDU is not part of the FXI, but it has garnered considerable attention in the western press for its dominance in the Chinese search market. BIDU has also seemed to be impervious to the recent tech selloffs as well. This morning the stock even shook off the biggest drop in Hong Kong stocks since 9/11 as well as some negative commentary in Barrons (a preference for GOOG over BIDU) to turn a 9 point loss into a 12 point gain. While this is indeed an impressive performance, what is most impressive of all is that today’s price action in BIDU has come while the FXI has been struggling with a loss in the area of 7-10%.

All of which leads to the chart below. I have been speculating that many of the 240 points BIDU has tacked on since mid-August are at risk before the end of the year and now wonder whether the separation from FXI on the chart may not just be a visual jumping of the shark, but a metaphorical one as well. BIDU has printed several bull flags in the past few months that have proved to be pauses on the way up. If the stock continues up while the FXI heads back to earth, I will be looking to buy BIDU puts on the first sign of weakness.

Thursday, November 1, 2007

What’s in the FXI?

Now that the iShares FTSE/Xinhua China 25 Index (ticker FXI) is regularly trading 5 million or so shares per day, it would be fairly easy for a trader to make a living trading just this one basket of China stocks. It has volatility, it has options (check out the new Morningstar options data if you haven’t already), and it will soon have a 2x inverse ETF (ticker FXP) if you want to play the other side at twice the speed.

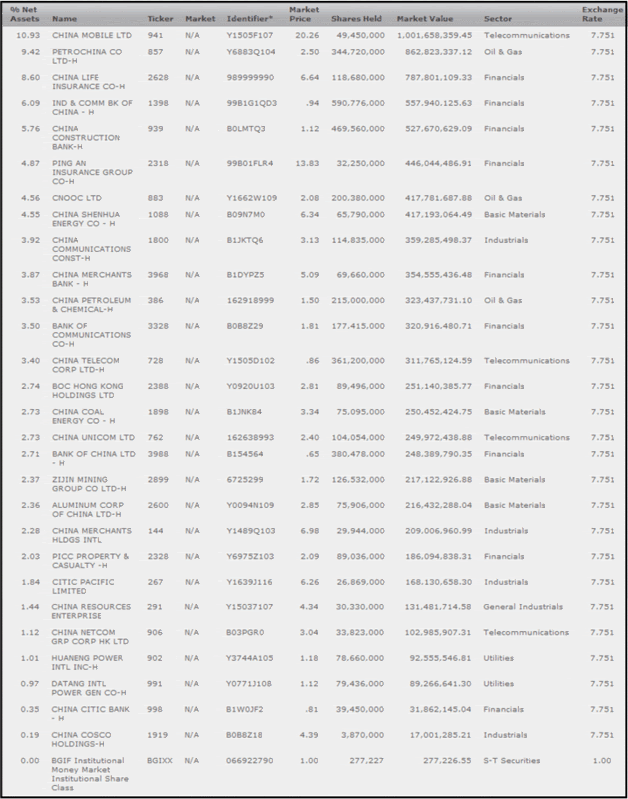
But what is in this index? Note that the China internet stocks (BIDU, FMCN, SOHU, SINA, etc.) and the China solar stocks (LDK, JASO, TSL, YGE, etc.), both recent market darlings, are conspicuously absent from the list. I have included an October 31, 2007 snapshot of the components of the FXI, with all quotes from the Hong Kong Stock Exchange:


Ten companies included in the FXI are also traded on the NYSE with ADRs. For easy reference I offer links to a Yahoo Finance version of that list in an intra-day format and also in the more detailed summary format. At the moment, all ten companies on this list are trading down 2-6% for the day, while the FXI is down 3.4% after hitting a new high of 219.56 during yesterday’s trading session.

When the FXP arrives, I will probably give it a test drive, but not until there is more convincing evidence that the FXI has put in at least a short-term top. At that point, the volume in the FXP may also provide some interesting clues about investor sentiment, specifically the breadth and depth of concern about a bubble in the Chinese stock market. For now at least, there is no reason to believe that the China trend is going to end soon and the best place continues to be on the long side.

Tuesday, October 30, 2007

Update on ‘People Trading BIDU Also Traded…’

Apropos of my earlier comments on China and the FXI, I feel compelled to made two additional observations:

ProShares just announced a new ETF that targets double the inverse of the FXI. The UltraShort FTSE/Xinhua China 25 (ticker FXP) is slated to launch sometime in November – and should provide a wild ride for anyone tall enough and brave enough to get on this roller coaster.

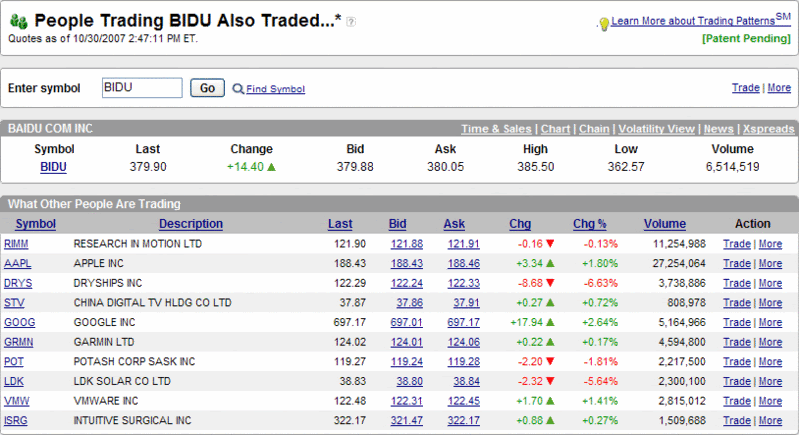
Given that BIDU is trading up some 14 points as I type this, I have updated the optionsXpress Trading Patterns feature (“People Trading BIDU Also Traded…”) which I first posted about a month ago. Many of the names are the same; this also has the appearance of a who’s who of speculative momentum trading.


Finally, I am officially neutral going into tomorrow’s FOMC announcement, but whichever side you are playing, be sure to fasten your seatbelt and cut your losses before they run away from you.

Wednesday, October 24, 2007

Four Generals Will Tell the Story

I am a big fan of market breadth indicators, but when considering whether or not the markets may be at a turning point, I prefer to focus on a handful of leaders rather several thousand small caps whose fortune is never to make it to CNBC’s scrolling ticker. Jeopardy may have “foods that begin with the letter Q” (one of my favorite movie scenes, for reasons I’m still not entirely sure of), but somehow I don’t think we’ll ever hear, “I’ll take micro-cap tickers for $200, Alex.”

Cramer has his “Four Horsemen of Technology” (RIMM, AMZN, GOOG, and AAPL), but this sector focus, while important, is a little too restrictive for my liking. I do think, however, that it is possible to get some meaningful information from watching only four stocks.

Right now, four areas of the economy that I am watching most closely are China, technology, global trade, and consumer spending. These areas just happen to coincide with four stocks that have been market leaders over the past few months, are current or recent members of my OHFdex (Overripe High Fliers Index), have recently made new highs, and probably need to continue to make new highs for this market to continue to the bull march.

In order of recent price strength, the four generals I am focusing on are Apple (AAPL), Baidu (BIDU), Southern Copper (PCU), and MasterCard (MA). Interestingly enough, it is possible that each of these stocks has already made an intermediate-term top. Apple has been the strongest of the group, but following an impressive earnings report on Monday evening, the stock gapped up and has slowly been drifting down since then. It would be hard to proclaim a top in AAPL right now, but the short-term momentum appears to have left the stock. Baidu’s earnings are tomorrow, but the high of October 11th is already starting to look like a possible top, as BIDU trades about 30 points below that high at the moment. Southern Copper has also been drifting down since an October 11th high; yesterday’s earnings report has done nothing to change the trend. Lastly, MasterCard’s high water mark dates from July 13th. The company has been a consistently impressive performer since it’s May 2006 IPO, during which time it has quadrupled in price. For the past three months the action has been mostly sideways, with the stock rising and falling over concerns about the impact of the credit crisis on retail spending.

My personal belief is that all four stocks will continue to come under pressure as the markets grapple with the possibility that the October 11th highs will be hard to take out. I am not a kiss and tell trader and I prefer not to talk about my trading and positions, but since many have asked, at present I am short all four generals, though I will not be short BIDU when it reports earnings tomorrow. For the record, anything less than a blowout quarter and BIDU could be the catalyst that turns the current small market correction into some longer term bearishness.

Now it’s your turn, readers. If you could only follow four individual stocks to divine the direction of the market, which stocks would those be?

Friday, October 19, 2007

A Small Pimple

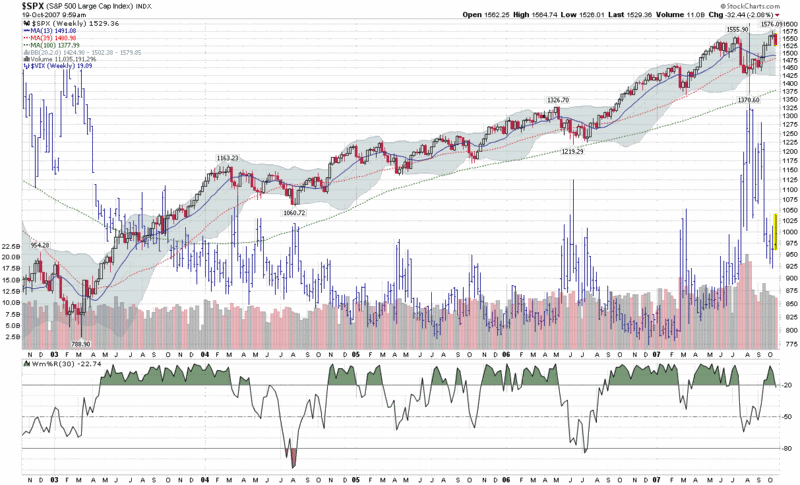
If you ever desire a better picture of what is really going on in the markets, just zoom out in time a little. This means that if you spend almost all of your time looking at daily charts and intra-day charts, step back and look at some weekly charts.

Take this week, for instance. It certainly has been a painful one for longs, particularly those who have been adhering to buy-on-the-pullback strategies. At some time, however, the bulls need to ask themselves when a pullback may be turning into a full blow bear market. We aren’t there yet – in fact it's not even close – and a glimpse at the weekly chart makes this week’s action look like little more than a pimple on a bull’s butt. More importantly, it’s just one week and a lone week of action is rarely decisive enough to mark a turning point with any degree of confidence – even if it generates three Hindenburg Omen signals.

Things will get interesting if and when some of the recent market leaders start to roll over in their short-term moving averages. With the exception of perhaps Mastercard (MA), I haven’t seen this happen yet, but I have my eyes on a few of the China stocks just in case, most notably: China Mobile (CHL); China Southern Airlines (ZNH); China Life Insurance (LFC); and, of course, Baidu (BIDU).

Monday, October 15, 2007

Correlation Ideation

Let’s say, for the sake of argument, that you are intrigued by the 71% gains that MOS has logged in the past eight weeks in Portfolio A1, but for whatever reason do not want to own that particular stock. Perhaps you have an opinion that the fertilizer stocks are overbought or that a supercycle is just beginning in this sector. Which stocks should you be looking at? I recommend visits to three free web sites that can help you answer this and other related questions: Market Topology; Sector SPDR Correlation Tracker; and DeepMarket.com’s correlation tool. Each of these sites has some particular strengths that I discuss below.

My first stop to evaluate correlation data is usually at MarketTopology.com. Once there, you need to click on the Equities Markets: USA link to arrive at their “i-work” page. From here, just enter the ticker and either click on the ‘Calculate’ button to return data in a table (usually the better choice) or try ‘Map’ to see a graphical representation of the securities with the highest correlation. There are several other boxes you can use to filter the results; these should be self-explanatory and ripe for experimentation. In the case of MOS, the four highest correlations returned are POT, CF, AGU, and TRA – all companies in the fertilizer sector. The next two most correlated securities are both materials ETFs: VAW, the Vanguard Materials ETF; and IYM, the iShares Dow Jones Basic Materials Sector Index Fund. It is these types of discoveries that make tangential company and sector research more fun and interesting. Note also that the table also has a column for ‘Average Daily Volatility’ for those interested in identifying highly correlated stocks or ETF that are significantly more or less volatile than the baseline security.

Among the three sites discussed here, the ease of use award would probably go to the Sector SPDR Correlation Tracker, which simply asks for a ticker and generates three lists: highest correlation sector SPDRs; highest correlation stocks/ETFs; and lowest correlation stocks/ETFs. As an added bonus, you can generate java comparison charts for any four securities on these lists for additional analysis. Let’s say you are interested in the FXI, but prefer to take a position in an individual stock instead of the ETF. Using the Sector SPDR correlation tracker, you would be pointed in the direction of CHL, CEO, LFC, and BIDU.

At the bottom of the list is DeepMarket.com, which scores high for content, but low for aesthetics. Their correlation tracking tool lists the top 5 highest positive correlations and (lowest) negative correlations for the past 10, 30, 100, and 200 day trading periods. The site provides the correlation coefficient and a rudimentary line chart, but little else. What I do like is the ability to slice and dice correlations over four different time periods (the longer time periods probably provide the most value,) but apart from that feature, the other two sites are to be preferred.

I should mention that while I have focused on positive correlations here, each site provides a list of the most extreme negative correlations as well. While these generally are not as strong correlations as the positive correlations, they do provide and excellent jumping off point for someone looking to add securities to a portfolio that may be inversely correlated to some of the portfolio’s riskier holdings. This type of approach is admittedly more art than science at the individual security level, but for those unable to evaluate portfolio level correlation data, it is a substitute worth exploring.

Sunday, October 14, 2007

VWSI Back to Zero. Was That the Bump?

In a week where Goldman Sachs hit a new all-time high while BIDU had a range of 58 points in one session, you could make the case that volatility is winding down or just warming up for the next act. Despite Thursday’s 13.3% jump in the VIX, the volatility index ended the week up only 4.8% or 0.92 points to 17.73. Still, this small bump was enough to send the VWSI back to neutral, following an unprecedented run of three consecutive high readings in the indicator.

The coming week is bound to provide considerable ammunition for both bulls and bears, as there are many important earnings reports in the technology and finance sectors. Barry Ritholtz at The Big Picture breaks things down in another excellent “Week in Preview” with details on earnings and upcoming government data, as well as the usual high quality set of links to some of the top commentary and analysis in the investment world. Even if you don’t click all the way through, be sure to check out Barry’s summaries.

For what little it is worth, I am more bearish than the VWSI, but the bears are going to have to do a lot better than a one day pullback to make me a believer. Perhaps earnings and options expiration will help to sort out the believers and the non-believers.

(Note that in the above temperature gauge, the "bullish" and "bearish" labels apply to the VIX, not to the broader markets, which are usually negatively correlated with the VIX.)

Wine pairing: For a VWSI of zero, I recommend an inexpensive Rhone blend. Inexpensive is a relative term, but with yesterday I finally got around to tasting a $13 wine that from D’Arenberg that managed to secure a 90 rating from Robert Parker: The Hermit Crab. The 2005 version is 70% viognier and 30% marsanne. To my palate, the marsanne sets the tone here, keeping the viognier component in check and delivering a subtle complexity that astonished me. Frankly, I can’t think of any white blend in this price range that I have enjoyed more in recent years. Seek this one out.

For other inexpensive Rhone blends, I continue to also recommend: Oakley Five Reds; Robert Hall’s Rhone de Robles and Tablas Creek’s Cote de Tablas Blanc; Wrongo Dongo, the contrarian favorite from Spain; and The Stump Jump (I prefer the white over the red) from Australia. If you are looking for additional ideas, I encourage you check out the Rhone Rangers.

Friday, October 12, 2007

From Overripe to Vulnerable?

I recently published a list of ten of my “Overripe High Fliers” in a post with the intriguing name of “BIDU: Hogs (Eventually) Get Slaughtered.” Ironically, BIDU was trading at 301 at the time of that post (September 25th), not too far from where it is as I type this, but I’ll save a more detailed discussion of BIDU for another day.

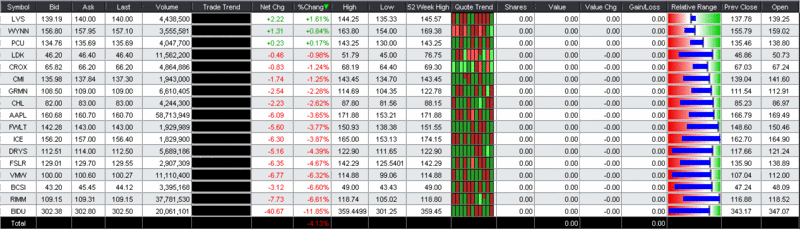
As of yesterday, my Overripe High Fliers list (yes, I actually call it an OHFdex) was up to 17 components. In the graphic below, I have sorted the OHFdex components by daily percentage change. Clearly the Macau gaming high fliers LVS and WYNN bucked the trend yesterday. Interestingly, those two stocks are down today while the tech stocks are rallying. The OHFdex group of 17 includes many of the market leaders and top performers from the past few months. If these continue to bounce back, then the bull market should remain strong. On the other hand, if this group falters, then the market will have to find new leadership or else succumb to the same gravity.


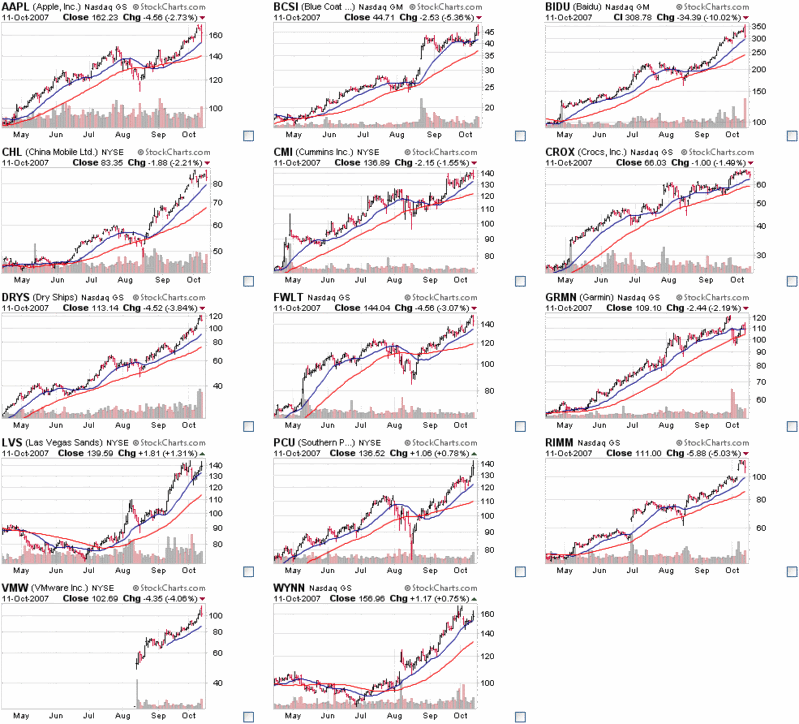
For quick visual reference, I have also included the CandleGlance charts from StockCharts.com for the 14 highest fliers (yes FSLR, LDK and ICE have been demoted.) For the record, these charts include a 20 day SMA in blue and a 50 day SMA in red:

Wednesday, September 26, 2007

VIX Oversold

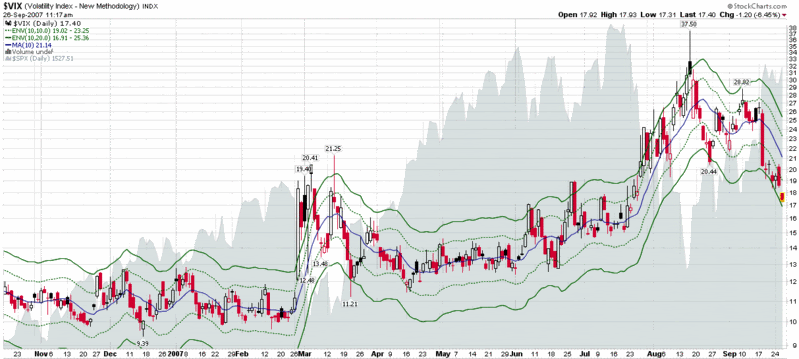
At 17.48, the VIX is now 17% below its 10 day SMA and 24% below its 20 day SMA, levels not seen since the end of June 2006. While I am not going to predict that the VIX will jump 43% over the next ten days like it did the last time it was this far below the two SMAs, history suggests that the VIX will start moving up from here and that the broader indices, some of which are approaching previous highs, are due for a selloff.

For the record, the chart below show the VIX with respect to its 10 day simple moving average, with the dotted green lines tracking +10% and -10% from that SMA and the solid green lines indicating the +20% and -20% levels from the 10 day SMA. As a general rule, mean reversion is increasingly likely the farther the VIX strays from the 10 day SMA.

I am inclined to think that the new floor in the VIX for the next month or so will be in the 16-17 range, but that is no more than a guesstimate. How the various sentiment indicators act as we test old highs will tell us a lot about the strength of this decidedly long in the tooth bull. Better not to anticipate, but to prepare for several different contingencies – and keep an eye on the VIX for some clues.

Also, apropos of yesterday's commentary, while the DJIA may be +80 at the moment, I note that many of the recent momentum stocks are in the red: BIDU, GRMN, LVS, BCSI, FWLT, MA, FSLR, AAPL, FCX, PCU, CMI, etc. Keep an eye on this development too.

Tuesday, September 25, 2007

BIDU: Hogs (Eventually) Get Slaughtered

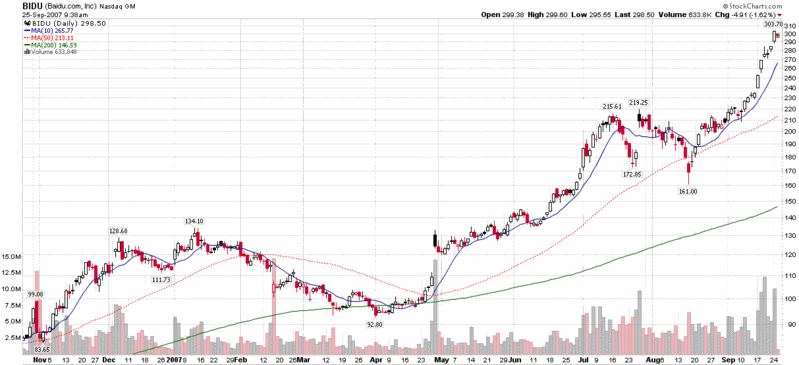
As I write this, BIDU is trading at about 301, meaning that if you got in near the August 16 low, you may be sitting on a 140 point profit.

I was indeed fortunate enough to grab some BIDU on August 16th, though nowhere close to the day’s low of 161. Over the course of the past few weeks I have been taking profits, with less than 10% of my initial position remaining after selling some earlier this morning.

As I was selling some shares, it occurred to me that it might be time to update my watch list of “Overripe High Fliers.” This is a list of ten momentum stocks that I keep a close eye on and expect to provide some clues about speculative activity. These stocks should be strong when the market is rallying and move sharply down when the market turns down. The list currently consists of AAPL, BCSI, BIDU, CROX, DRYS, FSLR, GRMN, LVS, RIMM and VMW.

In keeping with Amazon’s “people who bought X also…” approach, optionsXpress has a tool that tells you what people who traded BIDU were also trading. The results, in the graphic below, could easily be an updated list of those “Overripe High Fliers.” Consider that when BIDU finally makes a sharp turn south (and I expect a -20 day soon), the rest of the stocks on this list will probably be dumped with the same bath water. Contrarians, aim your guns at these targets.


…and don’t count on the nearly vertical rise in BIDU to continue much longer. As a general rule, the steeper the rise, the more spectacular the fall back to earth.

Friday, April 27, 2007

CNBC Million Dollar Portfolio Challenge: #1280

You would think that a nice 2.2% gain (thank you GSIC) in addition to maxing out on the $3000 ‘bonus bucks’ trivia winnings would have served me well on a day in which the markets were essentially flat. That was not the case yesterday, as the AMZN bus rolled past me – just like the BIDU bus has done today – and I ended up dropping 20 places to #1280. One of these days, I need to catch a ride on that bus…

Thanks to these gains, my portfolio was up to $1.73 million coming in to the trading day, still good enough to keep me in the top 0.1% of the 1,382,297 contestants. It looks like I could be moving up a little today, perhaps even in to the top 1000, as I have all my chips on NetLogic Microsystems (NETL), whose positive earnings report has the stock up 7% at the moment, down from a 14% advance earlier this morning.

On the horn front, if old mono recordings of Dennis Brain are not your thing, try the more modern recordings of Barry Tuckwell. As luck would have it, he is responsible for what may be the second best recording of the Mozart Horn Concertos, but one that benefits from 1990 recording technology. In addition to the Mozart works, there are many other excellent Tuckwell recordings to choose from, including The Art of Barry Tuckwell, which is pictured at the right.

DISCLAIMER: "VIX®" is a trademark of Chicago Board Options Exchange, Incorporated. Chicago Board Options Exchange, Incorporated is not affiliated with this website or this website's owner's or operators. CBOE assumes no responsibility for the accuracy or completeness or any other aspect of any content posted on this website by its operator or any third party. All content on this site is provided for informational and entertainment purposes only and is not intended as advice to buy or sell any securities. Stocks are difficult to trade; options are even harder. When it comes to VIX derivatives, don't fall into the trap of thinking that just because you can ride a horse, you can ride an alligator. Please do your own homework and accept full responsibility for any investment decisions you make. No content on this site can be used for commercial purposes without the prior written permission of the author. Copyright © 2007-2023 Bill Luby. All rights reserved.
 
Web Analytics