Showing posts with label OHFdex. Show all posts

Thursday, April 26, 2012

Whither Social Media Stocks?

Back in October 2007, sensing a little too much froth in the stock market, I created something I called the OHFdex, which began as a “watch list of Overripe High Fliers” and quickly evolved into an index designed to track 14 such stocks. When the markets turned down, the group was pummeled, with some spectacular crashes from the likes of CROCS (CROX), Las Vegas Sands (LVS), DryShips (DRYS) and others.

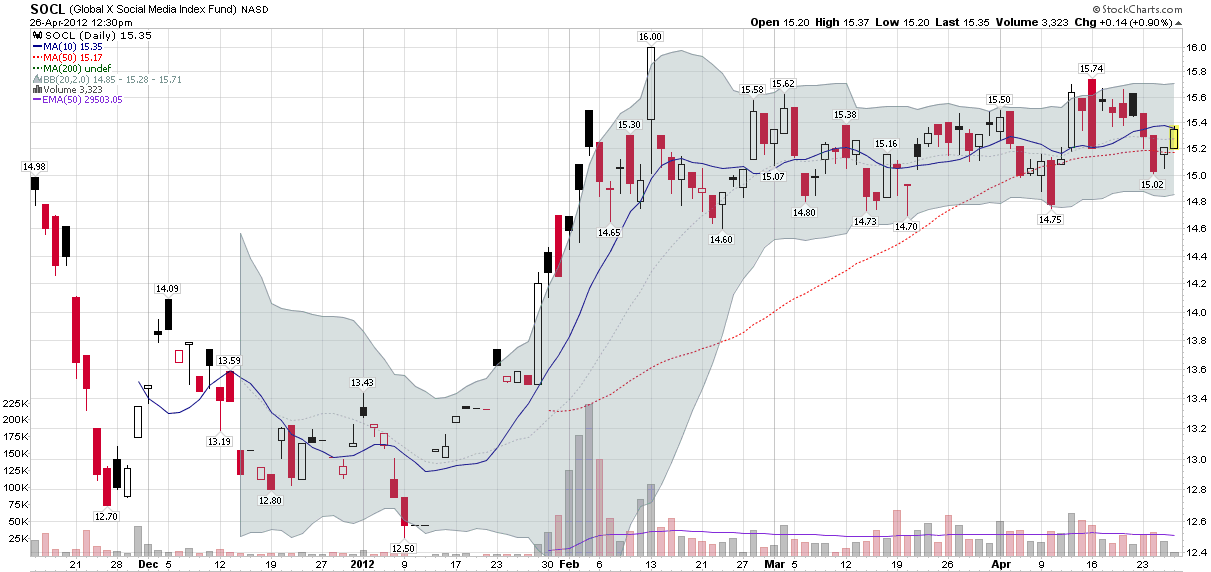
As stocks have continued their rise, I have thought about resurrecting the OHFdex, but I have not found sufficient reason to do so, until recently. The rise of social media stocks and some of the attendant valuations are the reason for my reconsidering the OHFdex. Clearly there will be winners as well as losers in this space, but relatively high valuations for LinkedIn (LNKD), Groupon (GRPN), Zynga (ZNGA), Pandora (P), Yelp (YELP), Angie’s List (ANGI), Jive Software (JIVE) and others have raised my eyebrows and even the launch of a Social Media ETF (SOCL, holdings) is enough to give me pause. The problem is that I have trouble picking the big winner from this group, particularly when adjusted for current market capitalization. The temptation is to short them all, but for now at least, it is time to put these stocks and counterparts such as RENN, YOKU, SOHU, REDF, DMD, FFN, etc. into a social media OHFdex and see how things play out.

I’m not saying this is October 2007 or tech media bubble 2.0, but every coal mine needs at least one canary.

As an aside, while I am lukewarm about the prospects for social media as a whole, I have been living on the bleeding edge of technology hardware and software for decades and am about as far from being a Luddite as one can be. I was surfing the Internet in the 80s, dragged my laptop on planes for at least two years before I saw anyone else do the same, had a US Robotics before it was branded “Palm Pilot,” bought my first digital camera in 1996, was on Facebook when it existed only inside two universities, and sometimes think that too much of my life has been spent as an inadvertent beta tester.

That being said, while it can be lots of fun to play with v0.9 of what might be the next big wave in technology, I wouldn’t recommend buying too many v0.9 stocks, particularly those that are based on nascent technologies.

Finally, if you have any interest in shorting these stocks and can’t find any shares available to short, consider buying puts, selling calls or creating a synthetic short position by doing both at the same time.

Related posts:

[source(s): StockCharts.com]

Disclosure(s): short GRPN, ZNGA, P and YELP at time of writing

Sunday, August 30, 2009

Chart of the Week: JunkDEX Tracks Speculative Frenzy in Junk Financials

Back in September 2007, when I thought the markets were a little too frothy, I created a list of Overripe High Fliers. A few weeks later, in From Overripe to Vulnerable? I took the current list of 14 overripe high flier stocks that had been drawing a great deal of speculative attention into something I called the OHFDEX – an index based on those overripe high fliers.

Not only was the timing of the OHFDEX impeccable, but the post became so popular that it spawned a number of follow-up posts, including, OHFDEX One Year Later.

In the spirit of the original OHFDEX, I have been watching closely the recent speculative frenzy in some stocks that have come to be known as “junk financials.” These are financial firms that were the recipients of government bailout funds during the financial crisis and now sell at valuations substantially below 2007 levels. They include American International Group (AIG), Fannie Mae (FNM), Freddie Mac (FRE), Citigroup (C), CIT Group (CIT) and Bank of America (BAC). In the last few weeks, these stocks have routinely accounted for 30% or more of the total volume on the NYSE and on Friday alone the group of six traded 2.53 billion shares.

While I find the transition from risk-averse behavior to risk-tolerant behavior on the part of investors to be an important step in the healing process, the recent headlong rush into risk-seeking behavior has me more than a little concerned. How healthy can the markets be when speculation in six companies that were all but bankrupt a few months ago now accounts for one out of every three shares traded each day?

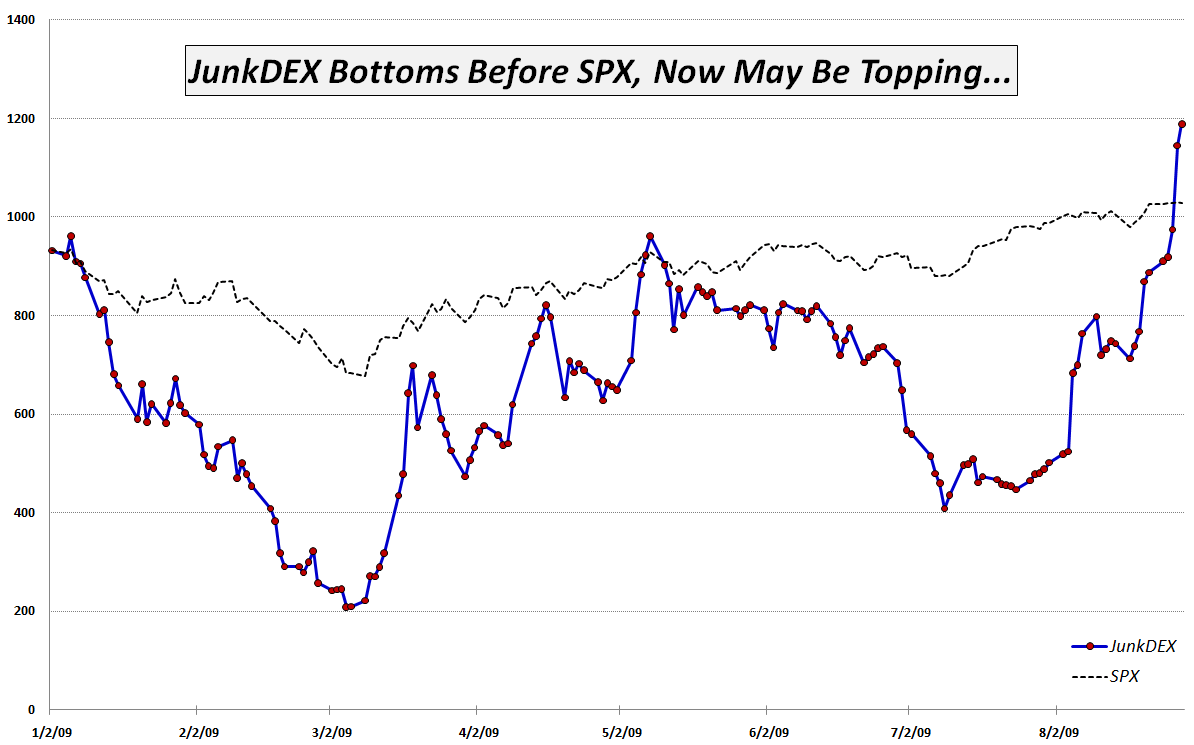
In order to track the speculative interest in junk financials, I have created what I am calling the JunkDEX, which consists of equally weighted positions (as of 1/2/09) in AIG, FNM, C, CIT and BAC (I elected to omit FRE due to the strong similarities with FNM.) I scaled the JunkDEX so that it had the same value as the SPX at the beginning of the year. As this week's chart of the week below shows, the JunkDEX led the S&P 500 index down from January through March, bottomed two days earlier and rallied impressively through the middle of May. From May through early August, the JunkDEX lagged the SPX significantly, before spiking dramatically during the past 3 ½ weeks.

The JunkDEX looks as if it may be approaching a blow-off top. If this turns out to be the case, I expect it will signal an imminent top in the broader markets, just as the OHFDEX did.

Going forward, I will keep an eye on speculative activity in the junk financials and in the JunkDEX for clues about the sustainability of the recent bull leg. I will update the performance of the JunkDEX, as appropriate and suggest that traders treat these stocks with extra caution, whether long or short.

[graphic: VIXandMore]

[Disclosure: short AIG at time of writing]

Friday, October 10, 2008

OHFDEX One Year Later

One year ago, in “From Overripe to Vulnerable?” I introduced something I called the OHFdex or listing of Overripe High Fliers, along with 14 CandleGlance charts from StockCharts.com for the highest fliers.

Needless to say, the picture one year later is an ugly one.

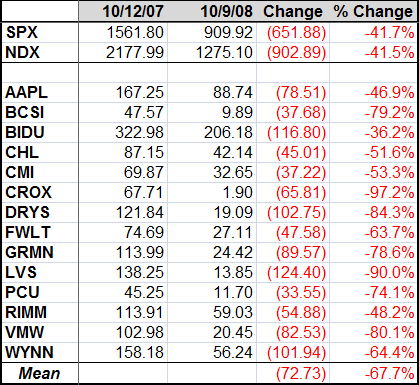
Not only were these stocks overripe and vulnerable a year ago, but they were ripe for decimation. CROCS (CROX) is down over 97% in a year, Las Vegas Sands (LVS) is down 90%, and both DryShips (DRYS) and VMware (VMW) are down more than 80%. All told, 11 of the 14 former high fliers are down 50% or more. The mean decline was 67.7% and the median decline was 69.3%. The best performer among the group was Baidu (BIDU), the Chinese search engine company, which has lost 36% while the Chinese markets have fallen 57%.

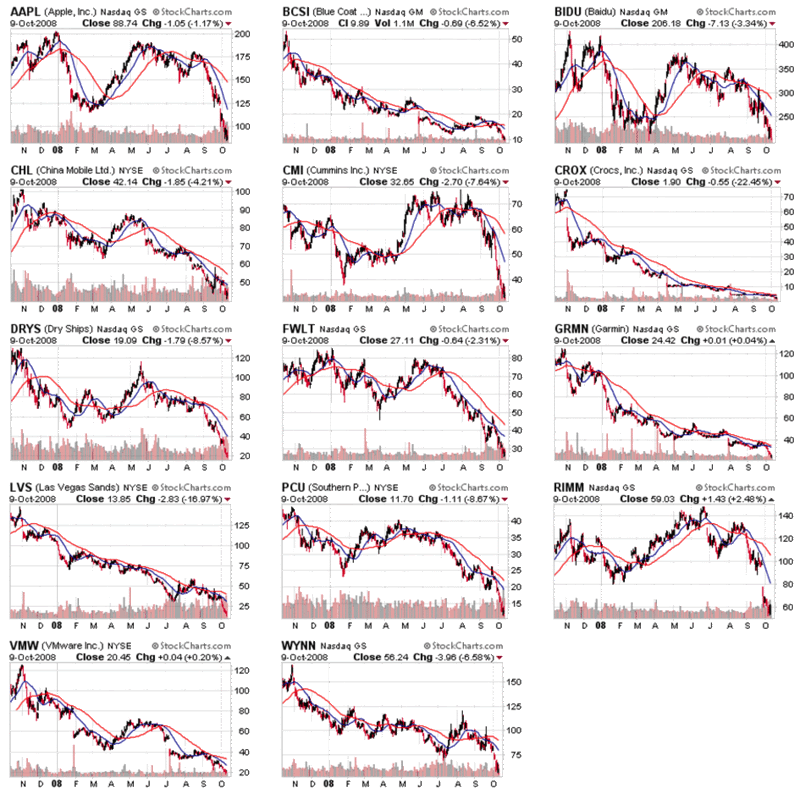
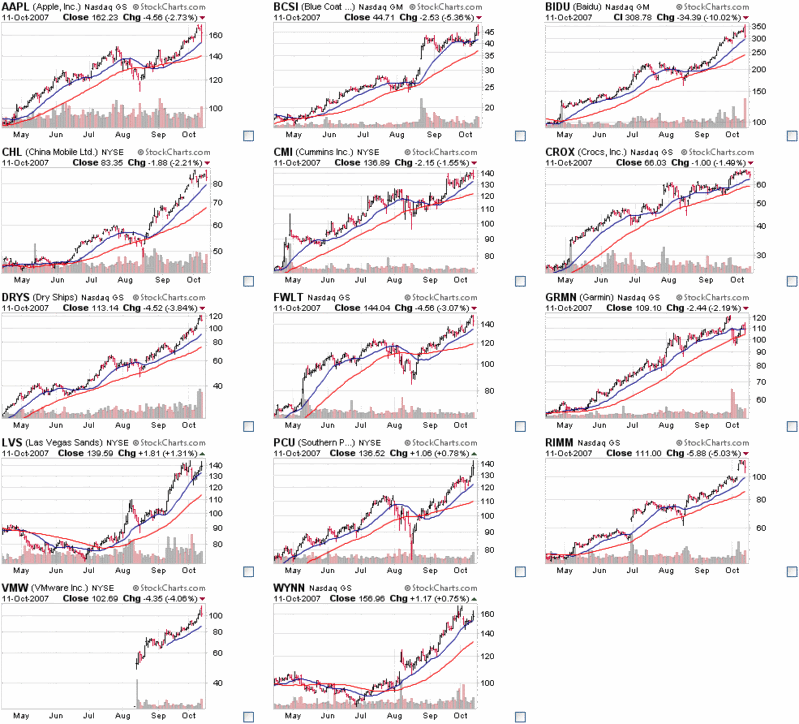
I have also included one year charts (once again courtesy of StockCharts.com) for all 14 members of the OHFdex below, with a 20 day SMA in blue and a 50 day SMA in red:

[source: StockCharts]

Sifting among the rubble of today’s meltdown, it looks as if it is about time to create a new list of oversold stocks that can prosper over the course of the next year.

Monday, December 17, 2007

OHFdex Getting Killed

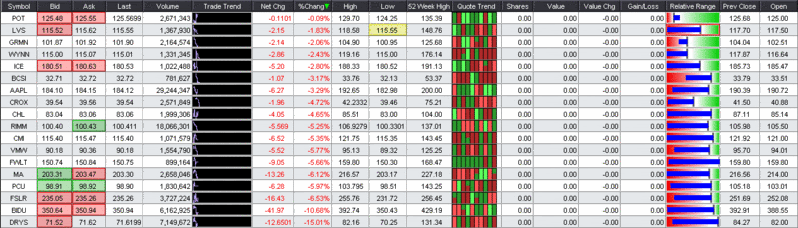
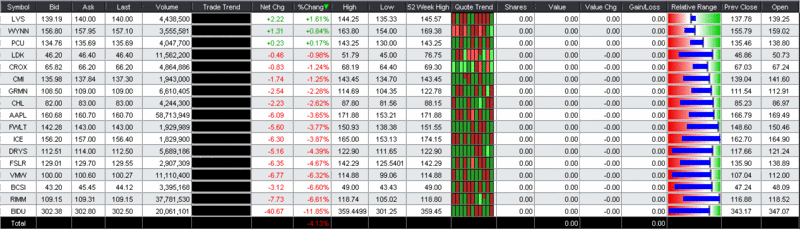
This is how the Overripe High Fliers index (OHFdex) looked just after 3:00 p.m. ET:

Wednesday, November 21, 2007

OHFdex Update

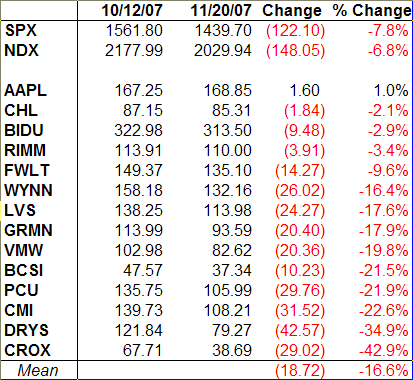
Since several readers expressed some interest – or at least some amusement – in the OHFdex (Overripe High Fliers Index) I unveiled back on October 12th, I though it might be interesting to see how these high fliers have fared during the recent market turmoil.

Given that most major indices peaked at the end of October, I did not expect the changes from October 12 to November 20 to be particularly dramatic, but as can be seen below, the devastation over the past 5 ½ weeks has been widespread and substantial, even though it is only a small portion of most of the peak to trough losses over the past three weeks.

The companies that have fared the best during the period in question have done so partly with a stronger post-October 12 runup, but also by doing a better job of weathering the current downturn. These are the tech stalwarts, AAPL and RIMM (GOOG was also up 11 points during this span), as well as the two Chinese tech plays, BIDU and CHL.

I have been short five stocks on this list at one time or another during the past three weeks: AAPL; BIDU; GRMN; DRYS; and CROX. I suspect that most of the easy money on the short side has already been made, but if the NDX fails to hold 2000 and if the NASDAQ composite cannot stay above the 200 day SMA (currently 2584), I’ll flip from neutral to bearish and look to this list to find where the momentum money is most nervous.


Wednesday, October 24, 2007

Four Generals Will Tell the Story

I am a big fan of market breadth indicators, but when considering whether or not the markets may be at a turning point, I prefer to focus on a handful of leaders rather several thousand small caps whose fortune is never to make it to CNBC’s scrolling ticker. Jeopardy may have “foods that begin with the letter Q” (one of my favorite movie scenes, for reasons I’m still not entirely sure of), but somehow I don’t think we’ll ever hear, “I’ll take micro-cap tickers for $200, Alex.”

Cramer has his “Four Horsemen of Technology” (RIMM, AMZN, GOOG, and AAPL), but this sector focus, while important, is a little too restrictive for my liking. I do think, however, that it is possible to get some meaningful information from watching only four stocks.

Right now, four areas of the economy that I am watching most closely are China, technology, global trade, and consumer spending. These areas just happen to coincide with four stocks that have been market leaders over the past few months, are current or recent members of my OHFdex (Overripe High Fliers Index), have recently made new highs, and probably need to continue to make new highs for this market to continue to the bull march.

In order of recent price strength, the four generals I am focusing on are Apple (AAPL), Baidu (BIDU), Southern Copper (PCU), and MasterCard (MA). Interestingly enough, it is possible that each of these stocks has already made an intermediate-term top. Apple has been the strongest of the group, but following an impressive earnings report on Monday evening, the stock gapped up and has slowly been drifting down since then. It would be hard to proclaim a top in AAPL right now, but the short-term momentum appears to have left the stock. Baidu’s earnings are tomorrow, but the high of October 11th is already starting to look like a possible top, as BIDU trades about 30 points below that high at the moment. Southern Copper has also been drifting down since an October 11th high; yesterday’s earnings report has done nothing to change the trend. Lastly, MasterCard’s high water mark dates from July 13th. The company has been a consistently impressive performer since it’s May 2006 IPO, during which time it has quadrupled in price. For the past three months the action has been mostly sideways, with the stock rising and falling over concerns about the impact of the credit crisis on retail spending.

My personal belief is that all four stocks will continue to come under pressure as the markets grapple with the possibility that the October 11th highs will be hard to take out. I am not a kiss and tell trader and I prefer not to talk about my trading and positions, but since many have asked, at present I am short all four generals, though I will not be short BIDU when it reports earnings tomorrow. For the record, anything less than a blowout quarter and BIDU could be the catalyst that turns the current small market correction into some longer term bearishness.

Now it’s your turn, readers. If you could only follow four individual stocks to divine the direction of the market, which stocks would those be?

Friday, October 12, 2007

From Overripe to Vulnerable?

I recently published a list of ten of my “Overripe High Fliers” in a post with the intriguing name of “BIDU: Hogs (Eventually) Get Slaughtered.” Ironically, BIDU was trading at 301 at the time of that post (September 25th), not too far from where it is as I type this, but I’ll save a more detailed discussion of BIDU for another day.

As of yesterday, my Overripe High Fliers list (yes, I actually call it an OHFdex) was up to 17 components. In the graphic below, I have sorted the OHFdex components by daily percentage change. Clearly the Macau gaming high fliers LVS and WYNN bucked the trend yesterday. Interestingly, those two stocks are down today while the tech stocks are rallying. The OHFdex group of 17 includes many of the market leaders and top performers from the past few months. If these continue to bounce back, then the bull market should remain strong. On the other hand, if this group falters, then the market will have to find new leadership or else succumb to the same gravity.


For quick visual reference, I have also included the CandleGlance charts from StockCharts.com for the 14 highest fliers (yes FSLR, LDK and ICE have been demoted.) For the record, these charts include a 20 day SMA in blue and a 50 day SMA in red:

Tuesday, September 25, 2007

BIDU: Hogs (Eventually) Get Slaughtered

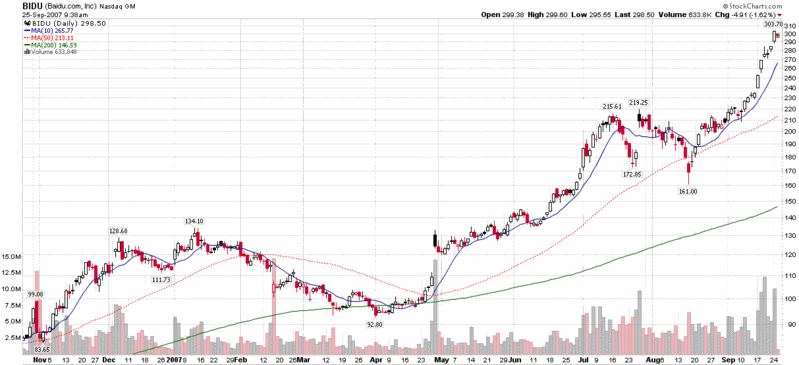
As I write this, BIDU is trading at about 301, meaning that if you got in near the August 16 low, you may be sitting on a 140 point profit.

I was indeed fortunate enough to grab some BIDU on August 16th, though nowhere close to the day’s low of 161. Over the course of the past few weeks I have been taking profits, with less than 10% of my initial position remaining after selling some earlier this morning.

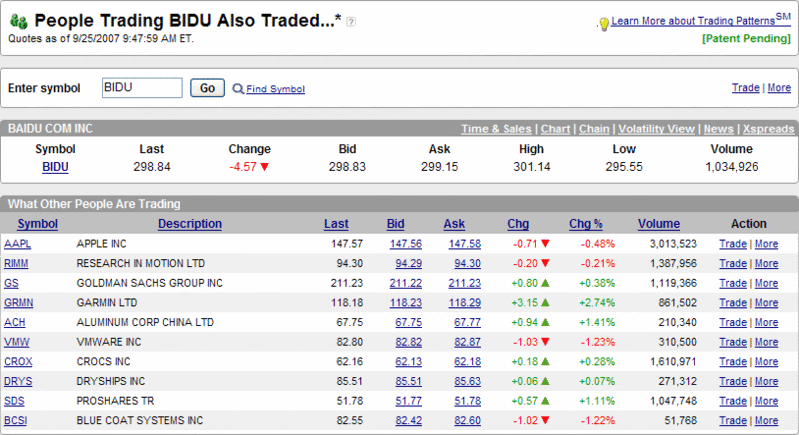
As I was selling some shares, it occurred to me that it might be time to update my watch list of “Overripe High Fliers.” This is a list of ten momentum stocks that I keep a close eye on and expect to provide some clues about speculative activity. These stocks should be strong when the market is rallying and move sharply down when the market turns down. The list currently consists of AAPL, BCSI, BIDU, CROX, DRYS, FSLR, GRMN, LVS, RIMM and VMW.

In keeping with Amazon’s “people who bought X also…” approach, optionsXpress has a tool that tells you what people who traded BIDU were also trading. The results, in the graphic below, could easily be an updated list of those “Overripe High Fliers.” Consider that when BIDU finally makes a sharp turn south (and I expect a -20 day soon), the rest of the stocks on this list will probably be dumped with the same bath water. Contrarians, aim your guns at these targets.


…and don’t count on the nearly vertical rise in BIDU to continue much longer. As a general rule, the steeper the rise, the more spectacular the fall back to earth.

DISCLAIMER: "VIX®" is a trademark of Chicago Board Options Exchange, Incorporated. Chicago Board Options Exchange, Incorporated is not affiliated with this website or this website's owner's or operators. CBOE assumes no responsibility for the accuracy or completeness or any other aspect of any content posted on this website by its operator or any third party. All content on this site is provided for informational and entertainment purposes only and is not intended as advice to buy or sell any securities. Stocks are difficult to trade; options are even harder. When it comes to VIX derivatives, don't fall into the trap of thinking that just because you can ride a horse, you can ride an alligator. Please do your own homework and accept full responsibility for any investment decisions you make. No content on this site can be used for commercial purposes without the prior written permission of the author. Copyright © 2007-2023 Bill Luby. All rights reserved.
 
Web Analytics